DEVELOPMENT OF NEW SIMULTANEOUS RP-HPLC METHOD
FOR THE ESTIMATION OF PIOGLITAZONE AND GLIMEPIRIDE IN
THE COMBINED TABLET DOSAGE FORM AND THEN
VALIDATION OF THE METHOD
K. Poonam*, Dr. P. Arun, P. Shailendra and D. Neelesh Kumar
*Shri Ram Group of Institution Faculty of Pharmacy, NEAR ITI Madhotal, Jabalpur (M.P).
ABSTRACT
In the present work, a rapid, accurate and precise RP-HPLC method
for the estimation of Pioglitazone and Glimepiride in tablets dosage
form [500/15/2mg] by selecting the various chromatographic
parameters. A new method was developed using 250mm x 4.6 mm,
reverse phase C 18 column, 5µm (XBridge C18, 250 X 4.6 mm; 5µ)
with mobile phase of 40 volumes of potassium dihydrogen phosphate
(Phosphate buffer pH 6.8) and 60 volumes of Methanol as mobile
phase and Methanol as diluent run as isocratic elution. Flow rate was
1.0 mL-1 with UV detection at 257nm and the injection volume was
set at 20µL with 20 minutes of runtime. The method was validated by
using various validation parameters like accuracy, precision, linearity, specificity and
stability in analytical solution and robustness. All the validation parameters were found to be
well within the acceptance criteria. Hence the method can be used for routine estimation of
Pioglitazone and Glimepiride tablets [500/15/2 mg].
KEYWORDS: RP-HPLC, Pioglitazone, Glimepiride, Method Development, Analytical Method Validation.
INTRODUCTION
Reversed-Phase HPLC (RP HPLC or RPLC)
Reversed-phase chromatography employs mainly dispersive forces (hydrophobic or van der
Waals interactions). The polarities of mobile and stationary phases are reversed, such that the
surface of the stationary phase in RP HPLC is hydrophobic and mobile phase is polar, where
mainly water-based solutions are employed. Article Received on
26 Oct. 2019,
Revised on 16 Nov. 2019, Accepted on 06 Dec. 2019,
DOI: 10.20959/wjpr20201-16439
*Corresponding Author
K. Poonam
Shri Ram Group of
Institution Faculty of
Pharmacy, NEAR ITI
Madhotal, Jabalpur (M.P).
Reversed-phase HPLC is by far the most popular mode of chromatography. Almost 90% of
all analyses of low-molecular-weight samples are carried out using RP HPLC. One of the
main drivers for its enormous popularity is the ability to discriminate very closely related
compounds and the ease of variation of retention and selectivity. Principal characteristic
defining the identity of this technique is the dominant type of molecular interactions
employed such as dispersive forces. As opposed to normal-phase HPLC, reversed-phase
chromatography employs mainly dispersive forces (hydrophobic or van der Waals
interactions). The polarities of mobile and stationary phases are reversed, such that the
surface of the stationary phase in RP HPLC is hydrophobic and mobile phase is polar, where
mainly water-based solutions are employed.
Reversed-phase HPLC is by far the most popular mode of chromatography. Almost 90% of
all analyses of low-molecular-weight samples are carried out using RP HPLC. One of the
main drivers for its enormous popularity is the ability to discriminate very closely related
compounds and the ease of variation of retention and selectivity. The origin of these
advantages could be explained from an energetic point of view: Dispersive forces employed
in this separation mode are the weakest intermolecular forces, thereby making the overall
background interaction energy in the chromatographic system very low compared to other
separation techniques. This low background energy allows for distinguishing very small
differences in molecular interactions of closely related analytes. As an analogy, it is possible
to compare two spectroscopic techniques: UV and fluorescence spectroscopy. In fluorescence
spectroscopy, emission registers essentially against zero background light energy, which
makes its sensitivity several orders of magnitude higher than in UV spectroscopy, where
background energy is very high. A similar situation is in RP HPLC, where its sensitivity to
the minor energetic differences in analyte–surface interactions is very high attributed to the
low background interaction energy.
Experimental Study
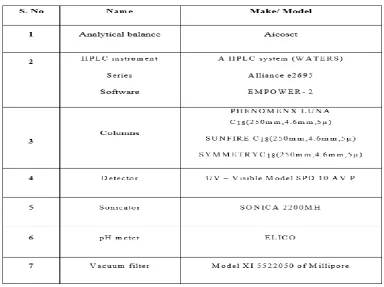
MATERIALS AND METHODS
Materials and Reagents: Pioglitazone and Glimepiride were procured from Medley Pharmaceuticals Ltd.
Potassium di hydrogen phosphate AR Grade, Acetonitrile, and Methanol HPLC grade from
Merck chemicals, Mumbai.
Preparation of buffer solution: Buffer was prepared by dissolving 6.8g of Potassium dihydrogen orthophosphate in 1000mL of water and adjusts the pH 6.0 ± 0.02 with dilute
KOH filtered followed by the degassing of the solution.
Preparation of mobile phase: 1000mL of mobile phase was prepared by mixing 600ml of buffer solution and 400ml of Acetonitrile.
Preparation of stock solutions: 165mg of Pioglitazone and 20mg of Glimepiride together was transferred to 100mL volumetric flask, dissolved and diluted to volume with mobile
phase and kept in an ultrasonic bath until it dissolved completely. This yielded solution
containing.
Preparation of Standard solution: Spiked accurately about 5ml of standard stock solution and transferred it into a 100mL volumetric flask. Made the volume up to the mark with
mobile phase and mixed well. This yielded solution containing Pioglitazone 82.5ppm and
[image:3.595.105.490.469.756.2]Glimepiride 40ppm.
METHOD DEVELOPMENT
Various chromatographic conditions were experimented to achieve better resolution and
efficiency of the chromatographic system. Parameters such as mobile phase composition,
wavelength of detection, column, column temperature, and pH of mobile phase were
optimized.
According to literature, Pioglitazone and Glimepiride are freely soluble in methanol and
acetonitrile. And it was checked for different dilutions of methanol and acetonitrile for
solubility of Pioglitazone and Glimepiride. Finally acetonitrile was chosen as solvent for
present work.
From the UV- Visible spectrophotometric results, the detection wavelength of 260nm (for
pioglitazone) and 230nm (for Glimepiride) was selected because at this wavelength they
shows maximum absorbance and then 230nm was selected as common wavelength for
simultaneous estimation of both the drugs as these are eluting in the same mobile phase at
maximum absorbance. Also at 230nm the chromatogram was observed in PDA detector
which was having very less absorbance compare to 260nm. So the chromatographic condition
was optimized at 230nm.
The different columns like SUNFIRE C18 (250mm, 4.6mm, 5µ), SYMMETRYC18 (250mm,
4.6mm, 5µ) did not show adequate resolution and column efficiency. The column
PHENOMENX LUNA C18 (250 X 4.6mm, 5µ) had shown good resolution and efficiency.
Buffers like sodium dihydrogen orthophosphate and disodium hydrogen orthophosphate did
not yield desired results.
The composition of mobile phase Buffer: Acetonitrile (60:40%v/v) of pH 6 with flow rate of 1.5ml/min and detection at 230nm of runtime of 30 min obtained a peaks eluted at
4.26minute of Glimepiride and 6.26 minute of pioglitazone. Tailing and fronting observed
with the analyte peaks. The composition of mobile phase Buffer: Acetonitrile (80:20%v/v)of
pH 6 with flow rate of 1.3 ml/min and detection at 230nm of runtime of 30 min yielded peaks
at 2.56 min for Glimepiride and 4.27minute for pioglitazone, which showed fronting. The
At Buffer: Acetonitrile (60:40%v/v) of pH 6 with flow rate of 1.5 ml/min and detection at 230nm of runtime of 30 min, a perfect chromatogram was eluted.
Table 2: Optimized Chromatographic conditions of Pioglitazone and Glimepiride.
Parameters Method
Stationary phase (column) PHENOMENX LUNA C18 (150 X
4.6mm, 5 µ)
Mobile Phase Buffer: Acetonitrile (60:40%v/v)
pH 6 ± 0.02
Flow rate (ml/min) 1.5
Run time (minutes) 30.0
Column temperature (°C) Ambient
Volume of injection loop ( l) 20
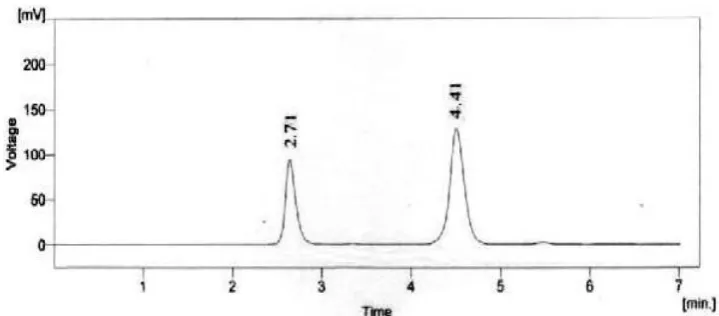
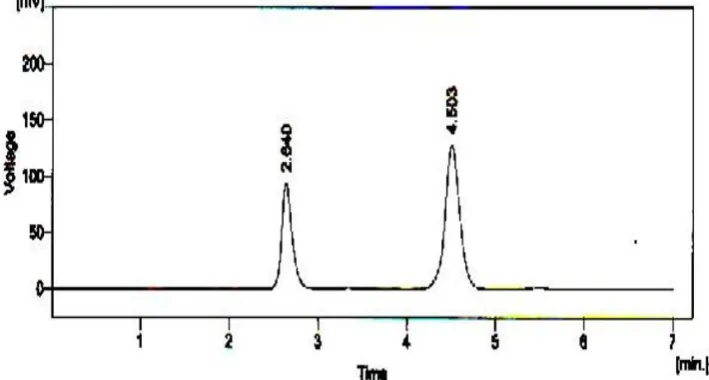
The typical chromatogram obtained from final HPLC conditions are depicted in Figure 3.
Figure 1: Typical chromatogram of Pioglitazone and Glimepiride by optimised method Method validation.
As per ICH guidelines, the method validation parameters checked were system suitability,
specificity, precision, accuracy, linearity, and robustness, limit of detection and limit of
quantification.
System Suitability
Standard solutions of Pioglitazone and Glimepiride were prepared as per procedure and were
injected six times into the HPLC system. The system suitability parameters were evaluated
from standard Chromatograms obtained by calculating the % RSD of retention times, tailing
factor, theoretical plates and peak areas from six replicate injections.
1. The % RSD for the retention times of principal peak from 6 replicate injections of each
2. The number of theoretical plates (N) for the Pioglitazone and Glimepiride peaks should
be NLT 2000.
3. The Tailing factor (T) for the Pioglitazone and Glimepiride peaks should be NMT 2.0.
Assay
Where, AT = Peak Area of obtained with test preparation.
AS = Peak Area of obtained with standard preparation.
WS = Weight of working standard taken in mg
WT = Weight of sample taken in mg
DS = Dilution of Standard solution
DT = Dilution of sample solution
P = Percentage purity of working standard
Precision: The system precision of the test method was performed by injecting 6 replicate determination of test sample against a qualified reference standard and the % RSD was
calculated (% RSD should not be more than 2%).
Accuracy: The accuracy was carried out using samples prepared for assay. Accuracy studies were conducted using triplicate determination as per the test method by injecting the sample
thrice into HPLC system and the average peak area was calculated from which Percentage
recoveries were calculated. (% Recovery should be between 98.0 to 102.0%).
Linearity: The linearity of detector response was established by plotting a graph to concentration versus area of Pioglitazone and Glimepiride standard and determining the
correlation coefficient. A series of solution of Pioglitazone and Glimepiride standard solution
in the concentration ranging from about 240-350µg/ml of Pioglitazone and 32-50µg/ml of
Glimepiride respective levels of the target concentration were prepared and injected into the
HPLC system.(Correlation coefficient should be not less than 0.999.)
Limit of Detection (LOD) and Limit of Quantification (LOQ): LOD and LOQ for the were determined at signal to noise ratios of 3:1 and 10:1, respectively by injecting series of
Robustness
For the evaluation of robustness, in the concentration range 240-350µg/ml of Pioglitazone
and 32-50µg/ml of Glimepiride were injected thrice in to the system in all deliberately varied
conditions such as flow rate from 1.3ml/min to 1.7ml/min ( 0.2ml/min) and the variation in
wavelength from 228 to 232 ( 0.2ml/min) do not affect the method significantly.
Specificity
In case of simultaneous assay of Pioglitazone and Glimepiride, demonstration of Specificity
requires that the procedure is unaffected by the presence of impurities or excipients. For the
evaluation of specificity one blank and standard were injected to HPLC and checked for the
additional peaks in the chromatogram.
RESULTS AND DISC USSION
System suitability: The system suitability parameter tailing factor for the proposed HPLC method from the standard injection of Pioglitazone and Glimepiride are 1.122 and 1.273
respectively. Theoretical Plates obtained from the standard injection of Pioglitazone and
Glimepiride are 3888 and 2577 respectively. The resolution obtained with the proposed
method was 7.395. The results proved that the optimized HPLC method fulfils these
requirements within the U SP accepted limits.
Table 3: The summary of System Suitability for Pioglitazone and Glimepiride.
Parameter Pioglitazone
Glimepiride
Resolution 7.395
Tailing Factor 1.122 1.273
[image:7.595.95.502.478.741.2]Number of theoretical plate 3888 2577
Precision: The % R.S.D. of Pioglitazone and Glimepiride assay during the method precision was found to be 0.052948% and 0.089858% respectively, indicating excellent precision of
the method.
Table 4: Summary of results of Method Precision parameter for Pioglitazone and Glimepiride.
Injection Pioglitazone Glimepiride
Area Area
S.No. Inj-1 Inj-2 Avg. Inj-1 Inj-2 Avg.
MP-1 1243.459 1235.157 1239.308 644.166 653.352 648.759 MP-2 1247.629 1241.357 1244.493 650.229 657.245 653.737 MP-3 1245.456 1233.257 1239.356 648.241 656.984 652.612 MP-4 1239.452 1245.214 1242.333 646.321 654.325 650.323 MP-5 1238.258 1246.321 1242.289 644.256 654.021 649.138 MP-6 1244.245 1236.425 1240.335 653.254 648.221 650.737
MEAN 1241.352 650.884
SD 6.349054 9.807
% RSD 0.511162 0.5028
Table 5: Summary of results of Injection Precision parameter for Pioglitazone and Glimepiride.
S.No. Pioglitazone Glimepiride
SP-1 1237977 643296
SP-2 1243238 650187
SP-3 1244499 664745
SP-4 1242860 649951
SP-5 1243500 650067
SP-6 1239251 641870
Mean 1241887.5 650019.33
SD 2624.23 8105.49
% RSD 0.21 1.25
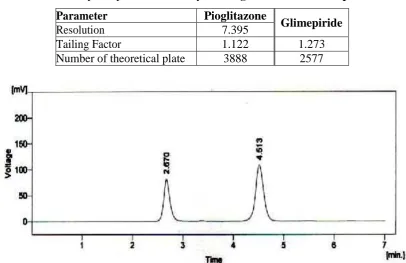
Accuracy: Percent recovery of Pioglitazone samples ranged from 98.6% to 101.3%, and the Percent recovery of Glimepiride samples ranged from 98.9% to 101.5% showing the good
Table 6: Summary of results of Accuracy parameter for Pioglitazone and Glimepiride Pioglitazone.
Recovery Standard Injections %
% RSD
Level Recovery
Inj-1 Inj-2 Inj-3 Average
80% 1029743 1029744 1029742 1029743 101.3 100% 1243605 1243606 1243607 1243606 99.8
1.35 120% 1474804 1474802 1474803 1474803 98.6
Glimepiride
80% 527151 527153 527152 527152 101.5
1.31 100% 646426 646427 646425 646426 100.5
[image:9.595.124.474.498.700.2]120% 763119 763118 763117 763118 98.9
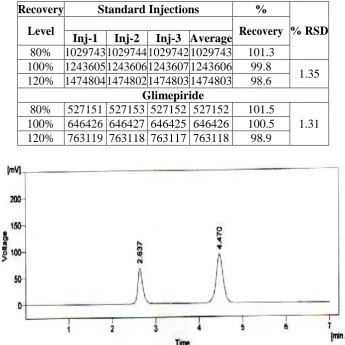
Figure 3: Chromatogram for recovery of 80%.
s
Figure 5: Chromatogram for recovery of 120%.
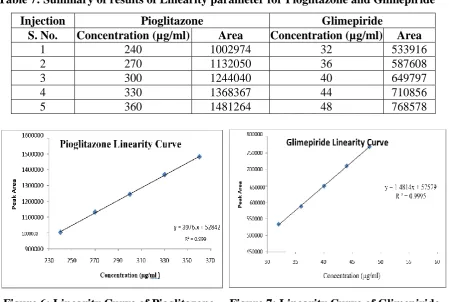
Linearity: The linearity of the calibration plot for the method was obtained over the calibration ranges tested, i.e., 240-350µg/ml for Pioglitazone and32 - 48 µg/ml for
Glimepiride three times, and the correlation coefficient obtained was 0.997 and 0.998 for
Pioglitazone and Glimepiride respectively, thus indicating excellent correlation between peak
[image:10.595.74.524.411.713.2]areas and concentrations of the analytes.
Table 7: Summary of results of Linearity parameter for Pioglitazone and Glimepiride
Injection Pioglitazone Glimepiride
S. No. Concentration (µg/ml) Area Concentration (µg/ml) Area
1 240 1002974 32 533916
2 270 1132050 36 587608
3 300 1244040 40 649797
4 330 1368367 44 710856
5 360 1481264 48 768578
Figure 8: Chromatogram for Linearity of Pioglitazone and Glimepiride of Injection-1 and 2.
Figure 9: Chromatogram for Linearity of Pioglitazone and Glimepiride of Injection-3 and 4.
[image:11.595.79.522.302.463.2] [image:11.595.121.476.535.725.2]Limit of Detection (LOD) and Limit of Quantification (LOQ)
The LOD of Pioglitazone and Glimepiride were found to be 7.5 µg/ml and 0.96µg/ml
respectively. The LOQ w as 22.74µg/ml and 2.93µg/ml for Pioglitazone and Glimepiride
respectively.
Table 8: LOD&LOQ for Pioglitazone and Glimepiride.
Parameter LOD LOQ
Pioglitazone 7.5 µg/ml 22.74 µg/ml Glimepiride 0.96 µg/ml 2.93 µg/ml
Figure 11: LOD Chromatogram (7.5&0.96µg/ml) Figure 12: LOQ Chromatogram (22.74&2.93µg/ml).
Robustness: In all the deliberately varied chromatographic conditions such as variations in flow rate and wavelength, the robustness of the method was evaluated. It can b e concluded
that the variation in flow rate and the variation in wavelength do not affect the method
significantly. Hence it indicates that the method is robust even by change in the flow rate and
change in the wavelength.
Tabl 9: Summary of results for Robustness parameters for Pioglitazone and Glimepiride. S.No Flow rates Pioglitazone Glimepiride
Rt Peak Area Rt Peak Area
1 1.3 5.57 1559.416 3.31 879.518
2 1.5 4.49 1474.803 2.63 763.115
3 1.7 3.74 998.801 2.21 533.256
S.No wave length Pioglitazone Glimepiride Rt Peak Area Rt Peak area
1 228 4.5 1106.866 2.66 574.869
2 230 4.49 1474.803 2.63 763.115
[image:12.595.76.517.182.418.2]Assay: The assay results for commercial tablets given in Table 10.
Table 10: Results of commercial formulation analysis. Label claim
(mg/Tab)
%Label claim estimated
(Mean±S.D)(n=6) %RSD
Pioglitazone 99.78±1.20 1.20
Glimepiride 100.1±1.28 1.28
SUMMARY
After several trials with various solvents, mobile phase system composed of phosphate
Buffer: Acetonitrile (40:60v/v) was chosen for the estimation of Pioglitazone and
Glimepiride by RP-HPLC. This mobile phase composition offered maximum resolution for
drugs at the detection wavelength of 230 nm.
Mobile phase with the flow rate of 1.3ml/min gave optimum separation with good resolution
between the peaks. A reverse phase PHENOMENX LUNA C18(250 X 4.6mm, 5 µ) column
was used as stationary phase.
From the results shown in precision Table 5: The % RSD was found that 0.511162 for Pioglitazone and 0.5028 for Glimepiride which is less than 2%; that indicates the proposed
method has good reproducibility. From the results shown in accuracy Table 7, it was found that the percentage recovery values were 99.8 for Pioglitazone and 100.5 for Glimepiride,
which indicates that the method was accurate and also reveals that the commonly used
excipients and additives present in the pharmaceutical formulations were not interfering in
the proposed method.
From the linearity Table no 8, it was found that the drug obeys linearity within the concentration range of 240- 360µg/ml for Pioglitazone and 32-48µg/ml for Glimepiride.
The system suitability parameters also reveal that the values (no of theoretical plates above
2000, tailing factor below 2) were within the specified limits for the proposed method.
The Robustness of the method was proved by varying the flow rate and wavelength from the
optimized chromatographic conditions and the tailing factors were found to be within the
The LOD of Pioglitazone and Glimepiride were found to be 7.5µg/ml and 0.96µg/ml
respectively.
The LOQ was 22.74µg/ml and 2.93µg/ml for Pioglitazone and Glimepiride respectively.
CONCLUSION
The new, simultaneous RP-HPLC method proved to be economical, simple, linear, precise,
accurate and robust. The developed method was capable maintaining good separation more
than that achieved with other available HPLC methods. The above method does not suffer
from any interference due to common excipients. Though the linearity range of this method is
slightly more as compared to the reported RP-HPLC method, the newly developed RP-HPLC
method leads to better resolution and peak symmetry. Hence the developed RP-HPLC
method for the simultaneous determination of Pioglitazone and Glimepiride can be used for
routine analysis of both these components in combined dosage form.
The system suitability parameter tailing factor for the proposed HPLC method from the
standard injection of Pioglitazone and Glimepiride are 1.122 and 1.273 respectively.
Theoretical Plates obtained from the standard injection of Pioglitazone and Glimepiride are
3888 and 2577 respectively. The resolution obtained with the proposed method was 7.395.
The results proved that the optimized HPLC method fulfils these requirements within the U
SP accepted limits.
REFERENCES
1. Basniwal, pawan, Srivastava and Prabhat. Spectrophotometric Estimation of Pioglitazone
Hydrochloride in Tablet Dosage Form, Asian Journal of pharmaceutics, 2008; 3: 15-20.
2. Chandanashveta, Kasture A. V. and Yeole P.G. Simultaneous spectrophotometric
determination of Pioglitazone hydrochloride and Glimepiride in tablets, Indian journal of
pharmaceutical sciences, 2005; 67: 627-629.
3. Hohyunkim, Kyu Young chang, Chang Hun park, Moon Sun Jung-Ae Lee, HeeJoo Lee
and KyungRyul Lee. Determination of Glimepride in human plasma by LC-MS-MS and
comparison of sample preparation methods for Glimepiride, Chromatographia B, 2004; 60: 93-98.
4. http://drugbank.ca/DB2100056.
5. International Conference on Harmonization, (ICH) Q2A. 1995. Text on Validation of
6. International Conference on Harmonization, (ICH) Q2B. 1996. Validation of Analytical
Procedures: Methodology.
7. Khan, Mubeen Ahmad, Sinha and Sukumar. LC determination of Glimepiride and its
related impurities. Journal of pharmaceutical and biomedical analysis. 2005; 39(5):
928-43.
8. Kolte B.L., Raut B.B., Deo A.A., Bagool M.A and Shinde D.B. Simultaneous high
performance liquid Chromatographic determination of Pioglitazone and Metformin in
pharmaceutical dosage form, Journal of chromatographic sciences, 2004; 42: 27-31.
9. Madhira B Shankarand vaibhavD. Estimation of Pioglitazone Hydrochloride and
Metformin Hydrochloride in tablets By Derivative Spectrophotometry and Liquid
Chromatographic Methods, Journal of AOAC International; 2005; 4: 36-45.
10.Tripathi K.D: Essentials of Medical pharmacology, 5th Ed, Medical Publishers(P) Ltd,
New Delhi, 2003; 169-177.
11.Weetman SC. Martindale the Complete Reference, 35th Ed.Pharmaceutical Press, 2006;
441: 456.
12.Xeu, X-j(yj). Turner Quantitative Determination of Pioglitazonein Human serum by
Direct-injection high performance liquid chromatography mass spectrometry and its
application to a bioequivalence study, Journal of Chromatography B, 2003; 795: 215.
13.Yannis Dotsikas, Constantinoskousoulos, Georgia tsatsou, and yannis Lloukas.
Development of rapid method for the determination of glimipride in human plasma using
liquid; liquid extraction based on 96-well format micro-tubes and liquid
chromatography/tandem mass spectrometry, Journal of Rapid communication in mass
spectrometry, 2005; 19(14): 2055-2061.
14.Yao. Jing and shiYa-Qin. Development of a RP-HPLC method for screening potentially