Effect of Zinc Content on Microstructural Evolution
and Electrification-Fusion-Induced Failure Mechanism
of Sn-
x
Zn Alloys
Gong-An Lan
1, Chung-Wei Yang
2, Truan-Sheng Lui
1;*and Li-Hui Chen
11Department of Materials Science and Engineering, National Cheng Kung University,
No. 1 University Road, Tainan 701, Taiwan, R. O. China
2Department of Materials Science and Engineering, National Formosa University,
No. 64 Wunhua Road, Huwei, Yunlin 632, Taiwan, R. O. China
Microstructural features of Sn-xZn alloys with varying Zn content of 7, 9, 20, 30 mass% on the electrification-fusion phenomenon were investigated in this study. Experimental results showed that the critical fusion current density (CFCD) of Sn-xZn alloys increased with increasing Zn content. The enrichment of Zn-rich phase was the main factor in the improvement of electrical conductivity and the required electrical current density for triggering microstructural evolution for the hypereutectic Sn-30Zn alloy was much higher than the hypoeutectic Sn-7Zn alloy. There is an obvious difference in the increase rate of CFCD from the hypoeutectic composition (Sn-7Zn) to the eutectic composition (Sn-9Zn) due to the microstructural evolution with increasing Zn content. Through thein-situexamination of microstructural evolution during electrification-fusion tests, the initial site of electrification-electrification-fusion-induced failure was significantly emerged from the Sn/Zn eutectic phase for both the hypoeutectic composition (Sn-7Zn) and the hypereutectic composition (Sn-30Zn). The fusion behavior of Sn-7Zn was dominated by double massive fusion regions on Sn/Zn eutectic phase and-Sn phase, whereas the fusion behavior of Sn-30Zn was dominated by massive fusion regions only on Sn/Zn eutectic phase. [doi:10.2320/matertrans.M2010259]
(Received August 4, 2010; Accepted October 8, 2010; Published December 25, 2010)
Keywords: lead free solder, electrification-fusion effect, critical fusion current density, in-situ examination, microstructural evolution
1. Introduction
Since the toxicity of Pb may result in detrimental effects on the environment and human health, searching for a proper solder is important in the electronics industry under the Pb-free regulations. Various Pb-Pb-free solders have been proposed, among which the Sn-Zn-series alloys have several benefits such as low eutectic point (for the composition of Sn-9Zn, 471.5 K) close to the conventional Sn-37Pb alloy (456 K), excellent mechanical properties and low cost compared with other Pb-free solder materials.1,2) Related studies indicated that the Sn-6.5Zn alloy displays the optimal wetting force among hypoeutectic Sn-xZn alloys (x¼2:5 to 9 mass%) during the competition between overheating and wetting.3) High-strength aluminum joints were implemented by ultra-sonic soldering under liquidus temperature of Sn-xZn hyper-eutectic alloys (x¼23, 40 and 82 mass%).4) Furthermore, the needle-like Zn-rich phase decomposes into a particle-like morphology for the Sn-9Zn-1Ag alloy resulted from its apparent electro-migration (EM) effect under the direct current (DC) electrical testing.5) Previous reports have indicated that the evolution of microstructural features and mechanical properties of solder alloys were significantly related to the EM effect by applying the DC power.6–8) In general, solders stressed with current density above
108Am2 for several hours will trigger the EM effect,9,10) and so will solders with a lower level of current density.5,11,12) However, the EM effect can be ignored in the case of alternating current (AC) power.13)
With the microminiaturization of electronic devices, e.g., in household appliances, the solder joints inevitably suffer
higher electrical current density. Failures of solder joints during electrification and fusion can be attributed to the induced high joule heat with the applying electrical currents. The relationship between microstructural variation of solder joints and the applied electrical current density plays an important role in the electrification-fusion phenomenon for evaluating the failure behavior of solder joints. The previous study indicated that Sn-xZn alloys (x¼7, 9 and 14 mass%, with different microstructures) show a long-term reliable and exhibit a right-shift wear-out failure model when subjected to the Weibull statistics in electrification-fusion reliability experiments.14) Given the dearth of researches concerning hypereutectic Sn-Zn binary alloys especially vis-a`-vis the electrification-fusion phenomenon, the aim of the present study is to clarify the relationship between critical fusion current density (CFCD) and microstructural evolution by means of the electrification-fusion on a series of Sn-xZn alloys (x¼0, 7, 9, 20 and 30 mass%) under an AC power supply. More importantly, this study also aims to find out the origin of the melting-to-solidifying phenomenon in order to comprehend the root cause of the fusion-failure mechanism. Therefore, in-situ examination of microstructural evolution is carried out by AC partial-fusion-electrification without phase migration resulting from the EM effect for various microstructures of selected Sn-Zn solders.
2. Experimental Procedures
Hypoeutectic, eutectic and hypereutectic Sn-Zn alloys with Zn content of 7, 9, 20 and 30 mass% were prepared by melting pure Sn (99.95 mass%) and pure Zn (99.95 mass%) in a high frequency induction furnace. The chemical composition of the test materials is listed in Table 1, where *Corresponding author, E-mail: [email protected]
the specimens (Sn-7Zn, Sn-9Zn, Sn-20Zn and Sn-30Zn) are designated according to their Zn content. The alloy ingots were remelted to 100 K higher than their individual liquidus temperatures according to a Sn-Zn phase diagram15)and then cast into a 473 K preheated Y-shaped graphite mold with a constant thickness of 2.4 mm.
The microstructures of 7Zn, 9Zn, 20Zn and Sn-30Zn specimens were examined with an optical microscope (OM) and a scanning electron microscope (SEM). The electrical conductivity (% IACS) of the used pure Sn, pure Zn and various Sn-xZn alloys was measured by an electrical conductivity analyzer (type AutoSigma). The % IACS is a physical value which represents the percentage ratio of the conductivity of the materials used to the international annealing copper standard. In order to measure the melting point of these Sn-xZn alloys and understand how the melting behavior corresponds to the measured critical fusion current density (CFCD), differential scanning calorimeter (DSC) measurements were performed at a constant heating rate of 3 K/min to ascertain the melting latent heat of various
Sn-xZn alloys.
Rectangular specimens with a gauge length of 20 mm (l)5 mm (w)0.8 mm (t) were prepared. The surface was carefully ground and polished by sandpapers and 0.3mm
Al2O3 suspension. These specimens were then used to
collect electrification-fusion testing data. An AC power supply of 24 V was operated by applying increasing 0.1 V/s to examine the CFCD by electrifying the specimens until they fused completely. In addition, the partial melting-to-solidifying regions were in-situ observed at the middle part of a specimen (Fig. 1(a)) while applying the AC to approximately 90% and 75% CFCD values at which the Sn-7Zn and Sn-30Zn specimens have not being fused. These
two values were defined based on the emergence of initial melting phenomenon for Sn-7Zn and Sn-30Zn. Meanwhile, since this study involves hypoeutectic and hypereutectic microstructures of Sn-Zn alloy, Sn-7Zn and Sn-30Zn were assigned forin-situexamination of microstructural evolution and the results are discussed in detail in Section 3.2. The measured cooling rates for preparing Sn-7Zn and Sn-30Zn specimens are 0.13 K/s and 0.08 K/s respectively, those are estimated by their cooling curves. Schematic illustra-tions of the specimens dimension and the setting for the electrification-fusion test are shown in Fig. 1. For the representative accuracy of CFCD, four specimens of each Sn-xZn alloy system were used for electrification-fusion measurements.
3. Results
3.1 Microstructural feature and electrification-fusion-induced failure of Sn-xZn alloys
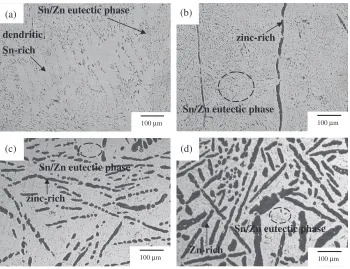
Figure 2(a) represents a typical microstructure of hypo-eutectic composition for the Sn-7Zn alloy composed of a uniformly-dispersed dendritic Sn-rich phase (the so-called the -Sn phase) and particle-like Sn/Zn eutectic phase. Figures 2(b) to 2(d) shows the microstructures of eutectic and hypereutectic composition for 9Zn, 20Zn and Sn-30Zn alloys. They are composed of needle-like Zn-rich phase and Sn/Zn eutectic phase. The area fraction of Zn-rich phase was quantitatively calculated to be about 10.3%, 22.6% and 43.6% for Sn-9Zn, Sn-20Zn and Sn-30Zn, respectively. Since Sn-xZn alloys have distinct microstructural features with varying the different Zn content, the individual primary phase (such as dendritic Sn-rich and Zn-rich phase) and the distributed amount of Sn/Zn eutectic component result in different electrical effects on the electrification-fusion phe-nomenon. However, Zn-rich phase will play an important role in enduring the electrical stressing because of its higher conductivity.
Figure 3(a) shows the relationship between CFCD and electrical conductivity (% IACS) for various Sn-xZn alloys (The measured % IACS of pure Zn is about 29.1%). This phenomenon is consistent with the result that Zn has a higher endurance in joule heat because of its higher conductivity than pure Sn. Figure 3(b) shows that the CFCD increases with increasing Zn content. The average value, which is marked by the short bar in Fig. 3(b), of pure Sn, Sn-7Zn, Sn-9Zn, Sn-20Zn and Sn-30Zn alloys are 1399, 1619, 1654, 1847 and 2005 (104) Am2, respectively.
[image:2.595.48.289.85.149.2]It can be seen that the CFCD not only significantly increased with increasing Zn content but also increased with the conductivity of the Sn-xZn alloys. The melting temperatures and the melting latent heat of the Sn-xZn alloys represented in heat flow curves obtained by DSC analysis are shown in Fig. 4. We can see that the melting point and melting latent heat of the Sn-xZn alloys (data obtained from the endothermic peak during heating) varies with different Zn content. As a result, it can be inferred that the metallurgical effect of Zn content on the electrification-fusion phenom-enon for Sn-xZn alloys is quite relevant to the micro-structural features, especially to the distribution of Zn-rich phase.
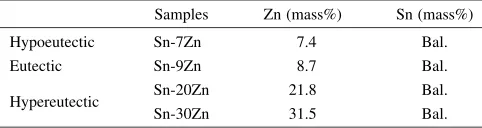
Table 1 Chemical compositions of Sn-xZn alloys (mass%).
Samples Zn (mass%) Sn (mass%) Hypoeutectic Sn-7Zn 7.4 Bal.
Eutectic Sn-9Zn 8.7 Bal.
Hypereutectic Sn-20Zn 21.8 Bal. Sn-30Zn 31.5 Bal.
fusion-affected zone
0.8 20
5 13
64
(a)
copper electrode specimen AC Power Supply
(b)
[image:2.595.59.276.93.343.2]3.2 Microstructure observance of fusion (partial-fusion) for Sn-xZn alloys
In order to effectively observe a location where melting phenomenon is underway, it is desirable to maintain as close an interval between different phases as possible. Therefore, the hypoeutectic Sn-7Zn alloy possessing dendritic-Sn and substantial Sn/Zn eutectic phase was selected to accurately examine which phase would undergo melting-to-solidifying first. Likewise, the hypereutectic Sn-30Zn alloy has sufficient Sn/Zn eutectic phase and large amount of primary Zn phases. Hence, Sn-7Zn and Sn-30Zn were selected as the represen-tatives of hypoeutectic and hypereutectic compositions for examiningin-situmicrostructural evolution.
Figure 5 and 6 show the microstructural evolution for Sn-7Zn (under exerting 90% of CFCD, 1457 (104) Am2) and Sn-30Zn (under exerting 75% of CFCD, 1504 (104) Am2), respectively. In this investigation, for the purpose to suppress the effect of migration, AC current was applied to the Sn-xZn alloys. During electrification-fusion experiment, joule heat generated from electricity will manifest mainly in the middle region (called the fusion-affected zone, as shown in Fig. 1(a)), this means that the middle region suffers the most severe joule-heating and will even bring about fusing if CFCD is reached. The left/right side in the vicinity of the middle region is defined as the joule heat-affected zone, which is a transitional area between the original solidified phase and fusion-affected phase and can be regarded as the initial location of fusion phenomenon, however this partial melting phenomenon emerges from roughly the middle region of fusion-affected zone under electrifying, undoubtedly, the eutectic Sn/Zn phase actually are located at this region, consequently would initially be remelted at the fusion-affected zone, the detail will be discussed later.
.
.
(a)
(b)
Fig. 3 Effect of Zn content on the critical fusion current density (CFCD) of Sn-xZn alloys: (a) the relationship between CFCD and conductivity and (b) the variation of critical fusion current density.
(b)
100 µm
zinc-rich
Sn/Zn eutectic phase
(a)
100 µm
dendritic Sn-rich
Sn/Zn eutectic phase
Sn/Zn eutectic phase
Zn-rich
100 µm (d)
Sn/Zn eutectic phase
zinc-rich
(c)
100 µm
[image:3.595.124.474.71.340.2] [image:3.595.67.271.423.744.2]4. Discussion
Referring to the variation of CFCD values with increasing Zn content as shown in Fig. 3, we can see that an obvious transition of slope is occurred at a composition close to the Sn-7Zn. The reason of obvious slope variation of CFCD can be clarified in detail through the comparisons of Fig. 5 and Fig. 6 in the following discussion. In order to simulate the electrification-fusion behavior, DSC measurements are per-formed to ascertain the individual melting point and melting latent heat for Sn-7Zn, Sn-9Zn, Sn-20Zn and Sn-30Zn alloys, as shown in Fig. 4. Undoubtedly, eutectic composition Sn-9Zn has more melting latent heat (also representing the endothermic peak or Sn/Zn eutectic phase) than the other compositions herein. But the melting point and melting latent heat are not linearly correlated with the variation of CFCD. Obviously, there must be other factors for how CFCD varies with Zn content. Furthermore, the melting latent heat decreases from eutectic composition (Sn-9Zn) to hyper-eutectic compositions (as shown in Fig. 4(b) to 4(d)). This corresponds to the increasing precipitated primary Zn-rich phase and decreasing Sn/Zn eutectic phase as shown in Fig. 2(b) to 2(d).
Figures 5(a) to (b) displays the microstructural changes of Sn-7Zn with increasing applied current density during the electrification-fusion experiment. Grit-like fusion parts dis-tributed all over the Sn/Zn eutectic phase and circle-like fusion regions are apparent on the dendritic -Sn phase. Particularly massive fusion regions appear on the dendritic -Sn phase and -Sn/Zn eutectic phase. Thus, we can infer that the microstructural feature, as shown in Fig. 5(b), will be occurred close to the fusion-affected zone. When the speci-men suffered electrification, the current flow would
prefer-entially pass through the Sn/Zn eutectic phase due to its higher conductivity than the dendritic-Sn.14) Because the melting temperature of Sn/Zn eutectic phase (471.5 K) is lower than that of-Sn phase (close to 505 K), the melting-to-solidifying phenomenon originates from the Sn/Zn eutec-tic phase, and then the Sn/Zn euteceutec-tic phase is filled with grit-like fusion parts. Simultaneously, some current would flow toward dendritic-Sn phase. Because the conductivity of-Sn phase is lower than that of Sn/Zn eutectic phase, few circle-like melting-to-solidifying regions appear on the-Sn phase. Microstructural evolution does not occur until the electrical current density reaches about 90% of CFCD in Sn-7Zn (Fig. 5(b)). Conspicuous massive melting-to-solidifying regions are situated on the -Sn phase and Sn/Zn eutectic phase, while the dendritic -Sn phase suffers more fusion than the Sn/Zn eutectic phase. This can probably be ascribed to the lower conductivity of the-Sn phase bringing about larger joule heat than the Sn/Zn eutectic phase. Notably in Fig. 5(c), the circle-like fusion regions on the -Sn phase materialize near the border between the Sn/Zn eutectic phase and-Sn phase, and they display a substantially finer Sn/Zn eutectic phase.
With applying SEM/EDS spot-check results (an average of three spots), as listed in Table 2, the concentration of Zn is about 1.8 at% and 19 at% for unmelted-Sn and circle-like fusion regions, respectively. And the results for the oxygen concentration are about 0 at% and 5.9 at%. We can assume that local sites of -Sn undergo phase melting, rapid solidification and Sn-Zn dissolution while ceasing electrifi-cation. Moreover, the original concentration of Zn is 5.9 at%, but the massive fusion region on the Sn/Zn eutectic phase is 22.7 at%. On the other hand, the results for the concentration of oxygen are about 0 at% before electrification test, and
(a) (b)
(c) (d)
[image:4.595.129.472.74.329.2]8.0 at% (Table 2) for partial melting region. The increase of oxygen concentration can be resulted from the oxidation of these fusion regions for both phases (-Sn and Sn/Zn eutectic phase). Consequently, all of the melting-to-solidifying regions on the Sn/Zn eutectic phase in the Sn-7Zn contribute to an increase in the concentration of Zn, it is suitable to suggest that the Zn atoms diffuse into the matrix in the
process of melting and quickly solidify because of the concentration difference between the Zn-rich phase and Sn/Zn eutectic phase, and a supersaturated phases could be acquired.
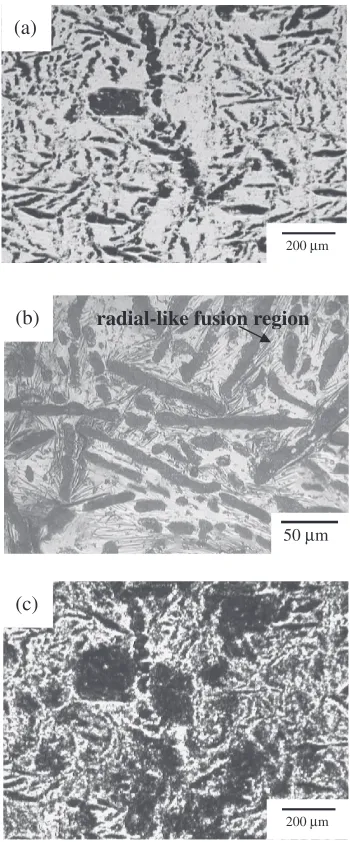
For hypereutectic specimens, Fig. 6(a) shows the micro-structure at the middle part of the as-cast Sn-30Zn specimen. The microstructural evolution does not occur until the electrical current reaches about 75% of CFCD for the Sn-30Zn (as shown in Fig. 6(b) and 6(c)). The morphology of heat-affected zone, as shown in Fig. 6(b), at the left/right side in the vicinity of fusion-affected zone can be regarded as the initial fusion location which displays considerable radial-like features next to Zn-rich phases as indicated in Fig. 6(b). According to thein-situexamination of Fig. 6(a), massive fusion regions can be found on the Sn/Zn eutectic phase while Zn-rich phases are almost intact at 75% of CFCD for Sn-30Zn, as shown in Fig. 6(c). Considering the micro-structural changes from Fig. 6(a) to 6(c) during the elec-trification-fusion experiment, due to the higher conductivity
(b)
100 µm
massive fusion region
(c)
circle-like fusion region
50 µm
(a)
100 µm
Fig. 5 Microstructural evolution of Sn-7Zn solders: (a) as-cast, (b) under 90% of CFCD forin-situexamination of (a). (c) SEM image showing a higher magnification of rectangle for the figure (b).
200 µm (a)
200 µm (c)
radial-like fusion region
(b)
50 µm
[image:5.595.80.257.68.501.2]Fig. 6 Microstructural evolution of Sn-30Zn solders: (a) as-cast, (b) and (c) show the heat-affected zone andin-situexamination of figure (a) under 75% of CFCD.
Table 2 Elemental atomic percentage of Sn-xZn alloys obtained by EDS spot checks on respective phases.
Hypoeutectic Hypereutectic
Samples Sn-7Zn Sn-30Zn
[image:5.595.339.514.71.492.2] [image:5.595.46.291.587.675.2]and melting point of Zn-rich phase than those of Sn/Zn eutectic phase,14)the applying current flow would preferen-tially pass through the Zn-rich phase, and then quickly transfer into the Sn/Zn eutectic phase while electrifying the specimen. Then the joule heat generated from electricity will first raise the temperature to reach the melting temperature of Sn/Zn eutectic phase. This process would leave behind radial streaks caused by fusion in the heat-affected zone such as the initial fusion region in Fig. 6(b). In Fig. 6(c), conspicuous massive melting-to-solidifying regions are situated only on the Sn/Zn eutectic phase, while the Sn/Zn phase suffers more fusion than the Zn-rich phase. This can probably be ascribed to the lower conductivity of the Sn/ Zn phase bringing about larger joule heat than the Zn-rich phase.
In addition, through the spot-check of SEM/EDS analysis (an average of three spots), the original concentration of Zn is about 9.8 at%, but the massive fusion region on Sn/Zn eutectic phase is 18 at%. On the other hand, the results for the concentration of oxygen are about 12.3 at% before electrifi-cation test, and 20 at% (Table 2) for partial melting region. Likewise, the partial fusion mechanism for all of the melting-to-solidifying regions on the Sn/Zn eutectic phase in the Sn-30Zn resembles that for those on the Sn/Zn eutectic phase in Sn-7Zn. Thereafter in Fig. 6(c), massive fusion regions would extend over the whole Sn/Zn eutectic phase. As mentioned above, the Zn-rich phases have a higher con-ductivity than Sn/Zn eutectic phase and are considered hindrances to current or joule heat spreading, they will hinder massive fusion regions on the Sn/Zn eutectic phase from extending and connecting to one another and finally fusing. Consequently, Sn-30Zn needs a substantially larger amount of current density to fuse completely compared with the hypoeutectic composition of the Sn-Zn alloy.
Judging from the above-mentioned in Figs. 5 and 6 with Fig. 3(a) and 3(b), on the one hand, the CFCD and conductivity of pure Sn are 1399 (104) Am2and 14.5%
IACS, respectively. It is a persuasive standpoint that the hypoeutectic composition of the Sn-Zn alloy possesses considerably more -Sn phase and more Sn/Zn eutectic phase (representing the endothermic peak during heating) than the hypereutectic composition of the Sn-Zn alloy in Fig. 4, and the most dominant fusion indication (massive fusion region) may originate from the -Sn phase together with fusion regions on the Sn/Zn eutectic phase and easily or quickly cause resultant fusing. On the other hand, the CFCD of eutectic and hypereutectic composition of Sn-xZn alloys (x¼9;20;30mass%) are relatively higher than that of Sn-7Zn and pure Sn. Compared with the hypoeutectic compo-sition of Sn-Zn alloy, the hypereutectic compocompo-sition of Sn-Zn alloys abound with Zn-rich phases but have less Sn/Zn eutectic phase. Even though the temperature has reached or surpassed the melting temperature of Sn/Zn eutectic phase, the Zn-rich phases provide effective hindrances for the extension of massive fusion regions on the Sn/Zn eutectic phase. Thus, in order to totally fuse the hypereutectic composition of Sn-Zn alloys, larger CFCD is needed.
All in all, the most dominant fusion-preferred site for hypoeutectic composition of Sn-Zn alloy includes double massive fusion regions mainly on the-Sn phase and on the
Sn/Zn eutectic phase; whereas the most dominant fusion-preferred site is only on eutectic phase for eutectic and hypereutectic compositions of Sn-Zn alloy. In consequence, there is an obvious slope variation of CFCD at Sn-7Zn. Noticeably, the current density required for triggering microstructural evolution of Sn-7Zn and Sn-30Zn are 1457 (104) Am2 and 1504 (104) Am2, both of these
values are larger than the CFCD of pure Sn (1399 (104) Am2); namely, Sn-rich phase is probably the
major factor in causing the initial microstructural evolution in Sn-Zn alloys during electrification.
To conclude, an in-situ examination of microstructural evolution can actually reflect the underlying characteristics of the respective phases and provide a better understanding of how respective phases’ layout and physical properties finally affect critical fusion current density over the course of electrification. A combination ofin-situexamination and consideration of microstructural features will be helpful for better prediction of electrification-fusion-induced failure behavior of Sn-Zn alloys and other Pb-free solder systems.
5. Conclusions
The effect of Zn content on the microstructural evolution and fusion-failure mechanism was characterized. The results can be summarized as follows:
(1) The electrical conductivity of Sn-xZn alloys increases with increasing the Zn-rich phase content. The critical fusion current density has a tendency to increase due to Zn phase which has higher conductivity.
(2) There is an obvious slope variation of critical fusion current density between the hypoeutectic (Sn-7Zn) and eutectic (Sn-9Zn) composition because double massive fusion regions on both-Sn phase and Sn/Zn eutectic phase dominate the fusion behavior of hypoeutectic alloys. Massive fusion regions solely on Sn/Zn eutectic phase govern the fusion behavior of eutectic and hypereutectic alloys.
(3) The applying current density required for triggering the fusion-induced microstructural evolution of Sn-7Zn and Sn-30Zn is at least equal to or larger than the CFCD of pure Sn.
(4) An in-situ examination of microstructural evolution can clearly account for the complete fusion process and correlate the electrification-fusion-induced failure mechanism to the metallurgical microstructure of
Sn-xZn alloys.
Acknowledgement
This study was financially supported by the National Science Council of Taiwan for which we are grateful (Contract No. NSC 98-2221-E-006-064-MY2).
REFERENCES
1) W. Yang, R. W. Messler and Jr., L. E. Felton: J. Electron. Mater.23
(1994) 765–772.
3) X. Wei, H. Huang, L. Zhou, M. Zhang and X. Liu: Mater. Lett.61
(2007) 655–658.
4) T. Nagaoka, Y. Morisada, M. Fukusumi and T. Takemoto: J. Mater. Process. Technol.209(2009) 5054–5059.
5) F. Y. Hung, C. J. Wang, T. S. Lui and L. H. Chen: Mater. Trans.46
(2005) 1820–1824.
6) Y. H. Lin, Y. C. Hu, C. M. Tsai, C. R. Kao and K. N. Tu: Acta Mater.53
(2005) 2029–2035.
7) E. Castano, J. Maiz, P. Flinn and M. Madden: Appl. Phys. Lett.59
(1991) 129–131.
8) D. Yang, Y. C. Chan and K. N. Tu: Appl. Phys. Lett.93 (2008) 0419071–0419073.
9) B. Y. Wu, Y. C. Chan, H. W. Zhong and M. O. Alam: J. Mater. Sci.42
(2007) 7415–7422.
10) J. W. Nah, J. O. Suh and K. N. Tu: J. Appl. Phys.98(2005) 0137151– 0137156.
11) J. S. Zhang, Y. C. Chan, Y. P. Wu, H. J. Xi and F. S. Wu: J. Alloys Compd.458(2008) 492–499.
12) B. Y. Wu and Y. C. Chan: J. Alloy. Compd.392(2005) 237–246. 13) W. H. Wu, S. P. Peng, C. S. Lin and C. E. Ho: J. Electron. Mater.38
(2009) 2184–2193.
14) G. A. Lan, C. W. Yang, T. S. Lui and L. H. Chen: J. Alloy. Compd.475
(2009) 294–299.