UPTEC IT 08 010
Examensarbete 30 hp
Juni 2008
Correlation and Graphical Presentation
of Event Data from a Real-Time
System
Tobias Hedlund
Xingya Zhou
Teknisk- naturvetenskaplig fakultet UTH-enheten Besöksadress: Ångströmlaboratoriet Lägerhyddsvägen 1 Hus 4, Plan 0 Postadress: Box 536 751 21 Uppsala Telefon: 018 – 471 30 03 Telefax: 018 – 471 30 00 Hemsida: http://www.teknat.uu.se/student
Abstract
Correlation and Graphical Presentation of Event Data
from a Real-Time System
Tobias Hedlund and Xingya Zhou
Event data from different parts of a system might be found recorded in event logs. Often the individual logs only show a small part of the system, but by correlating different sources into a consistent context it will be possible to gain further information and a wider view. This would facilitate in finding source of errors or certain behaviors within the system.
This thesis will present the correlation possibilities between event data from different layers of the Ericsson Connectivity Packet Platform (CPP). This was done first by developing and using a test base application for the OSE operating system through which the event data can be recorded for the same test cases. The log files containing the event data have been studied and results will be presented regarding format, structure and content. For reading and storing the event data, suggestions of
interpreters and data models are also provided. Finally a prototype application will be presented, which will provide the defined interpreters, data models and a graphical user interface to represent the event data and event data correlations. The programming was conducted using Java and the application is implemented as an Eclipse Plug-in. With the help of the application the user will get a better overview and a more intuitive way of working with the event data.
Keywords: logs, log file analysis, log file structure, event data, data modelling, event data representation, event date correlation, event data profiling, graphical user interface, CPP
Tryckt av: Reprocentralen ITC Sponsor: Ericsson AB
ISSN: 1401-5749, UPTEC IT 08 010 Examinator: Anders Jansson Ämnesgranskare: Kjell Orsborn Handledare: Daniel Flemström
i
Preface
This is a Master Thesis conducted by Tobias Hedlund at the Department of Information Technology of Uppsala University, and by Xingya Zhou at the Information and Communication Technology Department of the Royal Institute of Technology. The thesis work has been carried out at a lab in Mälardalen University for Ericsson AB. Other people involved in this project include:
Alf Larsson, Project Manager for this project at Ericsson
Axel Jantsch, Examiner and Supervisor at the Royal Institute of Technology Anders Jansson, Examiner at Uppsala University
Kjell Orsborn, Supervisor at Uppsala University
Daniel Flemström, Technical Supervisor at the Ericsson Lab
During this project Xingya Zhou’s work effort has been focused on areas concerning OSE and CPP, such as the programming of our test base application and collecting log files; while Tobias Hedlund has been working with areas close to the end user, such as the graphical user interface and visualizations. Work that was conducted collaborative includes the research part for background theory, related work, log file analysis, data model analysis and graphical representation analysis. During the event data analysis and graphical representation analysis parts, we divided the work on the different log file types. Xingya Zhou was responsible for the Execution Address Profiler and TSL log file types, and also TSL related elements in the Trace and Error log file type, while Tobias Hedlund worked with the Kernel Trace and Trace and Error Log files; the analysis parts concerning the CPU Load log file type was conducted by both of us. Even though many of the parts were divided between us the work was still conducted in a highly collaborative manner. Details about each of our contributions can be seen in Appendix A at the end of the report.
The terminology and abbreviations used throughout this thesis report is explained in the Terminology chapter.
iii
Acknowledgements
We want to thank all the people that were involved in this project. Special thanks goes to Alf, our project manager at Ericsson AB in Älvsjö, for sharing his valuable time, providing us with necessary tools and pushing the staff at Ericsson to helping out with various necessities of the project. Daniel Flemström should also have special thanks for providing us with contacts and pointing us at the right directions.
People that was not directly involved in the project but still deserves thanks are: Mikael Krekola that assisted Daniel Flemström in helping us with the CPP related issues at the Ericsson lab; Ravi Kumar Akkisetty for implementing the Rose Real Time part of the Test Base Application and for being very helpful if we ever had any questions about Rose Real Time and the TSL log file; and finally Magnus Larsson for giving us an informative seminar in the Rose Real Time background theory for this project.
v
Table of Contents
1 Introduction ... 1
1.1 Problem Overview ... 1
1.2 Purpose and Criteria ... 1
1.3 Delimitation ... 1
1.4 Method Description ... 1
1.5 Contributions ... 2
2 Background... 3
2.1 Embedded and Real-Time Systems ... 3
2.1.1 OSE Real-Time Operating System ... 3
2.2 Event Data and Event Data Correlation ... 3
2.2.1 Event Data ... 3
2.2.2 Event Data Correlation ... 4
2.3 Connectivity Packet Platform ... 4
2.3.1 CPP Software Structure ... 5
2.3.2 CPP Hardware Structure ... 5
2.3.3 CPP Execution Platform ... 6
2.4 Tools Used To Collect Logs ... 6
2.4.1 Remote Debug Support ... 6
2.4.2 Trace & Error Package ... 7
2.4.3 Profiling ... 7
2.5 Rational Tools ... 8
2.5.1 Rational Rose Real Time ... 8
2.5.2 Rational ClearCase... 8
2.6 Eclipse and Eclipse Plug-ins ... 9
2.6.1 Eclipse Workbench ... 9
2.6.2 Standard Widget Toolkit ... 9
2.6.3 JFace ... 9
3 Related Work... 10
3.1 Existing Tools and Approaches for Correlation of Event Data ... 10
3.1.1 RuleCore CEP ... 10
3.1.2 Logsurfer ... 10
3.1.3 SEC ... 10
3.1.4 Event Log Analyzer ... 10
3.1.5 Eclipse TPTP Tracing and Profiling Tools ... 11
3.1.6 Conclusions... 11
3.2 Common Base Event ... 11
4 Event Data Analysis ... 12
4.1 The Assigned Set of Log Files... 12
4.1.1 The Trace and Error Log ... 13
4.1.2 The Kernel Trace Log ... 13
4.1.3 The CPU Load Log ... 13
4.1.4 The TSL Log ... 13
4.1.5 The Execution Address Profiler Log ... 14
4.2 Log Collection via Test Base Application ... 14
4.2.1 Test Base Application ... 14
4.2.2 Log Collection ... 16
4.3 Correlation Analysis ... 16
4.3.1 Common Event Data ... 17
4.3.2 Correlation Possibilities ... 17
4.3.3 Correlation Accuracy ... 24
4.4 Graphical Representation ... 25
4.4.1 Table Representation ... 25
4.4.2 Representing Log Information Summary ... 25
4.4.3 Time Chart Representation ... 26
vi
4.4.5 Statistical Representation ... 27
4.4.6 Detailed TSL Specific Representation... 27
5 Implementation of the Correlation Tool ... 32
5.1 Interpreters ... 32
5.2 Data Model ... 32
5.2.1 Specific vs. Generic Data Model ... 33
5.2.2 The Generic Data Model ... 33
5.2.3 The Specific Data Models ... 34
5.3 Graphical User Interface ... 35
5.3.1 Approach ... 35 5.3.2 User Analysis ... 36 5.3.3 Implemented Functionality ... 36 5.4 Software Architecture ... 43 5.4.1 Views ... 43 5.4.2 Actions ... 43 5.4.3 Dialogs ... 44 5.4.4 Editors ... 44 5.4.5 Engine ... 44 5.4.6 Parsers ... 44
6 Comparison with the TPTP Tracing and Profiling Project ... 45
6.1 Using the TPTP Tracing and Profiling Project ... 45
6.2 Advantages using the TPTP Tracing and Profiling Project ... 45
6.3 Advantages using the Correlation Tool ... 45
7 Future Work ... 46
7.1 Correlation Analysis ... 46
7.2 Implementation ... 46
7.2.1 Extension of the Correlation Tool ... 46
7.3 Log File Evaluation and Suggestions ... 48
7.3.1 Log File Structures ... 48
7.3.2 Log File Formats ... 49
7.3.3 Log File Content ... 50
8 Concluding Discussion ... 52
8.1 Summary of the Results ... 52
8.2 Complications ... 52
8.3 Alternative solutions ... 53
8.3.1 Pre-processing of Event Data ... 53
8.3.2 Data Model vs. Data Base ... 53
9 References ... 54
10Terminology ... 56
10.1 Abbreviations ... 56
10.2 Definitions ... 56
Appendix A: Individual Thesis Contributions ... 58
Appendix B: Data Models... 59
Appendix C: The Correlation Tool ... 62
vii
Index of Figures
Figure 1: CPP System Areas 5
Figure 2: Connect to a CPP node 5
Figure 3: Processor hierarchy in a CPP node 6
Figure 4: Trace with RDS and Host environment 7
Figure 5: The process that logs an event using Trace Support 7
Figure 6: Relation between log files and system 12
Figure 7: Test Base Application design, OSE to OSE communication 15
Figure 8: Test Base Application design, OSE to UML communication 16
Figure 9: Common event data between the log files 17
Figure 10: Common event data with the TSL log file 17
Figure 11: Load Module interactions 19
Figure 12: Process / Controller interactions 19
Figure 13: Actor interactions 19
Figure 14: Capsule states and transitions 20
Figure 15: TSL Event Type 4 example output 21
Figure 16: Trace and Error TRACE5 example output 21
Figure 17: TSL Log Event Type 1 example printout 22
Figure 18: T&E Log STATE CHANGE and REC SIG example printout 22
Figure 19: TSL Event Type 1 (transiton cost), example output 24
Figure 20: EAP log, transition example output 24
Figure 21: Table representation of Kernel Trace entries 25
Figure 22: Table representation of Kernel Trace processes 25
Figure 23: Time chart view representing events in relation to time 26
Figure 24: Node graph representing Kernel Trace signal propagation 27
Figure 25: Two different TSL log browser view structures 28
Figure 26: Example table view of Event Type 1 and 3 29
Figure 27: Example table view of Event Type 5, 6 and 7 29
Figure 28: Example table view of Event Type 10 and 11 29
Figure 29: Example table view of Event Type 4 29
Figure 30: TSL node graph of signal propagation tree 29
Figure 31: TSL event data represented on a time line with suggested filters 30
Figure 32: Event data correlation via time lines 31
Figure 33: Extending the application with a new log file type 33
Figure 34: The generic data model 34
Figure 35: The TSL specific data model 35
Figure 36: The Navigation View 37
Figure 37: The Table Editor showing the Kernel Trace event data entries 38 Figure 38: The Table Editor showing the Kernel Trace event data processes 38
Figure 39: The Time Chart Editor together with the Table Editor 39
Figure 40: The Time Chart Editor showing a line chart diagram 40
Figure 41: The Node Editor 41
Figure 42: Interactions between event data representations in the GUI 41
Figure 43: Various GUI functionalities 42
Figure 44: Software architecture of the Correlation Tool 43
Figure 45: Kernel Trace, Trace and Error and CPU Load data models 59
Figure 46: The Common Base Event class hierarchy 61
Figure 47: YAML log structure 76
Figure 48: Log file structure showing TSL Block 2, Event Type 1 76
viii
Index of Tables
Table 1: Trace and Error trace groups ... 13
Table 2: TSL Block 1 content ... 14
Table 3: TSL Block 2 content ... 14
Table 4: Log file criteria... 48
Table 5: Log file formats, advantages and disadvantages ... 49
Table 6: Individual thesis contributions ... 58
Table 7: Decision points, specific vs. generic data model ... 60
Table 8: Data that can be extracted from the KTR, T&E, CPU Load and EAP logs ... 71
Table 9: Data that can be extracted from the TSL Log ... 71
Chapter 1: Introduction
1
1
Introduction
1.1 Problem Overview
Ericsson AB frequently makes use of the Connectivity Packet Platform (CPP) System. This is an event driven complex real time system for packet switching where event data from different parts of the system is recorded into logs. These logs are often designed for individual purposes and they record only the required system information which is a small part of the overall system. To examine a wider scope of system information, log files with event data from different parts of the system could be studied. By also correlating the event data further information could be gained. Today correlation possibilities have not yet been analyzed and it is not apparent what further information could be gained by doing this. Further, the log files are studied in a static manner through command line printouts which can be a tedious job when analyzing and comparing the event data. They are also not consistent which implies that relationships between captured event data can be hard to find.
1.2 Purpose and Criteria
The purpose of this project is to correlate event data from different parts of the system and represent these in a consistent context with the help of a graphical user interface. Correlations between the event data would facilitate in finding source of errors or certain behaviors within the system; while the graphical user interface facilitates in getting a better overview of the system and a more intuitive way of working with the event data. The criterion’s given by Ericsson AB are that data model and interpreters are defined for the log files, and that the interface implementation is to be conducted as an Eclipse Plug-in.
1.3 Delimitation
We are aware of the wide spectrum of this thesis and instead of doing any deep studying in any specific parts we have focused on the entire process to give an overview and a proposal that Ericsson can use for a future implementation. The project will focus on the correlation analysis and graphical representation as the main results, while the graphical user interface will be used as proof of concept to earlier results and as a prototype application to demonstrate the user interactions with the event data and correlations.
This project will focus on retrospective event analysis only and analysis of system monitoring will not be considered. There is also no input of system specific processes or behaviours to this project, why the correlation analysis is conducted on an observer level. This means that event data attributes and relations will be analysed, but not the system specific behaviour or rules. The correlation analysis will be conducted on event data from the same board on the CPP node. Correlation of event data from different boards will follow the same concept in many cases but we will not do any analysis in this area.
Due to time restrictions of the thesis an infrastructure for storing configurations and results will not be provided.
1.4 Method Description
In the beginning of the project a crash course was provided, where we got insight in how the CPP system is built up and how the OSE system works. When we had general knowledge of the system the proceeding method was mainly a bottom-up approacha. We started from the low layer of analyzing the logs and what data that can be extracted and correlated. When the
a
Bottom-up parsing is a strategy for analyzing unknown data relationships that attempts to identify the most fundamental units first, and then to infer higher-order structures from them
Chapter 1: Introduction
2
event data was analyzed and extracted the data model was created for storing this information. Further analysis was conducted on how event data is best represented and how the data model should be structured and implemented. To be able to put the event data into the data model the logs first need to be interpreted and parsed. Different ways of doing this was considered and finally implemented. After these sections analysis of how the event data and correlations can be represented graphically was conducted followed by analysis and implementation of the application and graphical user interface. In latter parts of this project this implementation will be referred to as the Correlation Tool.
Concurrent with earlier mentioned steps a Test Base Application was created to better understand the relations between the log files and to be used as analysis ground when representing the information in the Correlation Tool.
For background and research part of the thesis some of the information was gathered from meetings at Ericsson AB, internal documentation, or from research articles and books. We have used sources that we consider to be reliable throughout the project and we have not made use of internet resources other than for concept definitions and product specific information.
1.5 Contributions
The main contributions of this thesis are the following:
• Analysis results of how the defined set of logs can be profiled and correlated
• Analysis results of how the event data can be represented graphically
• Suggestion of data model for the event data that is analyzed during this thesis
• A prototype plug-in for correlation of event data that demonstrates different ways of representing the event data correlation.
Chapter 2: Theoretical Background
3
2
Background
2.1 Embedded and Real-Time Systems
An embedded system is a special purpose computer that is built into a larger device [1]. Embedded systems often reside in machines that are expected to run continuously for years without errors and in some cases recover themselves if an error occurs. Many embedded systems also have real-time constraints that must be met, for reasons such as timing requirements, safety, usability and fault-tolerance [2].
A real-time system should be able to manage time-dependent applications. The validity of a real time embedded system is affected by two main issues: one is the results that it produces and the other is the time when the results are generated.
Today’s real-time embedded systems are becoming more and more complex, and more requirements are met such as scalability across multiple CPUs, multiple communicating in multi-core and distributed environments. A real-time operating system, which must be able to schedule tasks at or after certain specified time, is designed for supporting those complex real-time applications.
A real-time operating system (RTOS) has three types of main duties: resource management, time management, and inter process communication [1]. There are many RTOS available at the market that currently support complex real-time applications, such as OSE RTOS, Symbian OS, ThreadX (Express Logic's advanced RTOS) [3], LynxOS RTOS [4], etc.
In this project, OSE RTOS is used as the working environment. More information about this operating system follows in the next section.
2.1.1 OSE Real-Time Operating System
OSE is a powerful platform produced by Enea for the design of real-time embedded systems. It is deployed in approximately half of the worlds 3G mobile phones and base stations [5]. The main features of OSE platform are reliability, scalability and simplicity of direct message passing system [5].
Enea has been making great efforts to support reliable system deployment and maintenance. Currently, OSE provides several ways to ensure reliability such as multi-level facilities for error detection, built-in monitoring of critical tasks, fault tolerant system, etc [5].
Message communications between different processes plays a significant role in real-time embedded system designs. OSE uses a memory pool to allocate for message buffers and has a direct message-passing model which provides fast, asynchronous inter process communication. As a result, many program errors that may occur during inter process communications could be avoided.
2.2 Event Data and Event Data Correlation 2.2.1 Event Data
The word event is being used more and more frequently in many different areas of computer systems. In a very general sense, an event means an action or occurrence that could be detected by a program. For example, events can be user actions, such as a mouse clicking in a graphical user interface, a key pressing to the keyboard or system occurrence such as hardware of software failures.
Chapter 2: Theoretical Background
4
Events play a significant role in system designs and implementations. Many large systems are designed according to event-based architectures. Some complex applications such as real-time embedded systems or distributed systems are designed to respond to events, these systems are called event-driven systems [6]. In this kind of system, an event could be some message, specified signal, token, value or marker that can be identified by the ongoing processes.
Events are very useful when monitoring complex systems, such as telecommunication networks, air traffic and stock markets [7]. Some events are instantaneous, most occur over an interval of time [8]. In order to better understand the behavior of a system, much effort has been made to monitor and trace these events. When a system encounters an event, it could emit an event data (or event message) that describes the event [9]. These event data are stored to a local or remote event log. For example, when a disk of a server becomes full, the server could generate a timestamped “Disk full” message for appending to a local log file or for sending over the network as an SNMPa trap. In most cases event data are appended to event logs in real-time, so event logs are an excellent source of information for monitoring the system [9].
Event data are also essential to better understand the activities of complex systems and to analyze problems, particularly in the case of applications with little user interaction (such as server or network applications). However, in most cases, the logs are esoteric or too verbose and therefore hard to understand; they need to be subjected to log analysis and correlation in order to make sense of them.
2.2.2 Event Data Correlation
As a baseline, correlation is defined as the drawing of a causal, complementary, parallel or reciprocal relationship between different events based on specific criteria [10]. Generally, correlations could be interpreted as establishing or finding relationships between different entities. When analyzing and monitoring a complex system such as telecommunication networks, air traffic or stock markets, designers always generate some logs to help them get a better understanding of the system behaviours. Designers working in different areas of a system usually design and examine their own logs. These logs are sometimes not well organized, information might overlap and complement might exist among them. Thus the event data from different sources need to be correlated so that useless information can be filtered out, important information can be cross-referenced into a consistent context, and new information could be generated.
2.3 Connectivity Packet Platform
Ericsson Connectivity Packet Platform (CPP) [11] is a platform that is designed for accessing and transporting user traffics in mobile and fixed networks. It was first designed for Asynchronous Transfer Mode (ATM) and Time Division Multiplex (TDM) transport, but since then more and more support has been added such as multimedia services for the third generation of mobile telephony and Internet Protocol (IP) transport. The CPP platform is also very flexible and can be configured with different types of circuit boards according to different design requirements. Based on this platform, it is possible to develop different high availability applications such as ATM and IP based nodes, Radio Base Station (RBS), Media Gateway (MGW), and Radio Network Controller (RNC) of the Universal Mobile Telephony System (UMTS) network.
A CPP node contains two parts, an application part and a platform part [11]. The application part handles the software and hardware that is application specific. The platform part handles
Chapter 2: Theoretical Background
5
common functions such as internal communication, supervision, synchronization and processor structure. This project has a focus on the platform.
2.3.1 CPP Software Structure
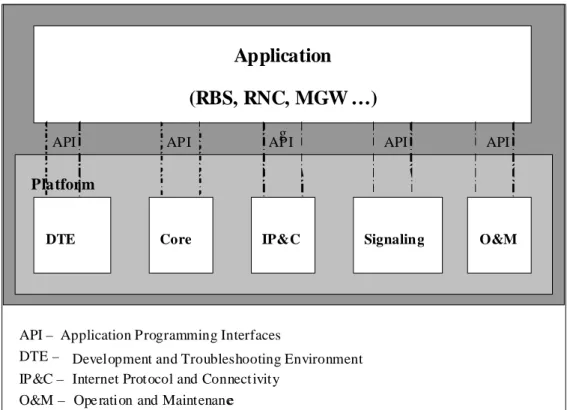
The CPP platform consists of five system areas as shown in the figure below. The areas are: Development and Trouble shooting Environment (DTE), the Core, Internet Protocol and Connectivity (IP&C), Signalling and Operation and Maintenance (O&M).
Figure 1: CPP System Areas
DTE is software development environment for both application software and CPP software. The tools can be used for debugging and building load modules. A load module consists of software that that can be executed a board.
2.3.2 CPP Hardware Structure
A CPP node can vary from the smallest node consisting of a single subrack to a large node consisting of several subracks. A subrack which consists of 28 slots is the smallest building unit. It can be physically configured and updated with different types of circuit boards such as general purpose board, switch core board, media stream processor board and special purpose processor board. The CPP node that was used in this project consists of one subrack and 11 boards. There are two ways to connect to it, either via terminal server or via TCP/IP. The boards and connection possibilities are shown in Figure 2.
Figure 2: Connect to a CPP node
Terminal Server 1 4 5 6 10 11 13 12 19 26 28 TCP/IP PC
Application
(RBS, RNC, MGW …)
gDTE Core IP&C Signaling O&M
API
Platform
API – Application Programming Interfaces
DTE – Development and Troubleshooting Environment IP&C – Internet Prot ocol and Connect ivity
O&M – Ope ration and Maintenance
Chapter 2: Theoretical Background
6 2.3.3 CPP Execution Platform
The CPP system execution platform consists of the hardware and system software that applications need to execute correctly in a multi processor system. CPP offers applications an execution platform comprised of the following:
A number of processors and communication between them A distributed real-time OS, supporting robust application design Operation and Maintenance (O&M) support for applications A fault-tolerant real-time database
A robust fault-tolerant file system
Java Virtual Machine (for management applications)
A space switch
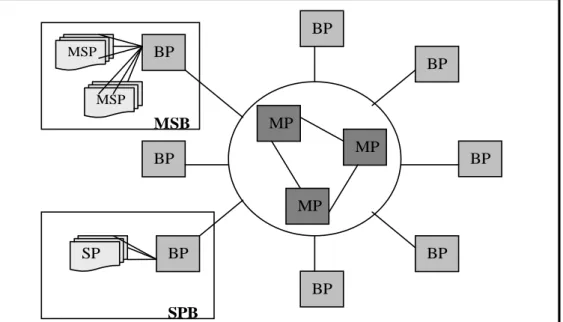
Different types of boards contain different processors. The processors in the execution platform have a hierarchical order as shown in Figure 3. The processors in the Main Processor Cluster have the highest rank. These processors are referred to as Main Processors (MPs) and are interconnected in a full mesh. The MPC is the center in a star topology with Board Processors (BPs) at the end of the rays. The execution platform can be extended beyond the BP domain by connecting one or more subordinate Special purpose Processor (SP) or Media Stream Processor (MSP) to BPs [11].
Figure 3: Processor hierarchy in a CPP node 2.4 Tools Used To Collect Logs 2.4.1 Remote Debug Support
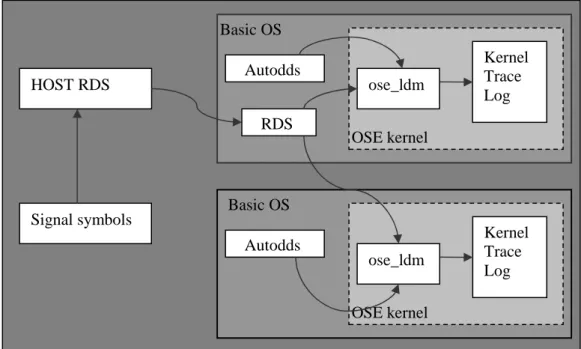
Remote Debug Support (RDS) is a system level debugger for the CPP node. It is used for tracing OSE specific events such as signals between processes and the creation and killing of OSE processes. The command interface of the debugger is the OSE shell and the users should enable the trace actions themselves from the command line interface [12]. The tracing results will be stored in a log file called the Kernel Trace log which is kept in the OS kernel trace buffer. Signal target connection is using the default from Autodds. Figure 4 below shows the procedure of signal tracing with RDS and host environment.
BP MSP MSP BP SP MP MP MP BP BP BP BP BP BP SPB MSB
Chapter 2: Theoretical Background
7 Figure 4: Trace with RDS and Host environment 2.4.2 Trace & Error Package
All software development meets kinds of errors or faults during implementation. Trace & Error package is designed to detect and handle errors of programs running on a CPP node [13]. This tool could be used as a complement to other debug support tools. There are two functionalities supported in the T&E package: the tracing functionality and the error handling functionality. In this project, only the tracing functionality is used. With the help of this functionality the system and functional behaviours can be traced and reported at software development. As shown in Figure 5 below, events to trace are found within the process code and traced by means of “Trace Macros”. A macro is responsible for logging of one event. Most macros allow a message to be added to the log and the message is given as text string.
Figure 5: The process that logs an event using Trace Support 2.4.3 Profiling
Profiling is a system function used to find out bottlenecks in software programs running on a CPP node [14]. There are two areas of profiling functionality: Sample Based Execution Address Profiler and Capsule based Profiler. Both of them have the same purpose as to find out bottlenecks on a CPP node, but the scope between them is a bit different. In the following sections, an overview of the two different profiling tools is presented.
Trace Macros Process T&E log In RAM Log event Log event HOST RDS Signal symbols Basic OS Autodds RDS Basic OS Autodds OSE kernel OSE kernel ose_ldm Kernel Trace Log ose_ldm Kernel Trace Log
Chapter 2: Theoretical Background
8 2.4.3.1 Capsule Based Profiler
Capsule based profiler (CBP) is a profiling tool for Unified Modeling Language (UML) applications running in a CPP node. It could be reached both from the command line interface and from the application UML model. CBP currently collects ten different event types such as total OSE signal dispatch count, transition cost and message latency. The entry keys of these events are based on either capsule classes or actor instances. An event type is a measurement type which is triggered by a specific UML event such as message received, message sent or state change [14]. This tool generates the Target Service Library (TSL) log file that is one of the log files which was used in this project.
2.4.3.2 Execution Address Profiler
The Execution Address Profiler is a sample-based tool that is used to measures the CPU usage of different user defined memory areas or different C/C++ functions. This is done by interrupting the CPU with a fixed periodic sample frequency and taking samples of the current execution address [15]. This tool will extract memory regions for C/C++ functions with the help of a configuration generator called execprofpp and perform execution address profiling on the CPP node with the help of the execprof profiling tool.
2.5 Rational Tools
There are two different Rational tools that are important to know about for this project. One is Rational Rose Real Time (RoseRT) and the other is Rational ClearCase. These are developed by the Rational Software division of IBM and they will be briefly described in the following sections.
2.5.1 Rational Rose Real Time
Rational Rose Real Time (RoseRT) is software development environment which is designed to meet the demands of real time software. Developers could use RoseRT to create models of the software system based on the UML constructors. It is necessary to introduce some main concepts here which will be mentioned frequently throughout the report.
The Capsule is one of the most important concepts of RoseRT. It provides coordinate behaviour in the system and encapsulates the flow of events. Capsules also give transparent concurrency, easy thread assignment, state diagram generation and message passing. It could communicate with other capsules via ports and protocols. A state transition is executed by a capsule when a specified trigger signal arrives. Each capsule can have hundreds of states and transitions.
Another important concept in RoseRT is the actor. These are the instances of capsule classes when the program is running on the target. One capsule can have multiple actors executing at the same time.
A third concept that is important to know about is the threads (also called controller). All capsules should be incarnated on logical threads that are mapped to a physical thread of the memory area in the target.
2.5.2 Rational ClearCase
Rational ClearCase is a software tool for revision control (configuration management etc) of source code and other software development assets. ClearCase forms the base of version control for many large and medium sized businesses and can handle projects with hundreds or thousands of developers [16].
ClearCase can run on a number of platforms including Linux, Solaris and Windows. It can handle large binary files, large numbers of files, and large repository sizes. It handles
Chapter 2: Theoretical Background
9
branching, labeling, and versioning of directories [16]. ClearCase has some unique features such as VOB (Versioned Object Base), Configuration Record, Build Avoidance, Unix/Windows Interoperability, and Integration with other products.
2.6 Eclipse and Eclipse Plug-ins
Eclipse [17] is an open-source development framework that provides a common user interface and workbench model for working with tools. The platform is built in layers of plug-ins, each one defining extensions to the extension points of lower-level plug-ins [18]. This extension model allows plug-ins to be developed with a variety of functions to the basic tooling platform and provides a nice integration with already defined tools. By working on an already defined platform developers can focus on the specific task instead of worrying about integration issues such as different runtime environments.
To further understand the required implementation of an Eclipse plug-in based user interface, a short overview of the Eclipse workbench, the Standard Widget Toolkit (SWT) and the JFace toolkit is presented below.
2.6.1 Eclipse Workbench
From a high level perspective the workbench is a window through which all of the visual elements of an application are organized. This is the same window that is used for the Eclipse development environment. The visual parts fall into the two major categories views and editors. Views allows the user to navigate, view, or provide further information about objects that the user is working with in the workbench, while Editors allows the user to browse a document or input-object. Editors also allow the user to edit and save objects, while the views can save their states for the next time they are opened [18].
From a lower level perspective the workbench is a framework that is supplying additional toolkits for building the user interface. This framework also defines extension points for plug-ins to contribute user interface function to the platform. Many of these extension points are implemented using the Standard Widget Toolkit (SWT) and the JFace framework [18].
2.6.2 Standard Widget Toolkit
The Standard Widget Toolkit (SWT), is a set of Java class libraries created to provide platform native user interfaces, and this is the graphical tool kit used for Eclipse graphics. The toolkit immediately reflects changes in the underlying Operating System GUI look and feel while maintaining a consistent programming model on all platforms. It substitutes the Java AWTa and the Swing toolkit when implementing widgets, layouts and events [18].
2.6.3 JFace
JFace is a user interface (UI) toolkit that provides helper classes for developing UI features that can be tedious to implement. It is designed to provide common application UI functions on top of the SWT library and provides an APIb to build MVCc-based user interfaces with the help of components referred to as viewers. Basic functionalities include populating, sorting, filtering and updating widgets. JFace helps the developer to focus on the implementation of the specific plug-in function, rather than focusing on the underlying widget system or solving commonly occurring UI application problems [18].
a
Abstract Window Toolkit b
Application Programming Interface c Model-View-Controller
Chapter 3: Related Work
10
3
Related Work
3.1 Existing Tools and Approaches for Correlation of Event Data
The event logs play important roles both in analysis in real time and analysis at a later stage. There is lots of research taking place in both of these two areas with both commercial and open source projects in development. This thesis will only focus on retrospective logs analysis and correlation, but it is still related to the real time, which is why both kinds are researched and mentioned in this section.
For the real time analysis the event logs are excellent for monitoring systems, since the event messages in the logs usually are recorded in real time. For retrospective analysis of the logs collected from a running system, it is extremely helpful to better understand and analysis the behaviour of the system. As a result, the designers could find out the weakness of a system and make decisions on how to improve it.
There are some tools already available for event logs correlation and monitoring in the market. Some of them are open sources and some of them are commercial products that can be very expensive. In the following part, a few interesting tools are introduced. These are Rule Core Complex Event Processing (CEP) Server [19], Logsurfer [20], Simple Event Correlator (SEC) [21], ManageEngine Event Log Analyzer [22], and TPTP Trace and Profiling Tools [23].
3.1.1 RuleCore CEP
The ruleCore CEP Server is the solution to the problem of how to know when a critical situation has happened so that users can start a process to manage it. This is done by providing real-time behaviour tracking and tracing of any events that are critical to the system. It uses the Simple Rule-based Event Correlation approach for performance management. Rule-base Event Correlation means to specify some rules such as if-else statements for event data monitoring and correlation. For example, in ruleCore CEP Server, some simple rules are specified like accepting input events that include only name-value pairs and taking events from a specified place.
3.1.2 Logsurfer
Logsurfer is one of the most useful tools for monitoring system logs in real time and reporting on the occurrence of events. It also uses rule-based approach as the ruleCore CEP Server does. Its rules simply provide instructions on what to do when it detects a particular line in the incoming stream of log messages.
3.1.3 SEC
SEC is an open source platform independent tool for rule-based event correlation. It was created to be a lightweight tool that can be used for a wide variety of event correlation tasks. The SEC configuration is stored in text files as rules, each rule specifying an event matching condition, an action list, and optionally a Boolean expression whose truth value decides whether the rule can be applied at a given moment. SEC has been successfully applied in various domains like network management, system monitoring, data security, intrusion detection, log file monitoring and analysis, etc.
3.1.4 Event Log Analyzer
Event Log Analyzer is a web based, real time, event log and application log monitoring and management tool. It collects, analyzes, reports, and archives Event Logs from different places such distributed windows hosts, syslog from devices and application logs from web
Chapter 3: Related Work
11
servers and so on. It helps system administrators to troubleshoot performance problems on hosts, select applications, and the network.
3.1.5 Eclipse TPTP Tracing and Profiling Tools
The TPTPa Tracing and Profiling Project is in contrast with the previous mentioned tools aimed for retrospective analysis of log files. It is a sub project for the Eclipse TPTP Project, and it addresses the tracing and profiling phase of the application lifecycle [23]. It also provides a framework for analyzing and correlation log files, has extension points from where log parsers can be created, and already defined views for analyzing and correlating event data. For representing the event data it makes use of the Common Base Event standard that is explained further in the Common Base Event section.
3.1.6 Conclusions
Most of the available tools are developed for real time monitoring such as Rule Core Complex Event Processing (CEP) Server [19], Logsurfer [20], Simple Event Correlator (SEC) [21] and ManageEngine EventLog Analyzer [22] which are described above. All of them consider a rule based approach for event data correlation in real time and are for this reason less interesting for the context of this project. In addition, ManageEngine Event Log Analyzer is a commercial product, it costs money; and some special tools like HP openView were designed for one particular network management platform only. Among these existing tools, TPTP is the most interesting one. This framework was however found at the end of the thesis project and because of this it was never used in the implementation. Instead it will be compared with our own tools in the Comparison with the TPTP Tracing and Profiling Project chapter and it will also be mentioned in the Future Work section.
3.2 Common Base Event
The Common Base Event allows the use of a common format for any log records from any supported proprietary log files [18]. The proposal comes from IBM and the goal is to standardize the format of events to assist in designing robust, manageable and deterministic systems [24].
Entries stored in the Common Base Event are defined by properties that are collectively referred to as the 3-tuple, consisting of the following elements:
1. Id of component that reports the situation
2. Id of component that is affected by the situation (which may be the same as the component that is reporting the situation)
3. The situation itself
The data collected for the above 3-tuple are properties such as the reporter component, situation, creation time, severity, property, message, extended data element, and sequence number. For more complex logs the extended data element is used for including product-specific attributes which allows user-supplied extensions for any attributes not defined in the Common Base Event. The class hierarchy diagram with further structural details can be seen in appendix section B.3
Using the Common Base Event doesn’t mean that the application generating the log files needs to be re-written, instead parsers can be used to translate it into the new standard when accessed. There are already defined tools in the TPTP framework (see Eclipse TPTP Tracing and Profiling Tools, section 3.1.5) to facilitate in such a translation.
Chapter 4: Event Data Analysis
12
4
Event Data Analysis
This chapter will present the event data analysis part of the project. The sections included in this chapter will present the log files that contain the event data; the Test Base Application that was developed to generate the different log files; correlation analysis of the event data; and finally graphical representation for event data and correlations.
4.1 The Assigned Set of Log Files
The logs that are considered during this project are the following:
• Target Service Library (TSL) log
• Execution Address Profiler (EAP) log
• Trace and Error (T&E) log
• Kernel Trace (KTR) log
• CPU Load log
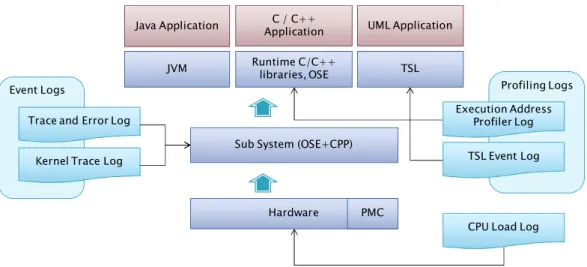
These log files represent information in different parts of the CPP hardware and software layers. The figure below shows a simplified diagram of the different system layers in relation to the analyzed log files.
Figure 6: Relation between log files and system
The log files that are grouped as Event Logs are recording events taking place in the sub system (OSE + CPP), while the log files grouped as Profiling Logs are tracing and recording information from higher level applications. The CPU Load Log is a global log, showing the overall status of the system.
The following sections will give a short overview of the different assigned log files. Example outputs from the same log files are shown in appendix section D.1, and a table of data that can be extracted from these log files can be found in appendix section D.2.
The log files have also been analyzed considering the structure and syntax from a parsing and correlation perspective, but since this part is not directly related to the focus of the project, this analysis with results will instead be mentioned in the Future Work section of this thesis.
Profiling Logs Event Logs
Trace and Error Log
Kernel Trace Log
Hardware PMC Sub System (OSE+CPP)
Java Application C / C++ UML Application Application
JVM Runtime C/C++ TSL libraries, OSE
CPU Load Log TSL Event Log Execution Address
Chapter 4: Event Data Analysis
13 4.1.1 The Trace and Error Log
The Trace and Error (T&E) log shows a history of recorded trace and error events on the system. The events are recoded with the use of macros, and it is frequently used by designers for troubleshooting. The user can decide to print information in messages that belongs to predefined categories referred to as trace groups. Depending on the trace group the message can contain either a simple user-defined string or a formatted string that provides further attribute information. The group and message will be recorded together with a time stamp, load module and source component of the event. Each of the trace groups can individually be switched on or off. Some of the groups that are important to know about later in the report are explained further in the table below.
Trace Group Group information
STATE CHANGE Used to print the state change information of capsules in a RoseRT application
SEND SIG Contains information of the signals sent to a RoseRT capsule REC SIG Contains information of the signals received by a RoseRT capsule TRACE5 Part of the TSL profiling and also called Event Type 9. This group
contains actor specific information
TRACE7 Trace events related to OSE signals for RoseRT applications. Table 1: Trace and Error trace groups
4.1.2 The Kernel Trace Log
The Kernel Trace (KTR) Log records process specific OSE events that occur on the node. This includes events such as sent signals, received signals, created processes, killed processes and error events. The extended version of this log file also contains the binary that is sent with a signal.
4.1.3 The CPU Load Log
CPU Load log stores the CPU utilization for different measuring objects such as process type, process name or priority. There are 4 types of CPU-load logs available according to different measuring objects or measuring ways. The most commonly used one is the CPU peak load log which stores the information of the top hundred CPU-load measurements. It is measured by the system itself once the system starts running. CPU utilization could also be measured according to user specified measuring objects. This could be done from the command line.
4.1.4 The TSL Log
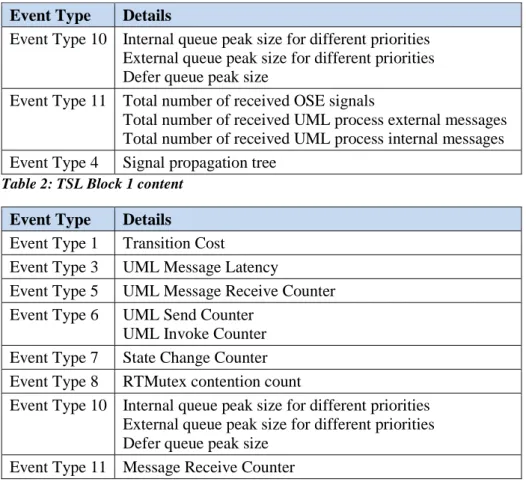
The TSL log collects ten different UML based event types currently. There are two blocks in TSL log: Block 1 and Block 2. Block 1 contains Event Type 4, 10 and 11 for all started controllers. Block 2 contains Event Type 1, 3, 5, 6, 7, 8, 10 and 11 for each started controller. To be noticed, Event Type 9 is recorded in T&E log so it is introduced in The Trace and Error Log section. The TSL Log content in Table 2 and Table 3 gives an overview of the TSL log structure. Some example output of different event types is shown in appendix D.1.4.
Chapter 4: Event Data Analysis
14
Event Type Details
Event Type 10 Internal queue peak size for different priorities External queue peak size for different priorities Defer queue peak size
Event Type 11 Total number of received OSE signals
Total number of received UML process external messages Total number of received UML process internal messages Event Type 4 Signal propagation tree
Table 2: TSL Block 1 content
Event Type Details
Event Type 1 Transition Cost
Event Type 3 UML Message Latency
Event Type 5 UML Message Receive Counter Event Type 6 UML Send Counter
UML Invoke Counter Event Type 7 State Change Counter Event Type 8 RTMutex contention count
Event Type 10 Internal queue peak size for different priorities External queue peak size for different priorities Defer queue peak size
Event Type 11 Message Receive Counter Table 3: TSL Block 2 content
4.1.5 The Execution Address Profiler Log
The Execution Address Profiler (EAP) log collects the CPU utilization per predefined memory area or per C/C++ function. There are two types of execution address profiling logs. One is generated by execution address profiling configuration tool which uses an .elf that is generated when building a product as input and generates a .reg file as output. The other is generated from the tool execprof (see Tools Used To Collect Logs section) which uses the .reg file as an input when the measured object is running on the target. Example log file output can be seen in appendix section D.1.5.
4.2 Log Collection via Test Base Application
Before analyzing the event data correlation possibilities the log files first need to be generated to contain information of the same scenario. This was done by developing and using two test base applications that will be described throughout this section.
4.2.1 Test Base Application
The applications were designed based on studies of OSE, Rational RoseRT and a simple pingpong application which has two simple processes that communicates with each other. Documents that were studied include internal documentations of Ericsson such as Design Rules for Trace and Error Users [13], Execution Address Profiler User Guide [15], Users Guide for RoseRT Target Service Libraries [25].
The two test base applications that we used were developed using OSE to OSE communication design and OSE to UML communication design respectively. The OSE parts of these test base applications were developed with the help of OSE programming, while the UML part is programmed with RoseRT.
Chapter 4: Event Data Analysis
15
In both test base applications, T&E handlings were built into the program in order to do a logging of the type of error or interesting events related to signals like where and when it was detected. This was done by adding T&E macros such as SEND SIG and REC SIG to each process. When the application is running on the target the processes will keep track of which trace group that is currently active.
4.2.1.1 OSE to OSE Communication Design
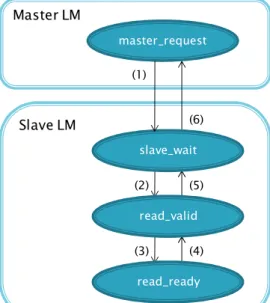
There are two load modules (LM) used in this design: one is called master and the other is called slave. They communicate with each other via sending and receiving OSE signals. The diagram showing the communication can be seen in Figure 7. In the LM master, there is one OSE priority process which is called master_request. In the LM slave, there are three OSE priority processes called slave_wait, read_valid and read_ready.
Figure 7: Test Base Application design, OSE to OSE communication
These processes communicate with each other via OSE signals. The picture above shows the structure of the OSE to OSE Communication applications and the signal dependencies between the OSE processes. This simple application simulates the communication handshake between a real master and a real slave. Before master reads the data from slave, it should first send a request to the slave and then wait for the acknowledge signal from slave. Other signal communication takes place inside the slave LM. Only the handshake for read request was simulated. Master sends READ_REQUEST to slave once per second. The order of the signals should follow the order of the signal number representations from (1) to (6) in the picture in Figure 7.
4.2.1.2 OSE to UML Communication Design
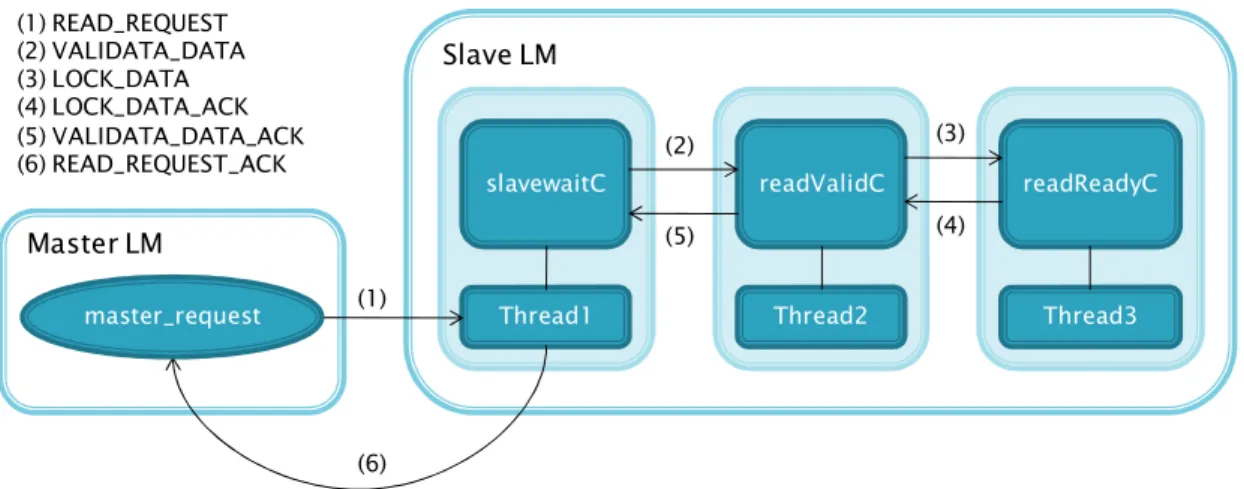
The OSE to UML communication design also consists of two LM: one is master and the other is slave. They communicate with each other via sending and receiving OSE signals. In the LM master, there is one OSE priority process called master_request. In the LM slave, there are five threads called thread1, thread2, thread3, thread5, time and main_thread. These LM are presented in Figure 8, but only thread1, 2, and 3 are shown here since these threads have the similar function as slave_wait, read_valid, read_ready in the OSE slave (described in the previous section). Each of the treads shown in Figure 8 contains one capsule class. Slave LM (6) (2) (5) (4) (3) Master LM master_request slave_wait read_valid read_ready (1) (1) READ_REQUEST (2) VALIDATA_DATA (3) LOCK_DATA (4) LOCK_DATA_ACK (5) VALIDATA_DATA_ACK (6) READ_REQUEST_ACK
Chapter 4: Event Data Analysis
16
Figure 8: Test Base Application design, OSE to UML communication
In this test base application, the handshake between master and slave has the same protocol as the OSE to OSE communication application, but here only signal (1) and (6) are OSE signals. The signals inside the slave LM are UML signals that are delivered by the actors representing the capsules in each of the thread.
4.2.2 Log Collection
After completion of the test base application, another important task is to collect the log files. We need the logs generated for the same test case that is taking place in the same time interval in order to provide sufficient information for correlation analysis of the event data. The logs were collected by running the same application several times and then collecting the log files for each of these times.
From the OSE to OSE applications, Kernel Trace Log, Trace and Error Log, Error Log, Execution Address profiling log and CPU load log could be collected in the same time interval. From the OSE to UML application, all required logs could be collected including TSL log.
All logs should be cleared every time after log collection. In this way, it could assure that all logs collected are from the same time interval. The buffers used to store logs are limited, when the buffer is full, the new coming logs will replace the oldest logs entries which follow the algorithm FIFO (first in first out). As a result, the Test Base Application should be controlled to execute in a suitable time interval to make sure the buffers are not full or just full and no log entries are replaced. This could be done by running the application several times and find out the best suitable running time when the complete logs could be collected. In this way, the logs collected will have the same starting and stopping time.
4.3 Correlation Analysis
Individually, the log files will only provide limited information of events taking place in the system, but by correlating them a wider view and further information can be obtained. Especially interesting is correlation between the event and profiling logs (see Figure 6). These two groups provides information about the system layer and the application layer respectively, and by correlating them it will be possible to help bridge the gap between system problem determination and debugging of applications. In other words, it would be possible to gain further information when looking for problems in different products.
In The Assigned Set of Log Files section the log files where introduced, and the data elements that can be extracted from these are presented in appendix section D.2. To be able to correlate the event data of the different log file types, data elements describing the same events and either directly or in-directly corresponds to each other should be found. These are
Master LM
Slave LM
Thread1 Thread2 Thread3
slavewaitC readValidC readReadyC
(1) (2) (3) (4) (5) (6) (1) READ_REQUEST (2) VALIDATA_DATA (3) LOCK_DATA (4) LOCK_DATA_ACK (5) VALIDATA_DATA_ACK (6) READ_REQUEST_ACK master_request
Chapter 4: Event Data Analysis
17
the elements through which the event data can be correlated and they will be show below in the Common Event Data section. After this section each of the different correlation possibilities will be presented in more detail. The last sub section will cover the correlation accuracy of these correlation possibilities.
4.3.1 Common Event Data
Based on the table shown in appendix section D.2, the common event data amongst the log files can be found. Since the TSL log file type has many common data elements with all of the other log files we will describe these in a separate table.
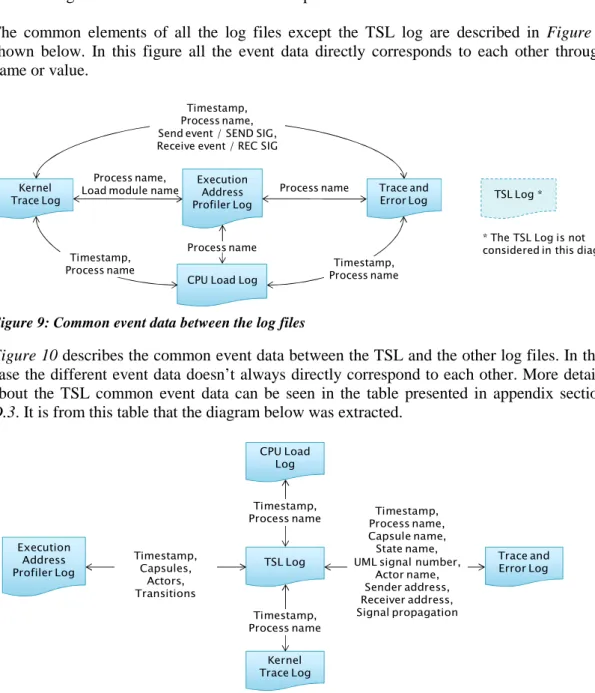
The common elements of all the log files except the TSL log are described in Figure 9 shown below. In this figure all the event data directly corresponds to each other through name or value.
Figure 9: Common event data between the log files
Figure 10 describes the common event data between the TSL and the other log files. In this case the different event data doesn’t always directly correspond to each other. More details about the TSL common event data can be seen in the table presented in appendix section D.3. It is from this table that the diagram below was extracted.
Figure 10: Common event data with the TSL log file 4.3.2 Correlation Possibilities
4.3.2.1 Correlation over Time
All the events that have a timestamp can be correlated over time. This could be useful since there is a big chance that the events taking place at the same time is dependent on each other or at least relates to each other in some way. Through the CPU Load log these events can also be compared to the CPU load at the time that the events take place.
Process name Process name,
Load module name
CPU Load Log Execution
Address Profiler Log Timestamp, Process name, Send event / SEND SIG, Receive event / REC SIG
Trace and Error Log Kernel
Trace Log
Timestamp,
Process name Process nameTimestamp,
Process name * The TSL Log is not considered in this diagram TSL Log * CPU Load Log Kernel Trace Log TSL Log Execution Address Profiler Log Trace and Error Log Timestamp,
Process name Process name,Timestamp, Capsule name, State name, UML signal number,
Actor name, Sender address, Receiver address, Signal propagation Timestamp, Process name Timestamp, Capsules, Actors, Transitions
Chapter 4: Event Data Analysis
18
The TSL log differs from the other log files since the event data is cumulative for each timestamp. Before being correlated with the other log it should be handled either by being compared with the accumulated information from another event type, or by subtracting the information from previous TSL time stamp event before comparison.
Before the event data can be correlated over time the timestamp first needs to be normalized to the same representation and same reference time. Converting time representation should be handled in the interpreting step and then stored in the data model in a unified format. To be able to use the same reference of time some extra thoughts are required since this is handled in different ways for different log files. The time reference for KTR log is represented by a 32 bit integer to represent micro seconds. The integer will restart from zero when there are no more bits to represent the timea or on warm or cold restart of the system. The time reference for the other log files are represented by date and time and will continuously progress from time when the counter was last reset. In the case of the T&E log the time counter will be reset only on cold restarts.
Through the Syslog, which is not handled further in this project, it would theoretically be possible to automate a synchronization calculation. This log file keeps track of all different kinds of system restarts and has a timestamp that is not itself affected by these. However, when considering that different nodes will have different restarts, which would make things even more complicated, a better and much simpler solution is to simply let the user manually synchronize the time through a time delta in the user interface.
4.3.2.2 Correlation over Process
By collecting information about a certain process from different log files and at different times it will be possible to get a better view of how different processes interact with each other and with the system. Some of the information that can be collected for the processes include the T&E messages, received and sent signals and dependencies to other processes. The process dependencies are especially interesting since the including processes might be a possible explanation for a symptom in the system.
Different layers have different representation of processes. In the hardware layer a process is represented with a memory address, in the OSE layer the process is represented with the defined process name, and finally in the application layer the representation is type specific. For the TSL event data terms such as capsule names and actor names are used. It could be useful with the possibility to search one of these representations (e.g. memory address) and also get information about the others representations (e.g. process name) for the same process. In the set of logs that was analyzed, the physical memory address of a process can be found in the EAP log. If the memory address is mapped to the process name, the processes in KTR, T&E and TSL log would be searchable also on memory address.
How the processes are interacting with each other through signal propagation is also interesting and will be discussed in the next section.
4.3.2.3 Correlation over Component Interaction OSE Signal Propagation
By combining information from different log files it is possible to track how OSE signal propagation relates through different parts of the system layers. These propagations and the event data that can contribute with further information are described below together with diagrams showing the interactions. The information in these diagrams is created from our Test Base Application.
Chapter 4: Event Data Analysis
19
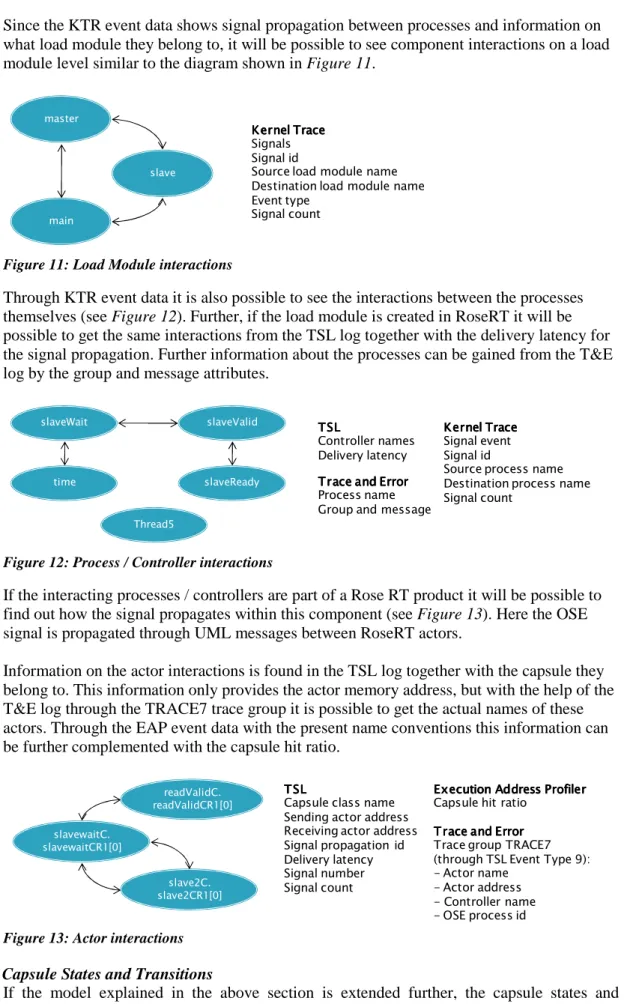
Since the KTR event data shows signal propagation between processes and information on what load module they belong to, it will be possible to see component interactions on a load module level similar to the diagram shown in Figure 11.
Figure 11: Load Module interactions
Through KTR event data it is also possible to see the interactions between the processes themselves (see Figure 12). Further, if the load module is created in RoseRT it will be possible to get the same interactions from the TSL log together with the delivery latency for the signal propagation. Further information about the processes can be gained from the T&E log by the group and message attributes.
Figure 12: Process / Controller interactions
If the interacting processes / controllers are part of a Rose RT product it will be possible to find out how the signal propagates within this component (see Figure 13). Here the OSE signal is propagated through UML messages between RoseRT actors.
Information on the actor interactions is found in the TSL log together with the capsule they belong to. This information only provides the actor memory address, but with the help of the T&E log through the TRACE7 trace group it is possible to get the actual names of these actors. Through the EAP event data with the present name conventions this information can be further complemented with the capsule hit ratio.
Figure 13: Actor interactions Capsule States and Transitions
If the model explained in the above section is extended further, the capsule states and transitions can be traced (see Figure 14). All these different states can be traced and recorded in the T&E log file through the STATE CHANGE trace group. Some of these transitions can
master
main
slave
Kernel Trace Kernel TraceKernel Trace Kernel Trace Signals Signal id
Source load module name Destination load module name Event type Signal count slaveReady slaveValid slaveWait Thread5 time Kernel Trace Kernel Trace Kernel Trace Kernel Trace Signal event Signal id
Source process name Destination process name Signal count TSL TSL TSL TSL Controller names Delivery latency Trace and Error Trace and Error Trace and Error Trace and Error Process name Group and message
slavewaitC. slavewaitCR1[0] slave2C. slave2CR1[0] readValidC. readValidCR1[0] T SL T SL T SL T SL
Capsule class name Sending actor address Receiving actor address Signal propagation id Delivery latency Signal number Signal count
T race and Error T race and Error T race and Error T race and Error Trace group TRACE7 (through TSL Event Type 9): - Actor name
- Actor address - Controller name - OSE process id
Execution Address Profiler Execution Address Profiler Execution Address Profiler Execution Address Profiler Capsule hit ratio