Building an intrusion detection system using a
filter-based feature selection algorithm
Mohammed A. Ambusaidi,
Member, IEEE,
Xiangjian He*,
Senior Member, IEEE,
Priyadarsi Nanda,
Senior Member, IEEE,
and Zhiyuan Tan,
Member, IEEE,
Abstract—Redundant and irrelevant features in data have caused a long-term problem in network traffic classification. These features not only slow down the process of classification but also prevent a classifier from making accurate decisions, especially when coping with big data. In this paper, we propose a mutual information based algorithm that analytically selects the optimal feature for classification. This mutual information based feature selection algorithm can handle linearly and nonlinearly dependent data features. Its effectiveness is evaluated in the cases of network intrusion detection. An Intrusion Detection System (IDS), named Least Square Support Vector Machine based IDS (LSSVM-IDS), is built using the features selected by our proposed feature selection algorithm. The performance of LSSVM-IDS is evaluated using three intrusion detection evaluation datasets, namely KDD Cup 99, NSL-KDD and Kyoto 2006+ dataset. The evaluation results show that our feature selection algorithm contributes more critical features for LSSVM-IDS to achieve better accuracy and lower computational cost compared with the state-of-the-art methods.
Index Terms—Intrusion detection, Feature selection, Mutual information, Linear correlation coefficient, Least square support vector machine
F
1
I
NTRODUCTIOND
ESPITE increasing awareness of network security, the existing solutions remain incapable of fully protecting internet applications and computer networks against the threats from ever-advancing cyber attack techniques such as DoS attack and computer malware. Developing effective and adaptive security approaches, therefore, has become more critical than ever before. The traditional security tech-niques, as the first line of security defence, such as user authentication, firewall and data encryption, are insufficient to fully cover the entire landscape of network security while facing challenges from ever-evolving intrusion skills and techniques [1]. Hence, another line of security defence is highly recommended, such as Intrusion Detection System (IDS). Recently, an IDS alongside with anti-virus software has become an important complement to the security in-frastructure of most organizations. The combination of these two lines provides a more comprehensive defence against those threats and enhances network security.A significant amount of research has been conducted to develop intelligent intrusion detection techniques, which help achieve better network security. Bagged boosting-based on C5 decision trees [2] and Kernel Miner [3] are two of the earliest attempts to build intrusion detection schemes. Methods proposed in [4] and [5] have successfully applied machine learning techniques, such as Support Vector Ma-• M. A. Ambusaidi, X. He and P. Nanda are with the School of Computing and Communications, Faculty of Engineering and IT, University of Technology, Sydney, Australia. E-mail: [email protected], {Xiangjian.He, Priyadarsi.Nanda}@uts.edu.au.
• Z. Tan is with the Services, Cybersecurity and Safety Group, University of Twente, Enschede, Netherlands. E-mail: [email protected].
• * Corresponding author
chine (SVM), to classify network traffic patterns that do not match normal network traffic. Both systems were equipped with five distinct classifiers to detect normal traffic and four different types of attacks (i.e., DoS, probing, U2R and R2L). Experimental results show the effectiveness and robustness of using SVM in IDS. Mukkamala et al. [6] investigated the possibility of assembling various learning methods, including Artificial Neural Networks (ANN), SVMs and Multivariate Adaptive Regression Splines (MARS) to detect intrusions. They trained five different classifiers to distin-guish the normal traffic from the four different types of attacks. They compared the performance of each of the learning methods with their model and found that the ensemble of ANNs, SVMs and MARS achieved the best performance in terms of classification accuracies for all the five classes. Toosi et al. [7] combined a set of neuro-fuzzy classifiers in their design of a detection system, in which a genetic algorithm was applied to optimize the structures of neuro-fuzzy systems used in the classifiers. Based on the pre-determined fuzzy inference system (i.e., classifiers), de-tection decision was made on the incoming traffic. Recently, we proposed an anomaly-based scheme for detecting DoS attacks [8]. The system has been evaluated on KDD Cup 99 and ISCX 2012 datasets and achieved promising detection accuracy of 99.95% and 90.12% respectively.
However, current network traffic data, which are often huge in size, present a major challenge to IDSs [9]. These “big data” slow down the entire detection process and may lead to unsatisfactory classification accuracy due to the computational difficulties in handling such data. Classifying a huge amount of data usually causes many mathematical difficulties which then lead to higher computational com-plexity. As a well-known intrusion evaluation dataset, KDD Cup 99 dataset is a typical example of large-scale datasets. This dataset consists of more than five million of training
samples and two million of testing samples respectively. Such a large scale dataset retards the building and testing processes of a classifier, or makes the classifier unable to perform due to system failures caused by insufficient mem-ory. Furthermore, large-scale datasets usually contain noisy, redundant, or uninformative features which present critical challenges to knowledge discovery and data modeling.
To address the aforementioned problems on the methods for feature selection, we have proposed a hybrid feature selection algorithm (HFSA) in [10]. HFSA consists of two phases. The upper phase conducts a preliminary search to eliminate irrelevant and redundancy features from the original data. This helps the wrapper method (the lower phase) to decrease the searching range from the entire original feature space to the pre-selected features (the output of the upper phase). In this paper, we extend our work discussed in [10]. The key contributions of this paper are listed as follows.
1) This work proposes a new filter-based feature se-lection method, in which theoretical analysis of mutual information is introduced to evaluate the dependence between features and output classes. The most relevant features are retained and used to construct classifiers for respective classes. As an enhancement of Mutual Information Feature Selec-tion (MIFS) [11] and Modified Mutual InformaSelec-tion- Information-based Feature Selection (MMIFS) [12], the proposed feature selection method does not have any free parameter, such as β in MIFS and MMIFS. There-fore, its performance is free from being influenced by any inappropriate assignment of value to a free parameter and can be guaranteed. Moreover, the proposed method is feasible to work in various domains, and more efficient in comparison with HFSA [10], where the computationally expensive wrapper-based feature selection mechanism is used. 2) We conduct complete experiments on two well-known IDS datasets in addition to the dataset used in [10]. This is very important in evaluating the performance of IDS since KDD dataset is outdated and does not contain most novel attack patterns in it. In addition, these datasets are frequently used in the literature to evaluate the performance of IDS. Moreover, these datasets have various sample sizes and different numbers of features, so they provide a lot more challenges for comprehensively testing feature selection algorithms.
3) Different from the detection framework proposed in [10] that designs only for binary classification, we design our proposed framework to consider multiclass classification problems. This is to show the effectiveness and the feasibility of the proposed method.
The rest of this paper is as follows. Section 2 out-lines the related works to this study. Section 3 introduces the proposed feature selection algorithm FMIFS. Section 4 briefly describes the concept of Least Square Support Vector Machine (LS-SVM) and details the detection framework showing different detection stages involved in the proposed scheme. Section 5 presents the experimental details and
results. Finally, we draw a conclusion and discuss our future work in Section 6.
2
R
ELATEDW
ORKS 2.1 Feature SelectionFeature selection is a technique for eliminating irrelevant and redundant features and selecting the most optimal subset of features that produce a better characterization of patterns belonging to different classes. Methods for fea-ture selection are generally classified into filter and wrap-per methods [12]. Filter algorithms utilize an independent measure (such as, information measures, distance measures, or consistency measures) as a criterion for estimating the relation of a set of features, while wrapper algorithms make use of particular learning algorithms to evaluate the value of features. In comparison with filter methods, wrapper methods are often much more computationally expensive when dealing with high-dimensional data or large-scale data. In this study hence, we focus on filter methods for IDS.
Due to the continuous growth of data dimensionality, feature selection as a pre-processing step is becoming an essential part in building intrusion detection systems [13]. Mukkamala and Sung [14] proposed a novel feature selec-tion algorithm to reduce the feature space of KDD Cup 99 dataset from 41 dimensions to 6 dimensions and evaluated the 6 selected features using an IDS based on SVM. The results show that the classification accuracy increases by 1% when using the selected features. Chebrolu et al. [15] investigated the performance in the use of a Markov blanket model and decision tree analysis for feature selection, which showed its capability of reducing the number of features in KDD Cup 99 from 41 to 12 features. Chen et al. [16] proposed an IDS based on Flexible Neural Tree (FNT). The model applied a pre-processing feature selection phase to improve the detection performance. Using the KDD Cup 99, FNT model achieved 99.19% detection accuracy with only 4 features.
Recently, Amiri [12] proposed a forward feature selec-tion algorithm using the mutual informaselec-tion method to measure the relation among features. The optimal feature set was then used to train the LS-SVM classifier and build the IDS. Horng et al. [17] proposed an SVM-based IDS, which combines a hierarchical clustering and the SVM. The hierarchical clustering algorithm was used to provide the classifier with fewer and higher quality training data to reduce the average training and testing time and improve the classification performance of the classifier. Experimented on the corrected labels KDD Cup 99 dataset, which includes some new attacks, the SVM-based IDS scored an overall accuracy of 95.75% with a false positive rate of 0.7%.
2.2 Performance Evaluation
All of the aforementioned detection techniques were evalu-ated on the KDD Cup 99 dataset. However, due to some lim-itations in this dataset, which will be discussed in Subsection 5.1, some other detection methods [18], [19], [20], [21], [22], [23] were evaluated using other intrusion detection datasets, such as NSL-KDD [24] and Kyoto 2006+ [25]. A dimension-ality reduction method proposed in [25] was to find the most
important features involved in building a naive bayesian classifier for intrusion detection. Experiments conducted on the NSL-KDD dataset produced encouraging results.
Chitrakar et al. [20] proposed a Candidate Support Vec-tor based Incremental SVM algorithm (CSV-ISVM in short). The algorithm was applied to network intrusion detection. They evaluated their CSV-ISVM-based IDS on the Kyoto 2006+ [25] dataset. Experimental results showed that their IDS produced promising results in terms of detection rate and false alarm rate. The IDS was claimed to perform real-time network intrusion detection. Therefore, in this work, to make a fair comparison with those detection systems, we evaluate our proposed model on the aforementioned datasets.
3
F
ILTER-
BASEDF
EATURES
ELECTIONIf one considers correlations between network traffic records to be linear associations, then a linear measure of depen-dence such as linear correlation coefficient can be used to measure the dependence between two random variables. However, considering the real world communication, the correlation between variables can be nonlinear as well. Apparently, a linear measure cannot reveal the relation be-tween two nonlinearly dependent variables. Thus, we need a measure capable of analysing the relation between two variables no matter whether they are linearly or nonlinearly dependent. For these reasons, this work intends to explore a means of selecting optimal features from a feature space regardless of the type of correlation between them.
3.1 Feature Selection Based on Mutual Information
Mutual Information (MI) is one of the promising measures in the realm of variable dependence estimation. Uniquely, it can cope with not only linearly dependent variables but also nonlinearly dependent ones. Thus, it is chosen as the base of our proposed feature selection algorithm.
3.1.1 Mutual Information
MI is a symmetric measure of the relationship between two random variables. It yields a non-negative value, and a zero value of MI indicates that the two observed variables are statistically independent [26].
Given two continuous random variables U =
{u1, u2, ..., ud}andV ={v1, v2, ..., vd}, wheredis the total number of samples, the mutual information betweenUand Vis defined in (1).
I(U;V) =H(U) +H(V)−H(U, V), (1) where H(U) and H(V) are the information entropies of U and V. The information entropies are the measures of un-certainties of the random variablesUandV, whereH(U) =
−R
up(u) logp(u)du and H(V) = − R
vp(v) logp(v)dv, re-spectively. The joint entropy of U and V is defined as H(U, V) =−R
u R
vp(u, v) logp(u, v)dudv.
Therefore, to quantify the amount of knowledge on variableUprovided by variableV (and vice versa), which is known as mutual information, (2) is used.
I(U;V) = Z u Z v p(u, v) log p(u, v) p(u)p(v)dudv, (2)
wherep(u,v) is a joint probability density function (pdf), and p(u) =R
p(u, v)dvandp(v) =R
p(u, v)duare the marginal density functions.
For discrete variables, mutual information between two discrete random variables with a joint probability mass function p(u,v) and marginal probabilities p(u) and p(v) is defined by replacing the integration notation with the summation notation as shown in (3).
I(U;V) = X u∈U X v∈V p(u, v) log p(u, v) p(u)p(v). (3) In the case of feature selection, a feature is relevant to the class if it contains important information about the class; otherwise it is irrelevant or redundant. Since mutual information is good at quantifying the amount of infor-mation shared by two random variables, it is often used as a criterion to evaluate the relevance between a feature and and a class label [27]. Under this context, features with high predictive power are the ones that have larger mutual information I(C; f). On the contrary, in the case of I(C; f) equal to zero, the feature f and the Class C are proven to be independent of each other. This means that feature f contributes redundancy to the classification.
However, due to the reason that the value of the MI between variables is used as a criterion to select features from the original set, any computational errors could result in a significant degradation of the accuracy of any feature selection algorithms based on this measure. Therefore, the computation of MI, which requires the estimation of pdfs or entropies from the input data instances, is not an easy task. Thus, several estimation techniques could be applied to compute MI. Histogram and kernel density estimations are the most popular estimation methods for estimating the pdfs [28], [29]. Peng et al. [30] claimed that the histogram approach was computationally efficient, but could produce a large number of estimation errors. They also stated that kernel density estimation had a high estimation quality and at the same time high computational load. Another signif-icant challenge with histogram techniques is the restriction to a low-dimensional data space [31]. It has also been pointed out by Rossi [32] that both histogram and kernel density approaches suffer from the well-known problem of dimensionality. As this study is working with high-dimensional data, these two estimations are inapplicable.
To avoid the aforementioned problems, in this work, the estimator proposed by Kraskov et al. [33] is applied. Unlike histogram and kernel density estimations, this technique relies on estimating the entropies of given data using the average distance from each datum to itsk-nearest neighbors. The novelty of this estimator is its ability to estimate MI between two random variables of any data space. The main idea is to estimate the entropy, without knowing the densitiesp(u,v),p(u) andp(v), based on the algorithm of k-nearest neighbors. More details about estimating MI can be found in [33].
3.1.2 State-of-the-art feature selection algorithms based on mutual information
Several feature selection algorithms, including those in [11], [30], [34], [35], [36], have been proposed in literature based
on the principle of mutual information. Battitis MIFS [11] is one of the earliest methods that evaluate features based on their relevance to classification. It harnesses the MI between the input and the output for each round of selection of features by calculatingI(C;fi)andI(fs, fi), wherefsand
fiare candidate features andCis a class label. MIFS selects the feature that maximisesI(C;fi), which is the amount of information that feature fi carries about the classC, and is corrected by subtracting a quantity proportional to the MI with the features selected previously. Numerous studies, including [34] and [12], have been conducted to improve Battiti’s MIFS. The enhancements in all of these methods have been made on the improvement of the second criterion term as shown in Step 4 of Battiti’s MIFS. However, these methods present some limitations. For example, there is not a specific guideline to select an appropriate value for the parameter β in MIFS [11], MIFS-U [34] and MMIFS [12]. In addition, the imbalance between the first and the second terms of the selection criterion in those methods has not been completely solved. More detailed and clearer explanation about these methods and their limitations can be found in Appendix A.
3.1.3 Flexible mutual information based feature selection To remove the burden of setting an appropriate value for β as it is required in Battiti’s MIFS, Kwak’s MIFS-U and Amiri’s MMIFS, a new variation of MIFS is proposed in this section. This new feature selection approach suggests an enhancement to the feature selection criterion involved in the computation of Step 4 of Battiti’s MIFS algorithm (discussed in Appendix A). Equation (4) shows a new for-mulation of the feature selection criterion involved, which is intended to select a feature from an initial input feature set that maximizes I(C; fi) and minimizes the average of redundancy MRs simultaneously. GM I= argmax fi∈F (I(C;fi)− 1 |S| X fs∈S M R), (4) whereI(C;fi)is the amount of information that featurefi carries about the classC. MR, in (4), is the relative minimum redundancy of feature fi against featurefsand is defined by (5).
M R= I(fi;fs) I(C;fi)
(5) where fi ∈ F and fs ∈ S. In the case of I(C;fi) = 0, featurefican be discarded without computing (4). Iffiand
fs are relatively highly dependent with regard toI(C;fi), featurefiwill contribute to redundancy. Thus, to reduce the number of features that need to be examined, a numerical threshold T h(= 0) value is applied to GM I in (4) so that
GM Ihas the following properties:
1) If (GM I= 0), then the current featurefiis irrelevant or unimportant to the output C because it cannot provide any additional information to the classifi-cation after selecting the subsetSof features. Thus, the current candidatefiis removed fromS.
2) If (GM I >0), then the current featurefiis relevant or important to the outputCbecause it can provide some additional information to the classification
after selecting the subsetSof the feature. Thus, the current candidatefiis added intoS.
3) If (GM I <0), then the current featurefi is redun-dant to the outputCbecause it can cause reduction in the amount of MI between the selected subset S and the output C. It is worth noting that the second term in Equation (4), which measure the redundancy among features, is larger than the first term, which measure the relevance between feature fiand the output class. Thus, featurefi is removed fromS.
The selection process of FMIFS is demonstrated in Algo-rithm 1.
Algorithm 1 Flexible mutual information based feature selection
Input: Feature setF ={fi, i= 1, ..., n}
Output:S- the selected feature subset
begin
Step1.Initialization: setS=φ
Step2.CalculateI(C;fi)for each feature,i= 1, ..., n
Step3.nf =n; Select the featurefisuch that: argmax
fi
(I(C;fi)), i= 1, ..., nf,
Then, setF ←F\ {fi};S←S∪ {fi};nf =nf−1.
Step4. whileF 6=φdo
CalculateGM Iin (4) to findfiwherei∈ {1,2,· · ·, nf};
nf =nf−1; F ←F\{fi}; if(GM I>0)then S←S∪ {fi}. end end
Step 5.SortSaccording to the value ofGM Iof each selected feature.
returnS
3.2 Feature Selection Based on Linear Correlation Co-efficient
In order to demonstrate the flexibility and effectiveness of FMIFS against feature selection based on linear dependence measure, we substitute MI by Linear Correlation Coefficient (LCC) in Algorithm 1.
LCC [37] is one of the most popular dependence mea-sures evaluating the relationship between two random vari-ables. Whilst LCC is fast and accurate in measuring the correlation between random linearly dependent variables, it is insensitive to nonlinear correlations. Given the two same random variablesU andV of the same type, the correlation coefficient between these two variables is defined in Equa-tion (6). corr(U;V) = Pn i=1(ui−u)(vi−v) pPn i=1(ui−u)2 Pn i=1(vi−v)2 . (6)
The value ofcorr(U;V) falls in a definite closed interval [-1,1] . A value close to either -1 or 1 indicates a strong relationship between the two variables. A value close to
0 infers a weak relationship between them. Algorithm 2 shows our proposed algorithm based on LCC, and this algorithm is named Flexible Linear Correlation Coefficient based Feature Selection (FLCFS). Algorithm 2 is designed to select a feature that maximizesGcorrin Equation (7) and to eliminate irrelevant and redundant features.
Gcorr= argmax fi∈F (corr(C;fi)− 1 |S | X fs∈S corr(fi;fs) corr(C;fi) ). (7)
Algorithm 2 Flexible Linear Correlation Coefficient based Feature Selection
Input: Feature setF ={fi, i= 1, ..., n}
Output:S- the selected feature subset
begin
Step1.Initialization:S=φ
Step2.Calculatecorr(C;fi)for each feature,i= 1, ..., n
Step3.nf =n; Select the featurefisuch that: argmax
fi
(corr(C;fi)), i= 1, ..., nf,
Then, setF ←F\ {fi};S←S∪ {fi};nf =nf−1.
Step4. whileF 6=φdo
CalculateGcorrin (7) to findfiwherei∈ {1,2,· · ·, nf};
nf =nf−1; F ←F\{fi}; if(Gcorr>0)then S←S∪ {fi}. end end
Step 5. Sort S according to the value of Gcorr of each selected feature.
returnS
4
I
NTRUSIOND
ETECTIONF
RAMEWORK BASED ONL
EASTS
QUARES
UPPORTV
ECTORM
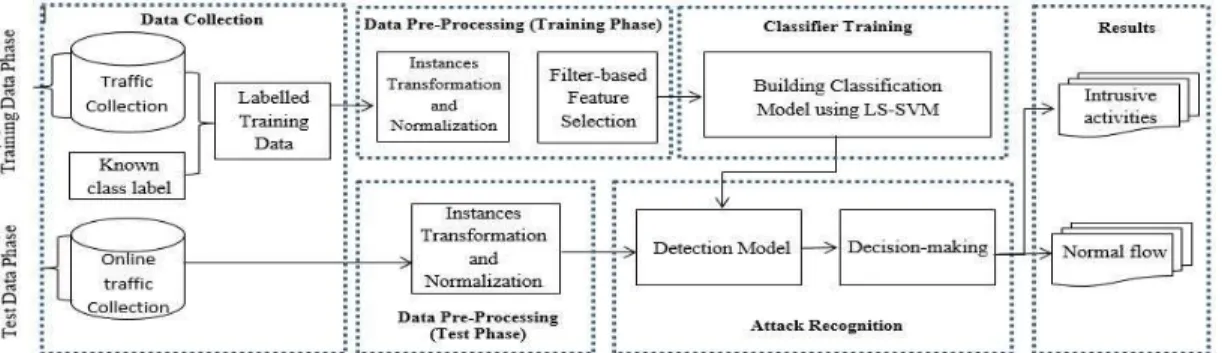
ACHINEThe framework of the proposed intrusion detection sys-tem is depicted in Figure 1. The detection framework is comprised of four main phases: (1) data collection, where sequences of network packets are collected, (2) data prepro-cessing, where training and test data are preprocessed and important features that can distinguish one class from the others are selected, (3) classifier training, where the model for classification is trained using LS-SVM, and (4) attack recognition, where the trained classifier is used to detect intrusions on the test data.
Support Vector Machine (SVM) is a supervised learning method [38]. It studies a given labeled dataset and con-structs an optimal hyperplane in the corresponding data space to separate the data into different classes. Instead of solving the classification problem by quadratic program-ming, Suykens and Vandewalle [39] suggested re-framing the task of classification into a linear programming problem. They named this new formulation the Least Squares SVM (LS-SVM). LS-SVM is a generalized scheme for classification and also incurs low computation complexity in comparison with the ordinary SVM scheme [40]. One can find more details about calculating LS-SVM in Appendix B. The fol-lowing subsections explain each phase in detail.
4.1 Data Collection
Data collection is the first and a critical step to intrusion detection. The type of data source and the location where data is collected from are two determinate factors in the design and the effectiveness of an IDS. To provide the best suited protection for the targeted host or networks, this study proposes a network-based IDS to test our proposed approaches. The proposed IDS runs on the nearest router to the victim(s) and monitors the inbound network traffic. During the training stage, the collected data samples are categorised with respect to the transport/Internet layer protocols and are labeled against the domain knowledge. However, the data collected in the test stage are categorized according to the protocol types only.
4.2 Data Preprocessing
The data obtained during the phase of data collection are first processed to generate the basic features such as the ones in KDD Cup 99 dataset [41]. This phase contains three main stages shown as follows.
4.2.1 Data transferring
The trained classifier requires each record in the input data to be represented as a vector of real number. Thus, every symbolic feature in a dataset is first converted into a numer-ical value. For example, the KDD CUP 99 dataset contains numerical as well as symbolic features. These symbolic features include the type of protocol (i.e., TCP, UDP and ICMP), service type (e.g., HTTP, FTP, Telnet and so on) and TCP status flag (e.g., SF, REJ and so on). The method simply replaces the values of the categorical attributes with numeric values.
4.2.2 Data normalisation
An essential step of data preprocessing after transferring all symbolic attributes into numerical values is normalisation. Data normalisation is a process of scaling the value of each attribute into a well-proportioned range, so that the bias in favor of features with greater values is eliminated from the dataset. Data used in Section 5 are standardised. Every feature within each record is normalised by the respective maximum value and falls into the same range of [0-1]. The transferring and normalisation process will also be applied to test data.
For KDD Cup 99 and to make a comparison with those systems that have been evaluated on different types of at-tacks (discussed in Section 5.5 and Section 5.6), we construct five classes. One of these classes contains purely the normal records and the other four hold different types of attacks (i.e., DoS, Probe, U2R, R2L), respectively.
4.2.3 Feature selection
Even though every connection in a dataset is represented by various features, not all of these features are needed to build an IDS. Therefore, it is important to identify the most informative features of traffic data to achieve higher performance. In the previous section using Algorithm 1, a flexible method for the problem of feature selection, FMIFS, is developed. However, the proposed feature selection al-gorithms can only rank features in terms of their relevance
Fig. 1: The framework of the LS-SVM-based intrusion detection system
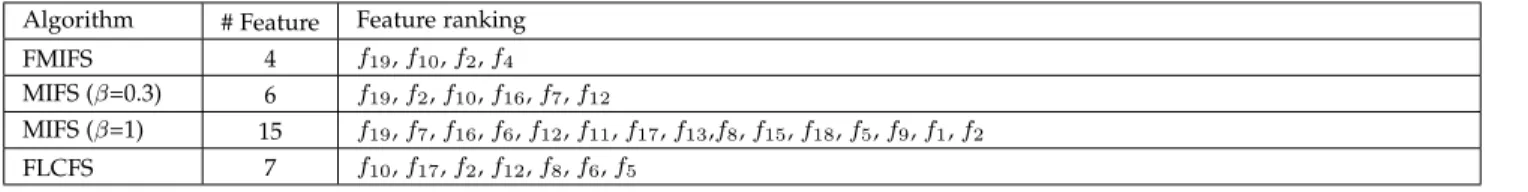
but they cannot reveal the best number of features that are needed to train a classifier. Therefore, this study applies the same technique proposed in [12] to determine the optimal number of required features. To do so, the technique first utilizes the proposed feature selection algorithm to rank all features based on their importance to the classification processes. Then, incrementally the technique adds features to the classifier one by one. The final decision of the optimal number of features in each method is taken once the highest classification accuracy in the training dataset is achieved. The selected features for all datasets are depicted in Table 1 [a-c], where each row lists the number and the indexes of the selected features with respect to the corresponding feature selection algorithm. In addition, for KDD Cup 99, the proposed feature selection algorithm is applied for the aforementioned classes. The selected features are shown in Table 3.
4.3 Classifier Training
Once the optimal subset of features is selected, this subset is then taken into the classifier training phase where LS-SVM is employed. Since SVMs can only handle binary classification problems and because for KDD Cup 99 five optimal feature subsets are selected for all classes, five LS-SVM classifiers need to be employed. Each classifier distinguishes one class of records from the others. For example the classifier of Normal class distinguishes Normal data from non-Normal (All types of attacks). The DoS class distinguishes DoS traffic from non-DoS data (including Normal, Probe, R2L and U2R instances) and so on. The five LS-SVM classifiers are then combined to build the intrusion detection model to distinguish all different classes.
4.4 Attack Recognition
In general, it is simpler to build a classifier to distinguish between two classes than considering multiclasses in a prob-lem. This is because the decision boundaries in the first case can be simpler. The first part of the experiments in this paper uses two classes, where records matching to the normal class are reported as normal data, otherwise are considered as attacks. However, to deal with a problem having more than two classes, there are two popular techniques: “One-Vs-One” (OVO) and“One-Vs-All” (OVA). Given a classification problem with M classes(M >2), the OVO approach on the one hand divides an M-class problem into M∗(M2−1) binary problems. Each problem is handled by a separate binary
Algorithm 3 Intrusion detection based on LS-SVM
{Distinguishing intrusive network traffic from normal net-work traffic in the case of multiclass}
Input: LS-SVM Normal Classifier, selected features (normal class), an observed data itemx
Output:Lx- the classification label ofx
begin
Lx←classification ofxwith LS-SVM of Normal class
ifLx== “Normal”then ReturnLX
else
do: Run Algorithm 4 to determine the class of attack
end end
classifier, which is responsible for separating the data of a pair of classes.
The OVA approach, on the other hand, divides an M-class problem into M binary problems. Each problem is handled by a binary classifier, which is responsible for separating the data of a single class from all other classes. Obviously, the OVO approach requires more binary clas-sifiers than OVA. Therefore, it is more computationally intensive. Rifkin and Klautau [42] demonstrated that the OVA technique was preferred over OVO. As such, the OVA technique is applied to the proposed IDS to distinguish between normal and abnormal data using the LS-SVM method.
After completing all the aforementioned steps and the classifier is trained using the optimal subset of features which includes the most correlated and important features, the normal and intrusion traffics can be identified by using the saved trained classifier. The test data is then directed to the saved trained model to detect intrusions. Records matching to the normal class are considered as normal data, and the other records are reported as attacks. If the classifier model confirms that the record is abnormal, the subclass of the abnormal record (type of attacks) can be used to determine the record’s type. Algorithms 3 and Algorithm 4 describe the detection processes.
Algorithm 4Attack classification based on LS-SVM
Input: LS-SVM Normal Classifier, selected features (normal class), an observed data itemx
Output:Lx- the classification label ofx
begin
Lx←classification ofxwith LS-SVM of DoS class
ifLx==“DoS”then ReturnLX
else
Lx←classification ofxwith LS-SVM of Probe class
ifLx== “Probe”then ReturnLX
else
Lx←classification ofxwith LS-SVM of R2L class
ifLx== “R2L”then ReturnLX else Lx==“U2R”; ReturnLX end end end end
5
E
XPERIMENTALR
ESULTS ANDA
NALYSIS 5.1 Description of the Benchmark DatasetsCurrently, there are only a few public datasets available for intrusion detection evaluation. Among these datasets, the KDD Cup 99 dataset, NSL-KDD dataset and Kyoto 2006+ dataset have been commonly used in the literature to assess the performance of IDSes. According to the review by Tsai et al. [43], the majority of the IDS experiments were performed on the KDD Cup 99 datasets. In addition, these datasets have different data sizes and various numbers of features which provide comprehensive tests in validating feature selection methods. Therefore, in order to facilitate a fair and rational comparison with other state-of-the-art detection approaches, we have selected these three datasets to evaluate the performance of our detection system.
The KDD Cup 99 dataset is one of the most popular and comprehensive intrusion detection datasets and is widely applied to evaluate the performance of intrusion detection systems [43]. It consists of five different classes, which are normal and four types of attack (i.e., DoS, Probe, U2R and R2L). It contains training data with approximately five million connection records and test data with about two million connection records. Each record in these datasets is labeled as either normal or an attack, and it has 41 different quantitative and qualitative features.
The NSL-KDD is a new revised version of the KDD Cup 99 that has been proposed by Tavallaee et al. in [24]. This dataset addresses some problems included in the KDD Cup 99 dataset such as a huge number of redundant records in KDD Cup 99 data. As in the case of the KDD Cup 99 dataset, each record in the NSL-KDD dataset is composed of 41 different quantitative and qualitative features.
Each of the KDD Cup 99 and NSL-Kdd benchmarks includes three different sets: training (the “10% KDD Cup 9900data and“KDDTrain+00respectively), testing (“kddcup testdata00 and “KDDTest+ 00 respectively) and a set con-taining samples of new attacks previously unseen in the training data (the corrected labels KDD Cup 99 dataset and KDDTest−21dataset respectively).
The Kyoto 2006+ dataset was presented by Song et al. [25]. The dataset covers over three years of real traffic data, over the period between November 2006 and August 2009, collected from both honeypots and regular servers that were deployed at Kyoto University. Each connection in this dataset has 24 different features.
5.2 Experimental Setup
In all experiments, the value of MI is estimated using the estimator proposed by Kraskov et al. [33] (discussed in Subsection 3.1). To select the best value of k used in the estimator for the approach ofk-nearest neoghbors, several experiments with different values for k are conducted. Through the experiments, we have found that the best estimated value of MI was achieved whenk= 6, which is the same as the value suggested in [33]. In addition, the control parameter β for MIFS algorithm is varied in the range of [0,1], which is the range suggested in [11] and [34], with a step size of 0.1. The optimal value ofβ that gives the best accuracy rate is selected for a comparison with the proposed approach.
Empirical evidence shows that 0.3 is the best value for β in the three datasets, so we included the results with this optimalβ value for comparison. We have also included the results with the value ofβ equal to 1, which is the same as the value applied in [34]. The reason of choosing different values ofβ is to test all possibilities of the feature rankings since the best value is undefined for the given problem. The experimental results of different values of β indicate that when the value is closer to 1 the MIFS algorithm assigns larger weights to the redundant features. In other words, the algorithm places more emphasis on the relation between input features rather than between input features and the class and vice versa.
Based on the above findings, to demonstrate the su-periority of the proposed feature selection algorithm, five LSSVM-IDSs are built based on all features and the features that are chosen using four different feature selection algo-rithms (i.e., the proposed FMIFS, MIFS (β = 0.3), MIFS (β= 1), FLCFS), respectively, withk= 6. Three different datasets, namely KDD Cup 99 [41], NSL-KDD [24] and Kyoto 2006+ dataset [25], are used to evaluate the performance of these IDSs . The experimental results of the LSSVM-IDS based on FMIFS are compared with the results using the other four LSSVM-IDSs and several other state-of-the-art IDSs.
For the experiments on Kyoto 2006+ dataset, the data of 27, 28, 29, 30 and 31 August 2009 are selected, which contain the latest updated data. For the experimental aims on each dataset, 152460 samples are randomly selected. A 10-fold cross-validation is used to evaluate the detection performance of the proposed LSSVM-IDS. In addition, in order to make a comparison with the detection system proposed in [20], the same sets of data captured from 1st
TABLE 1: Comparison of feature ranking
(a) Feature ranking results on the KDD Cup 99 dataset Algorithm # Feature Feature ranking
FMIFS 19 f5,f23,f6,f3,f36,f12,f24,f37,f2,f32,f9,f31,f29,f26,f17,f33,f35,f39,f34 MIFS (β=0.3) 25 f5,f23,f6,f9,f32,f18,f19,f15,f17,f16,f14,f7,f20,f11,f21,f13,f8,f22,f29,f31,f41,f1,f26,f10, f37 MIFS (β=1) 25 f5,f7,f17,f32,f18,f20,f9,f15,f14,f21,f16,f8,f22,f19,f13,f11,f29,f1,f41,f31,f10,f27,f26,f12, f28 FLCFS 17 f23,f29,f12,f24,f3,f36,f32,f2,f8,f31,f25,f1,f11,f39,f10,f4,f19 (b) Feature ranking results on the NSL-KDD dataset Algorithm # Features Feature ranking
FMIFS 18 f5,f30,f6,f3,f4,f29,f12,f33,f26,f37,f39,f34,f25,f38,f23,f35,f36,f28
MIFS (β=0.3) 23 f5,f3,f26,f9,f18,f22,f20,f21,f14,f8,f11,f12,f7,f17,f16,f19,f1,f15,f41,f32,f13,f28,f36 MIFS (β=1) 28 f5,f22,f9,f26,f18,f20,f14,f21,f16,f8,f11,f1,f17,f7,f12,f19,f15,f40,f32,f13,f10,f28,f31,f27,
f2,f36,f23,f3
FLCFS 22 f29,f12,f33,f39,f4,f23,f34,f25,f26,f38,f8,f35,f19,f32,f18,f3,f6,f40,f30,f5,f27,f22 (c) Feature ranking results on the Kyoto 2006+ dataset
Algorithm # Feature Feature ranking
FMIFS 4 f19,f10,f2,f4
MIFS (β=0.3) 6 f19,f2,f10,f16,f7,f12
MIFS (β=1) 15 f19,f7,f16,f6,f12,f11,f17,f13,f8,f15,f18,f5,f9,f1,f2 FLCFS 7 f10,f17,f2,f12,f8,f6,f5
to 3rd November 2007 are chosen for evaluation too. The comparison results are shown in Table 6.
5.3 Performance Evaluation
Several experiments have been conducted to evaluate the performance and effectiveness of the proposed LSSVM-IDS. For this purpose, the accuracy rate, detection rate, false positive rate andF-measure metrics are applied. The accuracy metric, detection rate and false positive rate are defined by Accuracy= T P +T N T P +T N+F N+F P, (8) DetectionRate= T P T P +F N, (9) F alseP ositiveRate= F P F P +T N, (10)
where, True Positive (TP) is the number of actual attacks classified as attacks, True Negative (TN) is the number of actual normal records classified as normal ones, False Pos-itive (FP) is the number of actual normal records classified as attacks, and False Negative (FN) is the number of actual attacks classified as normal records.
TheF-measure is a harmonic mean between precisionp and recallr[44]. In other words, it is a statistical technique for examining the accuracy of a system by considering both precision and recall of the system.F-measure used in this paper assigns the same weights to both Precision Rate (PR) and Recall Rate (RR), and is given by (11)
F−measure= 2(P recision∗Recall)
P recision+Recall . (11)
The precision (PR) is the proportion of predicted posi-tives values which are actually positive. The precision value directly affects the performance of the system. A higher value of precision means a lower false positive rate and vice versa. The precision is given by (12).
P recision= T P
T P +F P. (12)
The recall (RR) is another important value for measuring the performance of the detection system and to indicate the proportion of the actual number of positives which are correctly identified. The recall is defined as:
Recall= T P
T P +F N. (13)
5.4 Results and Discussion
The classification performance of the intrusion detection model combined with FMIFS, MIFS (β= 0.3), MIFS (β= 1) and FLCFS and the model using all features based on the three datasets are shown in Table 2 and Figure 2. The results clearly demonstrate that the classification performance of an IDS is enhanced by the feature selection step. In addi-tion, the proposed feature selection algorithm FMIFS shows promising results in terms of low computational cost and high classification results.
Table 2 summarizes the classification results of the dif-ferent selection methods in regard to detection rates, false positive rates and accuracy rates. It shows clearly that the detection model combined with the FMIFS has achieved an accuracy rate of 99.79%, 99.91% and 99.77% for KDD Cup 99, NSL-KDD and Kyoto 2006+, respectively, and significantly
TABLE 2: Performance classification for all attacks based on the three datasets
KDD Cup 99 NSL-KDD Kyoto 2006+
DR F P R Accuracy DR F P R Accuracy DR F P R Accuracy
LSSVM-IDS + FMIFS 99.46 0.13 99.79 98.76 0.28 99.91 99.64 0.13 99.77
LSSVM-IDS + MIFS (β=0.3) 99.38 0.23 99.70 95.96 0.53 97.96 98.59 0.16 99.32
LSSVM-IDS + MIFS (β=1) 89.26 0.34 97.63 93.26 0.47 96.75 98.10 0.58 99.12
LSSVM-IDS + FLCFS 98.47 0.61 98.41 92.29 0.41 96.45 98.07 0.82 98.99
LSSVM-IDS + All features 99.16 0.97 99.19 91.12 0.38 95.96 94.29 0.33 97.42
outperforms all other methods. In addition, the proposed detection model combined with FMIFS enjoys the highest detection rate and the lowest false positive rate in compari-son with other combined detection models.
The proposed feature selection algorithm is computa-tionally efficient when it is applied to the LSSVM-IDS. Fig-ure 2 shows the building (training) and test times consumed by the detection model using FMIFS compared with the detection model using all features. The figure shows that the LSSVM-IDS + FMIFS performs better than LSSVM-IDS with all 41 features on all datasets. There are significant dif-ferences when performing experiments on KDD Cup 99 and NSL-KDD and a slight difference on Kyoto 2006+ dataset by comparison with the two aforementioned models.
1
Fig. 2: Building and testing times of LSSVM-IDS using all features and LSSVM-IDS combined with FMIFS, respec-tively, on three datasets.
5.5 Comparative Study
In order to demonstrate the performance of the LSSVM-IDS + FMIFS, experiments have been conducted to make com-parisons with some state-of-the-art approaches. As men-tioned in Section 4, the KDD Cup 99 is divided into five dif-ferent classes and many experiments have been conducted on DoS, Probe, U2R and R2L attacks. Table 3 shows the selected features for the different attack classes. Tables 4, Table 5 and Table 6 depict the comparison results based on KDD Cup test, NSL-KDDTrain+ and Kyoto 2006+ datasets respectively. The results illustrated in these tables strongly indicate that the proposed detection model shows promis-ing results compared with other models.
Table 4 shows the accuracy percentages achieved by different detection models for the five classes on KDD Cup 99 dataset. Regarding the results obtained by other authors,
TABLE 3: Feature ranking results for the four types of attacks on the KDD Cup 99 dataset
Class # Feature Feature ranking
DoS 12 f23,f5,f3,f6,f32,f24,f12,f2,f37,f36,f8,f31 Probe 19 f5,f27,f3,f35,f40,f37,f33,f17,f41,f30,f34, f28,f22,f4,f24,f25,f19,f32,f29 U2R 23 f37,f17,f8,f18,f16,f1,f4,f15,f7,f22,f20, f21,f31,f19,f12,f13,f14,f6,f32,f29,f3,f40, f2 R2L 15 f3,f15,f5,f10,f9,f32,f33,f22,f1,f17,f24, f11,f23,f8,f6
it can be seen that the proposed approach enjoys the best accuracy among all models in all of the classes.
Table 5 demonstrates the result achieved by LSSVM-IDS + FMIFS compared with other approaches tested on NSL-KDDTrain+ datasets in terms of the detection, false positive and accuracy rate. It is clear that LSSVM-IDS + FMIFS enjoys the best results at 99.94% accuracy, 98.93% detection rate and 0.28% false positive rate.
TABLE 4: Comparison results in terms of accuracy rate with other approaches based on the KDD Cup 99 dataset (n/a means no available results.)
System Normal DoS Probe U2R R2L
LSSVM-IDS + FMIFS 99.79 99.86 99.91 99.97 99.92 SVM with PBR [14] 99.59 99.22 99.38 99.87 99.78
SVM [6] 99.55 99.25 99.70 99.87 99.78
Bayesian Network [15] 98.78 98.95 99.57 48.00 98.93 Flexible Neural Tree [16] 99.19 98.75 98.39 99.70 99.09
SVM + PSO and FS [45] 99.45 n/a n/a n/a n/a
SVM + SA and FS [46] 99.42 n/a n/a n/a n/a
TUIDS [19] 94.76 n/a n/a n/a n/a
Radial SVM [5] n/a 98.94 97.11 97.80 97.78
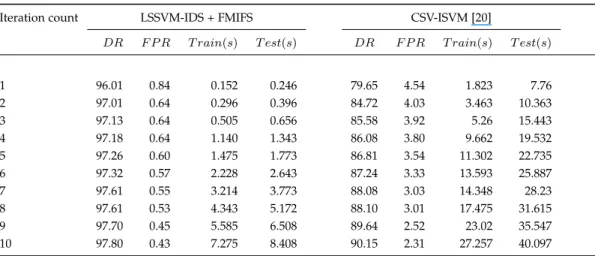
Table 6 shows a comparison with the results achieved by CSV-ISVM proposed in [20] that has been tested on Kyoto 2006+ dataset. Through the results, both systems show continuous improvement in detection rates and reduction in false positive rates. However, the obtained results of the LSSVM-IDS + FMIFS are better, compared to CSV-ISVM in any round of the iterations. The final results achieved by LSSVM-IDS + FMIFS in the 10th iteration show 97.80% and 0.43% of the final detection and false positive rates
TABLE 5: Comparison results based on NSL-KDD dataset (n/a means no available ressults.)
System # Feature DR FPR Accuracy LSSVM-IDS + FMIFS 18 98.93 0.28 99.94
DMNB [47] all n/a 3.0 96.50 DBN-SVM [48] all n/a n/a 92.84 Bi-layer behavioral-based [21] 20 n/a n/a 99.20 TUIDS [19] all 98.88 1.12 96.55 FVBRM [49] 24 n/a n/a 97.78 C4.5 with linear
correlation-based [50] 17
n/a n/a 99.10
PSOM [22] 10 n/a n/a 88.30 HTTP based IDS [23] 13 99.03 1.0 99.38 Hybrid IDS [18] all 99.10 1.2 n/a
respectively, while CSV-ISVM produces 90.15% and 2.31% of the final detection and false positive rates respectively. The training and testing times taken by both systems are also demonstrated in Table 6. Unlike CSV-ISVM, IDS + FMIFS takes much less time. This is because LSSVM-IDS + FMIFS uses a feature selection stage that c an re-duce the number of needed features for the classifier to five features. These features are: {source IP address, service, dst host srv count, destination bytes, src bytes}.
5.6 Additional Comparison
The performance of the LSSVM-IDS model is further com-pared with the PLSSVM model [12], which uses a feature se-lection algorithm based on the mutual information method, named MMIFS. The comparison results shown in Table 7 are based on theCorrected Labelssub-dataset of the KDD 99 dataset. The effectiveness of the two models is compared in three aspects: the accuracy rate, average building time and testing time in minutes.
TABLE 7: Accuracy, building time (min) and testing time (min) for all different classes on the Corrected Labels of the KDD Cup 99 dataset using LSSVM-IDS + FMIFS are compared with those using PLSSVM + MMIFS proposed by Amiri in [12]. Class Name Model Accuracy (%) Building time (min) Testing time (min)
Normal LSSVM-IDS + FMIFS 98.39 7.92 5.51
PLSSVM + MMIFS 99.1 25 11
DoS LSSVM-IDS + FMIFS 98.93 10.06 4.50
PLSSVM + MMIFS 84.11 19 8
Probe LSSVM-IDS + FMIFS 99.57 13.04 8.49
PLSSVM + MMIFS 86.12 35 13
U2R LSSVM-IDS + FMIFS 99.66 0.47 0.32
PLSSVM + MMIFS 99.47 23 10
R2L LSSVM-IDS + FMIFS 90.08 1.06 0.44
PLSSVM + MMIFS 98.70 5 4
Overall LSSVM-IDS + FMIFS 97.33 6.51 3.85
PLSSVM + MMIFS 93.50 21.4 9.20
From Table 7, it can be observed that the proposed system reduces the building time and testing time very considerably for all categories. In addition, with respect to
the accuracy, both models have shown promising results for all classes. It is clear from the table that LSSVM-IDS + FMIFS has better accuracy in DoS, Probe and U2R classes, while the PLSVM + MMIFS produces a better accuracy rate when applied to Normal and R2L class. Moreover, the table shows that LSSVM-IDS + FMIFS outperforms the PLSSVM + MMIFS model in the overall performance.
TABLE 8: Detection rate (%) for different algorithm perfor-mances on the test dataset withCorrected Labelsof KDD Cup 99 dataset (n/a means no available results.)
System Normal DoS Probe U2R R2L Overall
LSSVM-IDS + FMIFS 98.98 98.76 86.08 22.11 88.38 78.86 KDD’99 winner [2] 99.50 97.10 83.30 13.20 8.40 60.3 Kernel Miner [3] 99.42 97.47 84.52 11.84 7.32 60.11 PNrule [51] 99.50 96.90 73.20 6.60 10.70 57.38 SVM IDS [4] 99.3 91.6 36.65 12 22 52.31 Association rule [52] 99.50 96.80 74.90 3.8 7.9 56.58 ESC-IDS [7] 98.20 99.50 84.10 14.10 31.50 65.48 Clustering [17] 99.3 99.5 97.5 19.7 28.8 68.96
TUIDS [19] 90.01 n/a n/a n/a n/a n/a
1
Fig. 3: Comparison results of F−measure rate on the Cor-rected Labelsof KDD Cup 99 dataset
Furthermore, the detection rate of LSSVM-IDS + FMIFS has been compared with some other approaches that have also been tested on the Corrected Labels dataset and the results are shown in Table 8. Through Table 8, compared to the KDD Cup 99 winner’s detection system and other systems, LSSVM-IDS + FMIFS achieves the best detection rates for U2R and R2L attacks with rates of 22.11% and 88.38% respectively. The detection model proposed in [17] provides the best detection rate for the Probe attack of 97.5%. For the normal class, all of KDD Cup 99 winner [2], Association rule [52] and PNrule [51] achieve the best result with 99.50% detection rate. However, overall, LSSVM-IDS + FMIFS has achieved the best detection rate among all systems.
Figure 3 illustrates a comparison between LSSVM-IDS +FMIFS and the other two detection models proposed by Tsang [53] in terms ofF−measure rates. These two methods have applied the genetic-fuzzy rule mining technique to evaluate the importance of IDS features. This figure, makes it obvious that the proposed model outperforms the Tsang models in most of the classes including Normal, DoS, Probe and R2L with 89.31%, 99.27%, 84.16% and 48.13%, respec-tively. MOGFIDS provides the highest result in U2R class
TABLE 6: Comparison performance of classification on the Kyoto 2006+ dataset (the days 2007, Nov. 1,2 and 3)
Iteration count LSSVM-IDS + FMIFS CSV-ISVM [20]
DR F P R T rain(s) T est(s) DR F P R T rain(s) T est(s)
1 96.01 0.84 0.152 0.246 79.65 4.54 1.823 7.76 2 97.01 0.64 0.296 0.396 84.72 4.03 3.463 10.363 3 97.13 0.64 0.505 0.656 85.58 3.92 5.26 15.443 4 97.18 0.64 1.140 1.343 86.08 3.80 9.662 19.532 5 97.26 0.60 1.475 1.773 86.81 3.54 11.302 22.735 6 97.32 0.57 2.228 2.643 87.24 3.33 13.593 25.887 7 97.61 0.55 3.214 3.773 88.08 3.03 14.348 28.23 8 97.61 0.53 4.343 5.172 88.10 3.01 17.475 31.615 9 97.70 0.45 5.585 6.508 89.64 2.52 23.02 35.547 10 97.80 0.43 7.275 8.408 90.15 2.31 27.257 40.097
of 25.09%. Overall, the results of the LSSVM-IDS + FMIFS shown in this figure demonstrate satisfying performance improvements compared with the other two methods.
Figure 4 shows a comparison of the proposed system with those systems proposed in [24], [54] and [55] that have been tested on the KDDTest−21in terms of the classification accuracy. Among those systems, the proposed detection model achieved the best classification accuracy of 94.68%.
1
Fig. 4: Comparison results of classification accuracy on KDDTest−21
After all, the large number of unseen attacks in the above datasets that do not appear in the corresponding training datasets make it even harder for an IDS to detect an attack. For example, in theCorrected Labelsdataset, Bouzida [56] has shown that snmpgetattck and normal records have almost the same features, and this makes it impossible for any IDS to detect this type of attacks.
6
C
ONCLUSIONRecent studies have shown that two main components are essential to build an IDS. They are a robust classification method and an efficient feature selection algorithm. In this paper, a supervised filter-based feature selection algorithm has been proposed, namely Flexible Mutual Information Feature Selection (FMIFS). FMIFS is an improvement over MIFS and MMIFS. FMIFS suggests a modification to Battiti’s algorithm to reduce the redundancy among features. FMIFS eliminates the redundancy parameter β required in MIFS and MMIFS. This is desirable in practice since there is no
specific procedure or guideline to select the best value for this parameter.
FMIFS is then combined with the LSSVM method to build an IDS. LSSVM is a least square version of SVM that works with equality constraints instead of inequality constraints in the formulation designed to solve a set of linear equations for classification problems rather than a quadratic programming problem. The proposed LSSVM-IDS + FMIFS has been evaluated using three well known intrusion detection datasets: KDD Cup 99, NSL-KDD and Kyoto 2006+ datasets. The performance of LSSVM-IDS + FMIFS on KDD Cup test data, KDDTest+ and the data, collected on 1, 2 and 3 November 2007, from Kyoto dataset has exhibited better classification performance in terms of classification accuracy, detection rate, false positive rate and F-measure than some of the existing detection approaches. In addition, the proposed LSSVM-IDS + FMIFS has shown comparable results with other state-of the-art approaches when using the Corrected Labels sub-dateset of the KDD Cup 99 dataset and tested on Normal, DoS, and Probe classes; it outperforms other detection models when tested on U2R and R2L classes. Furthermore, for the experiments on the KDDTest−21dataset, LSSVM-IDS + FMIFS produces the best classification accuracy compared with other de-tection systems tested on the same dataset. Finally, based on the experimental results achieved on all datasets, it can be concluded that the proposed detection system has achieved promising performance in detecting intrusions over computer networks. Overall, LSSVM-IDS + FMIFS has performed the best when compared with the other state-of-the-art models.
Although the proposed feature selection algorithm FMIFS has shown encouraging performance, it could be further enhanced by optimizing the search strategy. In addi-tion, the impact of the unbalanced sample distribution on an IDS needs to be given a careful consideration in our future studies.
R
EFERENCES[1] S. Pontarelli, G. Bianchi, S. Teofili, Traffic-aware design of a high-speed fpga network intrusion detection system, Computers, IEEE Transactions on 62 (11) (2013) 2322–2334.
[2] B. Pfahringer, Winning the kdd99 classification cup: Bagged boost-ing, SIGKDD Explorations 1 (2) (2000) 65–66.
[3] I. Levin, Kdd-99 classifier learning contest: Llsoft’s results overview, SIGKDD explorations 1 (2) (2000) 67–75.
[4] D. S. Kim, J. S. Park, Network-based intrusion detection with support vector machines, in: Information Networking, Vol. 2662, Springer, 2003, pp. 747–756.
[5] A. Chandrasekhar, K. Raghuveer, An effective technique for in-trusion detection using neuro-fuzzy and radial svm classifier, in: Computer Networks & Communications (NetCom), Vol. 131, Springer, 2013, pp. 499–507.
[6] S. Mukkamala, A. H. Sung, A. Abraham, Intrusion detection using an ensemble of intelligent paradigms, Journal of network and computer applications 28 (2) (2005) 167–182.
[7] A. N. Toosi, M. Kahani, A new approach to intrusion detection based on an evolutionary soft computing model using neuro-fuzzy classifiers, Computer communications 30 (10) (2007) 2201– 2212.
[8] Z. Tan, A. Jamdagni, X. He, P. Nanda, L. R. Ping Ren, J. Hu, Detection of denial-of-service attacks based on computer vision techniques, IEEE Transactions on Computers 64 (9) (2015) 2519– 2533.
[9] A. M. Ambusaidi, X. He, P. Nanda, Unsupervised feature se-lection method for intrusion detection system, in: International Conference on Trust, Security and Privacy in Computing and Communications, IEEE, 2015.
[10] A. M. Ambusaidi, X. He, Z. Tan, P. Nanda, L. F. Lu, T. U. Nagar, A novel feature selection approach for intrusion detection data classification, in: International Conference on Trust, Security and Privacy in Computing and Communications, IEEE, 2014, pp. 82– 89.
[11] R. Battiti, Using mutual information for selecting features in super-vised neural net learning, IEEE Transactions on Neural Networks 5 (4) (1994) 537–550.
[12] F. Amiri, M. Rezaei Yousefi, C. Lucas, A. Shakery, N. Yazdani, Mutual information-based feature selection for intrusion detection systems, Journal of Network and Computer Applications 34 (4) (2011) 1184–1199.
[13] A. Abraham, R. Jain, J. Thomas, S. Y. Han, D-scids: Distributed soft computing intrusion detection system, Journal of Network and Computer Applications 30 (1) (2007) 81–98.
[14] S. Mukkamala, A. H. Sung, Significant feature selection using computational intelligent techniques for intrusion detection, in: Advanced Methods for Knowledge Discovery from Complex Data, Springer, 2005, pp. 285–306.
[15] S. Chebrolu, A. Abraham, J. P. Thomas, Feature deduction and ensemble design of intrusion detection systems, Computers & Security 24 (4) (2005) 295–307.
[16] Y. Chen, A. Abraham, B. Yang, Feature selection and classification flexible neural tree, Neurocomputing 70 (1) (2006) 305–313. [17] S.-J. Horng, M.-Y. Su, Y.-H. Chen, T.-W. Kao, R.-J. Chen, J.-L.
Lai, C. D. Perkasa, A novel intrusion detection system based on hierarchical clustering and support vector machines, Expert systems with Applications 38 (1) (2011) 306–313.
[18] G. Kim, S. Lee, S. Kim, A novel hybrid intrusion detection method integrating anomaly detection with misuse detection, Expert Sys-tems with Applications 41 (4) (2014) 1690–1700.
[19] P. Gogoi, M. H. Bhuyan, D. Bhattacharyya, J. K. Kalita, Packet and flow based network intrusion dataset, in: Contemporary Computing, Vol. 306, Springer, 2012, pp. 322–334.
[20] R. Chitrakar, C. Huang, Selection of candidate support vectors in incremental svm for network intrusion detection, Computers & Security 45 (2014) 231–241.
[21] H. F. Eid, M. A. Salama, A. E. Hassanien, T.-h. Kim, Bi-layer behavioral-based feature selection approach for network intrusion classification, in: Security Technology, Vol. 259, Springer, 2011, pp. 195–203.
[22] E. de la Hoz, A. Ortiz, J. Ortega, E. de la Hoz, Network anomaly classification by support vector classifiers ensemble and non-linear projection techniques, in: Hybrid Artificial Intelligent Systems, Vol. 8073, Springer, 2013, pp. 103–111.
[23] M. M. Abd-Eldayem, A proposed http service based ids, Egyptian Informatics Journal 15 (1) (2014) 13–24.
[24] M. Tavallaee, E. Bagheri, W. Lu, A.-A. Ghorbani, A detailed analysis of the kdd cup 99 data set, in: Proceedings of the Second IEEE Symposium on Computational Intelligence for Security and Defence Applications, 2009, pp. 1–6.
[25] J. Song, H. Takakura, Y. Okabe, M. Eto, D. Inoue, K. Nakao, Statistical analysis of honeypot data and building of kyoto 2006+ dataset for nids evaluation, in: Proceedings of the First Workshop on Building Analysis Datasets and Gathering Experience Returns for Security, ACM, 2011, pp. 29–36.
[26] T. M. Cover, J. A. Thomas, Elements of information theory, John Wiley & Sons, 2012.
[27] M. S. Roulston, Estimating the errors on measured entropy and mutual information, Physica D: Nonlinear Phenomena 125 (3) (1999) 285–294.
[28] K. Fukunaga, Introduction to statistical pattern recognition, Aca-demic press, 2013.
[29] Y.-I. Moon, B. Rajagopalan, U. Lall, Estimation of mutual infor-mation using kernel density estimators, Physical Review E 52 (3) (1995) 2318–2321.
[30] H. Peng, F. Long, C. Ding, Feature selection based on mutual information criteria of max-dependency, max-relevance, and min-redundancy, IEEE Transactions on Pattern Analysis and Machine Intelligence 27 (8) (2005) 1226–1238.
[31] T. W. Chow, D. Huang, Estimating optimal feature subsets using efficient estimation of high-dimensional mutual information, IEEE Transactions on Neural Networks 16 (1) (2005) 213–224.
[32] F. Rossi, A. Lendasse, D. Franc¸ois, V. Wertz, M. Verleysen, Mutual information for the selection of relevant variables in spectrometric nonlinear modelling, Chemometrics and intelligent laboratory systems 80 (2) (2006) 215–226.
[33] A. Kraskov, H. St ¨ogbauer, P. Grassberger, Estimating mutual infor-mation, Physical Review E 69 (6) (2004) 066138.
[34] N. Kwak, C.-H. Choi, Input feature selection for classification problems, IEEE Transactions on Neural Networks 13 (1) (2002) 143–159.
[35] P. A. Est´evez, M. Tesmer, C. A. Perez, J. M. Zurada, Normalized mutual information feature selection, IEEE Transactions on Neural Networks 20 (2) (2009) 189–201.
[36] S. Cang, H. Yu, Mutual information based input feature selection for classification problems, Decision Support Systems 54 (1) (2012) 691–698.
[37] W. H. Press, Numerical recipes in Fortran 77: the art of scientific computing, Vol. 1, Cambridge university press, 1992.
[38] C.-W. Hsu, C.-C. Chang, C.-J. Lin, et al., A practical guide to support vector classification (2003).
[39] J. A. Suykens, J. Vandewalle, Least squares support vector machine classifiers, Neural processing letters 9 (3) (1999) 293–300. [40] G.-B. Huang, H. Zhou, X. Ding, R. Zhang, Extreme learning
machine for regression and multiclass classification, IEEE Transac-tions on Systems, Man, and Cybernetics, Part B: Cybernetics 42 (2) (2012) 513–529.
[41] S. J. Stolfo, W. Fan, W. Lee, A. Prodromidis, P. K. Chan, Cost-based modeling for fraud and intrusion detection: Results from the jam project, in: DARPA Information Survivability Conference and Exposition, Vol. 2, IEEE, 2000, pp. 130–144.
[42] R. Rifkin, A. Klautau, In defense of one-vs-all classification, The Journal of Machine Learning Research 5 (2004) 101–141.
[43] C.-F. Tsai, Y.-F. Hsu, C.-Y. Lin, W.-Y. Lin, Intrusion detection by machine learning: A review, Expert Systems with Applications 36 (10) (2009) 11994–12000.
[44] W. B. Croft, D. Metzler, T. Strohman, Search engines: Information retrieval in practice, Addison-Wesley Reading, 2010.
[45] S.-W. Lin, K.-C. Ying, S.-C. Chen, Z.-J. Lee, Particle swarm op-timization for parameter determination and feature selection of support vector machines, Expert Systems with Applications 35 (4) (2008) 1817–1824.
[46] S.-W. Lin, Z.-J. Lee, S.-C. Chen, T.-Y. Tseng, Parameter determina-tion of support vector machine and feature selecdetermina-tion using sim-ulated annealing approach, Applied soft computing 8 (4) (2008) 1505–1512.
[47] M. Panda, A. Abraham, M. R. Patra, Discriminative multinomial naive bayes for network intrusion detection, in: International Conference on Information Assurance and Security (IAS), IEEE, 2010, pp. 5–10.
[48] M. A. Salama, H. F. Eid, R. A. Ramadan, A. Darwish, A. E. Hassanien, Hybrid intelligent intrusion detection scheme, in: Soft Computing in Industrial Applications, Vol. 96, Springer, 2011, pp. 293–303.
[49] S. Mukherjee, N. Sharma, Intrusion detection using naive bayes classifier with feature reduction, Procedia Technology 4 (2012) 119–128.
[50] H. F. Eid, A. E. Hassanien, T.-h. Kim, S. Banerjee, Linear correlation-based feature selection for network intrusion detection model, in: Advances in Security of Information and Communica-tion Networks, Vol. 381, Springer, 2013, pp. 240–248.
[51] R. Agarwal, M. V. Joshiy, Pnrule: A new framework for learning classi er models in data mining (a case-study in network intrusion detection), Citeseer2000.
[52] W. Xuren, H. Famei, X. Rongsheng, Modeling intrusion detection system by discovering association rule in rough set theory frame-work, in: CIMCA-IAWTIC, IEEE, 2006, pp. 24–24.
[53] C.-H. Tsang, S. Kwong, H. Wang, Genetic-fuzzy rule mining ap-proach and evaluation of feature selection techniques for anomaly intrusion detection, Pattern Recognition 40 (9) (2007) 2373–2391. [54] M. Aghamohammadi, M. Analoui, A comparison of support
vec-tor machine and multi-level support vecvec-tor machine on intrusion detection, World of Computer Science and Information Technol-ogy Journal 2 (7) (2012) 215–219.
[55] Q. Liu, J. Yin, V. C. Leung, J.-H. Zhai, Z. Cai, J. Lin, Applying a new localized generalization error model to design neural networks trained with extreme learning machine, Neural Computing and Applications (2014) 1–8.
[56] Y. Bouzida, F. Cuppens, Neural networks vs. decision trees for intrusion detection, in: IEEE/IST Workshop on Monitoring, Attack Detection and Mitigation (MonAM), Tuebingen, Germany, 2006, pp. 28–29.
Mohammed A. Ambusaidiis with the Faculty of Engineering and Information Technology (FEIT) of the University of Technology, Sydney (UTS). His primary research interests include Computer and Network Security and on Pattern Recog-nition techniques for efficient Network Intrusion Detection and anomalous behavior detection.
Xiangjian Heis a Professor of Computer Sci-ence, School of Computing and Communica-tions. He is the leader of Network Security search group, and a Deputy Director of Re-search Centre for Innovation in IT Services and Applications (iNEXT) at the University of Tech-nology, Sydney (UTS). He has been an IEEE Se-nior Member since 2006. He has been awarded Internationally Registered Technology Specialist by International Technology Institute (ITI). His research interests include network security, pat-tern recognition and computer vision.
Priyadarsi Nanda is a Senior Lecturer in the School of Computing and Communications at the University of Technology, Sydney (UTS). He is also a Core Research Member at the Centre for Innovation in IT Services Applications (iN-EXT) at UTS. He is an IEEE Senior Member. His research interests are in network security, work QoS, sensor networks, and wireless net-works. In recent years he has been very active leading the Network Security and Applications research group at UTS. Dr Nanda has over 23 years of research and teaching experience, and has published over 50 research publications.
Zhiyuan Tanreceived his PhD degree from Uni-versity of Technology Sydney (UTS), Australia in 2014. He is a Post-doctoral Research Fellow in the Faculty of Electrical Engineering, Math-ematics and Computer Science, University of Twente, Enschede, Netherlands. He is an IEEE Member. His research interests are network se-curity, pattern recognition, machine learning and distributed systems.
![TABLE 7: Accuracy, building time (min) and testing time (min) for all different classes on the Corrected Labels of the KDD Cup 99 dataset using LSSVM-IDS + FMIFS are compared with those using PLSSVM + MMIFS proposed by Amiri in [12].](https://thumb-us.123doks.com/thumbv2/123dok_us/9907040.2483922/10.918.466.850.256.651/accuracy-building-testing-different-classes-corrected-compared-proposed.webp)