TRENDS IN ORAL ANTI-DIABETIC UTILIZATION AND FACTORS AFFECTING EFFECTIVENESS IN CHILDREN AND YOUNG ADULTS
Mona H. Cai
A dissertation submitted to the faculty at the University of North Carolina at Chapel Hill in partial fulfillment of the requirements for the degree of Doctor of Philosophy in the
Department of Epidemiology in the Gillings School of Global Public Health
Chapel Hill 2016
Approved by: M. Alan Brookhart Cynthia J. Girman Til Stürmer
ABSTRACT
Mona H. Cai: Trends in Oral Anti-Diabetic Utilization and Factors Affecting Effectiveness in Children and Young Adults
(Under the direction of M. Alan Brookhart)
Objectives: Our study quantified the trends in filled oral anti-diabetic (OAD)
prescriptions, predictors of treatment initiation, and factors related to discontinuation and re-initiation among US privately insured children and adolescents from 2001-2012
Methods: Trends in treatment incidence were estimated monthly and stratified by baseline demographics. The cumulative risks of non-persistence at 30-days, 180-days, and 360-days were calculated and predictors of discontinuation were determined using Cox proportional hazards regression. Rates of re-initiation were summarized and predictors were evaluated using case-crossover analysis.
Results: Time trends demonstrated an overall 43% increase in initiation from 2002 to 2012, with a gradual decrease observed beginning early 2008. Initiators were more likely to be females, age 15-18, from the southern region, and have visited a family practitioner prior to initiation. Among initiators, persistence was low and the cumulative risk of
non-persistence at 180 days was 79.0%.
However, 31.4% of patients with extended periods of without drug supply
(OR, 4.1; 95% CI 3.4-5.0), LDL testing (OR 3.8; 95% CI 3.0-4.7), and being diagnosed with a type 2 diabetes complication (OR 3.0; 95% CI 2.2-4.2) were also strongly associated with treatment re-initiation.
“When there’s a will, there’s a way”
Mom and dad, who I have become, what I believe, and my ability to persevere through the most challenging times come from all that you have instilled in me. Thank you for always believing in me and being my anchors in life. To my husband, Jerry, thank you for being my #1 fan and being so supportive as I pursued my PhD. I could not have completed this without
ACKNOWLEDGEMENTS
TABLE OF CONTENTS
CHAPTER 1: REVIEW OF THE LITERATURE ... 1
1.1 Pathophysiology for the development of T2DM ... 1
1.2 The epidemiology of T2DM in youth ... 2
1.3 Risk factors of T2DM in youth ... 4
1.3.1 Obesity ... 6
1.3.2 Genetic factors including family history of T2DM and ethnicity ... 8
1.3.3 Polycystic ovarian syndrome (PCOS) ... 9
1.3.4 Puberty ... 10
1.3.5 Interuterine exposure to hyperglycemia... 10
1.3.6 Additional risk factors: exposure to antidepressants and antipsychotics ... 10
1.4 Clinical presentation and chronic complications of T2DM ... 11
1.5 Treatment guidelines and management of T2DM ... 13
1.5.1 Prevention measures for T2DM in youth ... 14
1.5.2 Monitoring children with T2DM ... 16
1.5.3 Therapeutic options for pediatrics and young adults ... 16
1.6 Clinical and public health relevancy of proposed study ... 18
1.6.1 Trends and predictors of treatment initiation ... 18
1.6.2 Persistence, discontinuation, and re-initiation of therapeutics ... 20
CHAPTER 2: STATEMENT OF SPECIFIC AIMS ... 23
2.1 Aim 1 ... 23
CHAPTER 3: METHODS ... 24
3.1 Study 1 methods: trends and determinants of oral anti-diabetic initiation in youth with suspected type 2 diabetes ... 24
3.1.1 Data source... 24
3.1.2 Patient population ... 24
3.1.3 Predictors of treatment initiation ... 25
3.1.4 Statistical analysis ... 25
3.2 Study 2 methods: persistence and re-initiation following discontinuation of oral anti-diabetic agents in children and adolescents ... 26
3.2.1 Data source... 26
3.2.2 Study population ... 27
3.2.3 Outcome assessment ... 27
3.2.4 Predictors of persistence and reinitiation ... 28
3.2.5 Statistical analysis ... 29
CHAPTER 4: RESULTS ... 30
4.1 Study 1 results: trends and determinants of oral anti-diabetic initiation in youth with suspected type 2 diabetes ... 30
4.1.1 Trends in incidence of use ... 31
4.1.2 Tables and figures ... 32
4.2 Study 2 results: persistence and re-initiation following discontinuation of oral anti-diabetic agents in children and adolescents ... 39
4.2.1 Tables ... 41
CHAPTER 5: DISCUSSION ... 44
5.1 Study 1 discussion: trends and determinants of oral anti-diabetic initiation in youth with suspected type 2 diabetes ... 44
5.2 Study 2 discussion: persistence and re-initiation following discontinuation of oral anti-diabetic agents in children and adolescents ... 48
6.1 Summary of findings ... 54
6.2 Clinical and public health implications ... 56
6.3 Strengths ... 57
6.4 Limitations ... 58
6.4.1 Limitations of Marketscan database ... 58
6.4.2 OAD exposure misclassification... 59
6.4.3 Generalizability ... 60
6.5 Future directions ... 60
APPENDIX ... 62
LIST OF TABLES
LIST OF FIGURES
LIST OF ABBREVIATIONS
AAP: American Academy of Pediatrics ADA: American Diabetes Association BMI: Body Mass Index
CI: Confidence interval
CPT: Current Procedural Terminology DKA: Diabetic Ketoacidosis
HbA1c: Hemoglobin A1C
HHNK: Hyperglycemic Hyperosmolar Nonketotic Syndrome
ICD-9: International Classification of Diseases, 9th Revision, Clinical Modification IGT: Impaired Glucose Tolerance
IFG: Impaired Fasting Glucose IMCL: Intramyocellular Lipid IR: Insulin Resistance
NDC: National Drug Codes
NHANES: National Health and Nutrition Examination OAD: Oral Anti-Diabetic
CHAPTER 1: REVIEW OF THE LITERATURE 1.1 Pathophysiology for the development of T2DM
The biological mechanism for the development of Type 2 diabetes mellitus (T2DM) in children and adolescents is similar to that of adults, where insulin resistance (IR) and insulin secretory defect play the key roles in the progression of this chronic condition. Insulin is a naturally occurring hormone produced by -cells in the pancreas whose primary function is to regulate both carbohydrate and fat metabolism. Carbohydrates are broken down into simple sugars known as glucose that provide energy to the cells in our bodies. Increased blood glucose levels resulting from the ingestion of carbohydrates stimulates the release of insulin which signals cells in the liver, skeletal muscles, and fat tissues to absorb the glucose from the blood stream. Excess glucose is stored in liver and fat cells and released at times when the body is short on glucose (1, 2).
Under normal conditions, glucose levels remain fairly constant through the regulation and balance of insulin secretion by -cells and insulin sensitivity by peripheral tissues. IR occurs when the liver and these peripheral tissues, i.e., muscle, and fat cells, do not respond properly to insulin and cannot readily absorb glucose from the bloodstream, causing
Early detection and treatment of IR, usually with life style modifications, can often prevent or delay T2DM onset. However, this stage is usually asymptomatic and therefore difficult to detect. Adolescents with T2DM have ~50% lower insulin sensitivity and ~75% lower insulin secretion when compared with non-diabetic adolescents matched on BMI and abdominal adiposity (6). Adult T2DM patients display a similar clinical profile, which is unsettling given the overall shorter duration of T2DM in youth compared with their counterparts. 1.2 The epidemiology of T2DM in youth
According to the National Health and Nutrition Examination (NHANES) Survey of 2009-2010, 16.9% of children and adolescents aged 2-19 were obese with a BMI>=95th percentile, demonstrating a doubling in percentage from two decades ago (7). These
percentiles convey a child’s BMI relative to the children in the U.S. who have participated in previous surveys conducted from 1963-65 to 1988-94 (Kuczmarski et al). As obesity in this population continues to rise due to high caloric diets and sedentary lifestyles, the metabolic syndrome and subsequent comorbidities, previously observed predominately in adults, are rapidly increasing as well (8). Metabolic syndrome is a group of medical disorders, i.e. triglycerides, HDL and LDL cholesterol, blood pressure, and fasting plasma glucose over a predefined cut-point or previously diagnosed diabetes, that when occurring together has been suggested to increase the risk of cardiovascular disease and diabetes. Obese adolescents (BMI>=95th percentile) are at a significantly higher risk for developing one or more metabolic syndrome factors compared to those who are overweight (BMI between 85th-95th percentile) and those with normal weight (BMI<85th percentile), 32.1% vs. 7.1% and 32.1% vs. <1%, respectively (9).
hypertension, hyperlipidemia, and T2DM. T2DM and prediabetes are clinically defined as having a fasting blood glucose level >=126 mg/dl and between the 100-125 mg/dl,
respectively (Table 2) (10). In 1995, approximately 17% of all diagnosed diabetes in patients 18 years and younger had T2DM, compared with 2005, where the percentage jumped to ~30%, with a disproportionate burden on ethnic minorities (11). Data on past U.S. incidence of T2DM is scarce, with the majority of estimates extrapolated from small, single clinic-based studies. Assessments from 1982 approximated the incidence for that year to be 0.7 per 100,000 per year (11). More recent estimates have been assessed from SEARCH for
Prevalence rates have been estimated using numerous data sources, but the most generalizable U.S. numbers come from the NHANES surveys. Utilizing both interviews and laboratory tests performed on a random sample of the population, NHANES is able to evaluate point prevalence and the burden of both T2DM and prediabetes on the population. Based on the 2005-2006 NHANES survey, prevalence was low at a projected 0.2% amongst those aged 12-19; however, the prevalence of impaired glucose tolerance (IGT) and impaired fasting glucose (IFG), which are clinical indictors of prediabetes, was significantly higher at an estimated 16.1% (95% CI: 11.3-21.2%) (13). This is more than double the rate from the 1999-2000 survey where the prevalence of prediabetes was 7.0% (95% CI: 4.6-9.4%) (14). It is estimated that approximately 25% of those with prediabetes who neglect proper
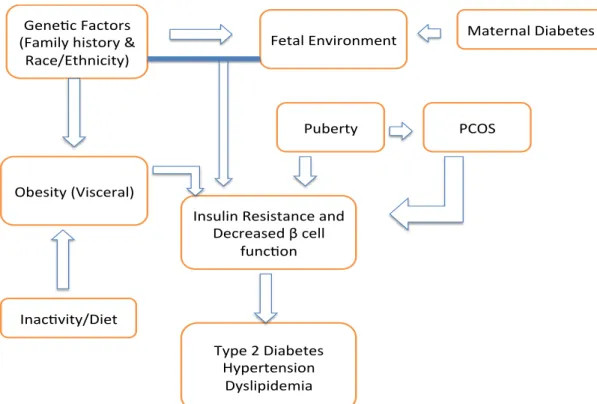
management and treatment will progress to T2DM within 3 years (15). 1.3 Risk factors of T2DM in youth
Figure 1. Risk factors involved in insulin resistance and T2DM development Gene c Factors
(Family history & Race/Ethnicity)
Obesity (Visceral)
Insulin Resistance and Decreased β cell
func on
Inac vity/Diet
Puberty PCOS
Fetal Environment Maternal Diabetes
Type 2 Diabetes Hypertension
1.3.1 Obesity
The prevalence of IR amongst obese adolescents is 52%, making obesity the strongest risk factor related to T2DM. Obesity accounts for over 55% of the variance in insulin
sensitivity and 29.1% of the variance in homeostasis assessment models for IR (17). Abdominal obesity, i.e. visceral adiposity, and intramyocellar lipid deposition (IMCL) are the specific culprits involved in T2DM development amongst obese individuals (3). Studies have shown that the amount of lipid deposition in the visceral adipose tissue is most predictive of the risk for IR compared with fat accumulation in other regions, i.e.
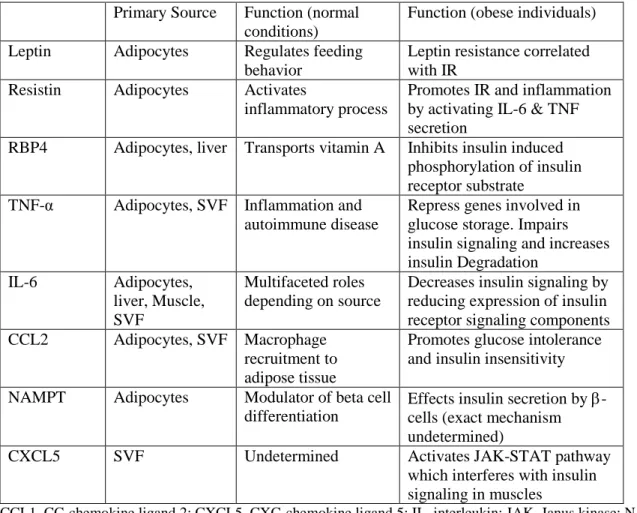
subcutaneous, epicardial, pulmonary, periadventitial, perirenal, and bone marrow adipose tissues (16, 18, 19). Adipose tissue is a complex endocrine organ responsible for storing energy and regulating metabolic function in the body (18). Energy in the form of fat is stored in adipocytes while the rest of the adipose tissue is referred to as the stromal vascular
fraction. This component includes monocytes, macrophages, vascular cells, pre-adipocytes, T-cells, and mesenchymal stem cells (18). Adipose tissue responds to signals from hormones and the central nervous system, and secretes numerous anti-inflammatory and
Table 1. Sources and function of Adipokines involved in insulin resistance (1, 18)
Primary Source Function (normal
conditions)
Function (obese individuals)
Leptin Adipocytes Regulates feeding
behavior
Leptin resistance correlated with IR
Resistin Adipocytes Activates
inflammatory process
Promotes IR and inflammation by activating IL-6 & TNF secretion
RBP4 Adipocytes, liver Transports vitamin A Inhibits insulin induced
phosphorylation of insulin receptor substrate
TNF-α Adipocytes, SVF Inflammation and
autoimmune disease
Repress genes involved in glucose storage. Impairs insulin signaling and increases insulin Degradation
IL-6 Adipocytes,
liver, Muscle, SVF
Multifaceted roles depending on source
Decreases insulin signaling by reducing expression of insulin receptor signaling components
CCL2 Adipocytes, SVF Macrophage
recruitment to adipose tissue
Promotes glucose intolerance and insulin insensitivity
NAMPT Adipocytes Modulator of beta cell
differentiation
Effects insulin secretion by -cells (exact mechanism undetermined)
CXCL5 SVF Undetermined Activates JAK-STAT pathway
which interferes with insulin signaling in muscles
The fact that not all obese youth go on to develop IR and T2DM suggests that there are additional components implicated aside from visceral adiposity. Increasingly more evidence is supporting the role of intramyocellular lipid (IMCL) deposition on insulin sensitivity. IMCL are fats stored in muscle cells, also referred to as myocytes, which provide energy during times of muscle exertion. Circulating free fatty acids (FFA) are directed into the muscles when needed and stored as triglycerides in myocytes during rest. Diets high in FFA can overtime raise IMCL volume through fat accumulation. Depending on the duration of high-fat diet and baseline IMCL, IMCL content can increase by 36-90% through the influence of high-fat diets (20). FFA derivatives collected in the IMCL are believed to interrupt insulin signal transduction pathways, which lead to malfunctions in glucose uptake (21). Although there are rare cases where lean individuals with high IMCL content develop T2DM, suggesting IMCL is an independent risk factor for the condition, most data
demonstrate a direct association between IMCL and visceral adiposity. Brumbaugh et al. examined the correlation between IMCL and visceral adiposity among prepubertal and pubertal children. Their results were consistent amongst both age groups and showed that for every 10-cm2 increase in visceral adiposity, IMCL increased by 0.19 units (22).
1.3.2 Genetic factors including family history of T2DM and ethnicity
There is compelling evidence indicating a genetic component in T2DM where family history and ethnicity are both established independent predictors of IR and T2DM.
Approximately 45-80% of youth with T2DM have at least one parent with DM and 74-100% have a first- or second- degree relative with T2DM (23). Family history of T2DM is
24). First-degree relatives of T2DM patients have a lifetime risk of 40% for developing T2DM (23). Adult studies that have examined the heritability of traits involved in T2DM onset reported that insulin secretion is more familial than insulin sensitivity (25).
Ethnic minorities have a disproportionate amount of T2DM burden, which signifies a strong predisposition in these populations to develop this chronic condition. A combination of genetic and lifestyle factors have led to a higher prevalence amongst Pima Indians, Native Americans, and African-Americans. Epidemiologic and clinical evidence have established a higher risk of developing T2DM in black and Hispanic children compared to their white counterparts as well as clinical indicators of higher insulin resistance and lower insulin sensitivity (2).
1.3.3 Polycystic ovarian syndrome (PCOS)
PCOS is a common endocrine disorder involving women of the reproductive age with subclinical symptoms including chronic anovulation and hyperandrogenism, and is the leading cause of oligoolvulatory infertility (2). This syndrome affects, depending on
diagnostic criteria, anywhere between 5 to 15% of women, with rapid growth rates observed in obese adolescent females (26). The metabolic profile for PCOS suggests an association with insulin resistance and hyperinsulinemia, making PCOS a strong risk factor for T2DM. Adolescents with PCOS have ~50% lower insulin sensitivity and 33% more cases of
1.3.4 Puberty
Growth hormones, which are commonly but transiently secreted during puberty, have been linked with hyperinsulinemia and IR. Insulin-like growth factor-I (IGF-I) levels have been illustrated by longitudinal studies to explain ~35% of the variance in insulin sensitivity (30). In normal weight, healthy adolescents, insulin sensitivity was observed to decrease by 50% but was balanced off by a two-fold increase in insulin secretion. This leads to clinical manifestations of hyperinsulinemia; however, overall glucose homeostasis is achieved in most adolescents. Conversely, the natural physiologic occurrence of IR during puberty may precipitate T2DM among those who are more susceptible to the condition.
1.3.5 Interuterine exposure to hyperglycemia
Numerous studies have demonstrated a direct association between maternal DM during pregnancy and obesity in offspring throughout childhood and young adulthood. This relationship was further strengthened when comparing a mother’s offspring conceived before versus after maternal DM progression, indicatingdifferences in BMI and obesity status in the children (31). A prospective cohort following offspring of diabetic mothers observed that by the age of 12 there was an almost ten-fold higher prevalence of IGT amongst these offspring compared with age- and sex-matched controls (19.3 vs. 2.5%, respectively) (32).
1.3.6 Additional risk factors: exposure to antidepressants and antipsychotics The therapeutics used in the treatment of depression and psychoses and their association with obesity and T2DM have been heavily studied (33, 34). Part of the
months of follow-up) (34). Second generation atypical antipsychotics, commonly used in the treatment of schizophrenia and bi-polar disorder, can increase a person’s risk for T2DM through body weight gain and biological mechanisms that alter insulin secretion regulation (33). Many patients on atypical antipsychotics are also prescribed Metformin to
counterbalance the side effects of such drugs.
1.4 Clinical presentation and chronic complications of T2DM
(36). HHNK occurs in the absence of DKA and is characterized by high blood glucose and high serum osmolality. When circulating blood becomes highly concentrated with glucose and salt, water is drawn out of organs through the process of osmosis and can result in detrimental effects such as coma or death (37). Results from a single center study including newly diagnosed T2DM youth reported a HHNK prevalence of 3.7% (38); in another study, the case-fatality rate for HHNK was estimated at 37% among HHNK patients with a mean age of 15 years old (39).
these rates were compared with those from the adult-onset diabetes cohort, rates were non-significant for nephropathy and statistically non-significantly lower for retinopathy, highlighting the seriousness of childhood-onset diabetes. Although T2DM in youth is a relatively new epidemic, as these children progress into early adult-hood, complications and severity of these conditions will present themselves earlier in life compared to what practitioners are familiar with, leading to unforeseeable public health challenges.
1.5 Treatment guidelines and management of T2DM
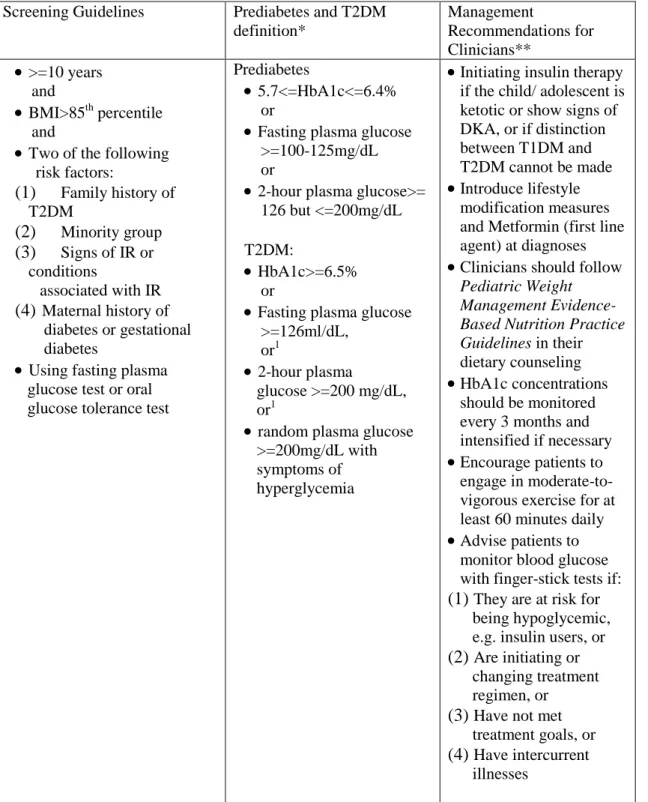
The first guidelines pertaining to the screening and treatment of T2DM specifically in children and young adults were released in 2000 by the American Diabetes Association (ADA) (39). The ADA and American Academy of Pediatrics (AAP), based on the latest evidence from the scientific community, updated the management guidelines in early 2013. The diagnosis criteria for T2DM have remained unchanged from adults but screening and treatment recommendations have gone through minor revisions.
practicing physicians treating these children do not find these guidelines adequate in identifying high-risk individuals.
1.5.1 Prevention measures for T2DM in youth
Methods targeting T2DM prevention have been directed at many stages of disease progression. Primordial prevention occurs prior to the manifestation of risk factors and encompasses measures to prevent obesity usually through diet, exercise, and behavior modifications. Due to the accumulation of a variety of factors in the past 30 years, including high caloric diets and reduced physical activity attributable to the increasing popularity of TV and video games, this mode of prevention has proven to be highly difficult to instill. Countless interventions aiming at various facets of primary prevention have been undertaken in recent years focusing on both schools systems and parental education. Evidence from a meta-analysis of randomized controlled trials (RCTs) targeting lifestyle and drug
Table 2. Guidelines for Diagnosis and Management of T2DM in Youth (2, 10, 39)
Screening Guidelines Prediabetes and T2DM
definition*
Management
Recommendations for Clinicians**
>=10 years and
BMI>85th percentile and
Two of the following
risk factors:
(1) Family history of
T2DM
(2) Minority group
(3) Signs of IR or
conditions
associated with IR
(4) Maternal history of
diabetes or gestational diabetes
Using fasting plasma
glucose test or oral glucose tolerance test
Prediabetes
5.7<=HbA1c<=6.4%
or
Fasting plasma glucose
>=100-125mg/dL or
2-hour plasma glucose>=
126 but <=200mg/dL
T2DM:
HbA1c>=6.5%
or
Fasting plasma glucose
>=126ml/dL, or1
2-hour plasma
glucose >=200 mg/dL, or1
random plasma glucose
>=200mg/dL with symptoms of hyperglycemia
Initiating insulin therapy
if the child/ adolescent is ketotic or show signs of DKA, or if distinction between T1DM and T2DM cannot be made
Introduce lifestyle
modification measures and Metformin (first line agent) at diagnoses
Clinicians should follow
Pediatric Weight Management Evidence-Based Nutrition Practice Guidelines in their dietary counseling
HbA1c concentrations
should be monitored every 3 months and intensified if necessary
Encourage patients to
engage in moderate-to-vigorous exercise for at least 60 minutes daily
Advise patients to
monitor blood glucose with finger-stick tests if: (1) They are at risk for being hypoglycemic, e.g. insulin users, or (2) Are initiating or
changing treatment regimen, or
(3) Have not met
treatment goals, or (4) Have intercurrent
illnesses
*Updated in 2004, definition applies to youth and adults **Updated in 2013, management specific for youth with T2DM
1.5.2 Monitoring children with T2DM
Diligent glucose monitoring is an imperative step in proper diabetes management and control, most frequently performed with glucose meters and blood samples from a
fingerstick. Fasting, 2-hour, and random plasma glucose tests as well as Hemoglobin A1C (HbA1c) tests can all be used to assess glucose levels. Fasting plasma glucose test is conducted after at least 8 hours of fasting and is both easy to administer and cost effective, making it the preferred screening test recommended by the ADA. However, it is often difficult to ask a child to fast for 8 hours so HbA1c tests are often used as well both for screening and long-term monitoring. Properties of HbA1c make it the ideal blood test for long-term assessments of glycemic control. HbA1c is formed through the glycosylation of hemoglobin exposed to plasma glucose, and its rate of binding is proportional to the level of circulating blood glucose concentrations. This detail allows HbA1c to serve as a meaningful proxy for average blood glucose levels over prolonged periods, especially over the last 3 months, of time (2).
1.5.3 Therapeutic options for pediatrics and young adults
Metformin was approved in December 2000 for use in pediatric patients 10 years of age and older with T2DM. The drug is part of the biguanide family, one of five families of oral antidiabetic (OAD) agents on the market today in the United States (Figure 2), and acts by decreasing insulin secretion in hepatic tissues and increasing insulin sensitivity in
peripheral tissues (47). Metformin has also demonstrated itself effective in other areas of the metabolic syndrome including lowering of circulating free fatty acid concentrations,
decreasing plasma triglycerides and LDL levels, and increasing HDL levels (47). Its
mechanism of action includes the activation of adenosine monophosphate (AMP) –activated protein kinase pathway (AMPK), which results in decreased production of glucose and increased fatty acid oxidation in liver and skeletal muscles (28).
One of the first and largest pediatric clinical trials of metformin was conducted on 82 subjects aged 10-16 years for up to 16 weeks of follow-up. At the end of 16 weeks, placebo recipients had increased their mean FPG by 20mg/dl while metformin users had decreased their mean FPG by 44mg/dl, with average HbA1c levels of 8.6% vs. 7.5%, respectively (48). Common adverse effects are gastrointestinal related and include abdominal discomfort, upset stomach, nausea, indigestion, heartburn, and/or diarrhea. Effects are usually mild to
and studies of large pharmacy databases have revealed that up to 30% of youth treated with an OAD were treated with other OADs, including sulfonylureas, thiazolidinediones, and meglitinide (49-51).
Aside from its use in T2DM treatment, metformin has also been studied adjunctively with insulin in adolescents with T1DM (52, 53). Based on two placebo-controlled RCTs with small sample sizes (n<27) and 3-months of follow-up, metformin combined with insulin yielded improved glycemic control in some patients. The evaluation of long-term benefits and safety of adjunctive therapy in T1DM patients is warranted before endocrinologists begin utilizing this treatment option.
1.6 Clinical and public health relevancy of proposed study
The diagnosis and treatment of T2DM in children and adolescents has advanced in recent years in response to the rapid growth of T2DM in this population; however, the literature has not kept up with this ever-evolving field.
1.6.1 Trends and predictors of treatment initiation
Trends in oral anti-diabetic (OAD) initiation and utilization in youth have changed as a reflection of the growing number of T2DM cases in this population as well as
advancements in treatment practices and guidelines. Understanding the patterns in prescription rates and recognizing who is being treated will help form the basis of
consistent and illustrated an approximate doubling in overall prevalence, peaking at 0.6 (54) and 0.5 per 1,000 child (51), respectively, at the end of each corresponding study period.
The proposed research will improve upon the current state of knowledge by (1) increasing the study window to ten years (2001-2011) to provide an accurate and up-to-date depiction by year, (2) assessing incidence of OAD prescriptions, (3) performing time trend analyses, (4) setting more rigorous exclusion criteria to ensure all results are specific to the T2DM population, and (5) examining additional factors that could influence prescribing habits. Incidence estimates will provide useful data on the number of new users of OADs per year. Statistical time trend analyses are missing in the current literature but are valuable in that they demonstrate the extent for which the perceived changes in trends are based on chance alone. Also absent in the literature are assessments for variables that potentially influence prescribing patterns. Phan et al. utilized National Ambulatory Medical Care Survey (NAMCS) data from the years 1996-2005 to describe physician specialty, insurance type, and demographic factors in T2DM adolescent patients visiting outpatient clinics. Their study did not attempt to differentiate between treated and untreated T2DM individuals, making it difficult to evaluate prescribing paradigms. Cox and Liberman et al. reported sub-group specific rates for gender and age whose combined data spanned the years 2002-2007, but failed to examine other meaningful variables. Our study will consider additional factors including comorbidities, common diagnoses codes, concomitant medication use,
1.6.2 Persistence, discontinuation, and re-initiation of therapeutics
Medical adherence (i.e. compliance) is defined as the extent for which a patient follows the therapeutic regimen (medication or lifestyle modifications) prescribed by his or her health care provider. Another term related to medication use is persistence, which is defined as the duration of time from drug initiation to discontinuation of therapy, allowing for a permissible gap between refills. Consequences of nonadherence can manifest in a multitude of ways and affect the health of an individual and communities (55). Adherence to OADs has been extensively investigated in adults. A recent meta-analysis of such studies determined that 58% of adult patients taking an OAD had a 12-month medication possession ratio (MPR) > 80% (56). Pediatric literature on compliance is scarce and usually based on small samples of patients (n<100) but results consistently indicate low adherence in this group. Prospective studies and clinical trials persistently suffer from high attrition rates (~20-60%) and poor glycemic control amongst those who remained in the study (57, 58),
indicating how difficult it is to implement medication in this population. The lack of appreciation for the long-term implications of ineffective management of T2DM, socioeconomic factors, and treatment complications have been linked to non-adherence amongst all age groups (56). Other factors unique to adolescents such as hormonal changes complicating glycemic management and mental and emotional challenges faced by pediatrics transitioning into early adulthood have also been shown to influence compliance in this population (59).
Self-reported adherence data from small, single-center studies have demonstrated adherence to be the strongest predictor of glycemic control and HbA1c levels in youth
adequately manage glycemic levels and delay and/or avoid diabetes complications in this population. Only one study was identified which examined adherence and persistence to OADs in pediatrics. The study population was drawn from Texas Medicaid data and mean Medication Possession Ratio (MPR) was used as a proxy for adherence (62). They
concluded after one-year follow-up that adherence and persistence was suboptimal (MPR mean, SD: 45%, 27%) and differed by gender, race, and age, and acknowledged lack of generalizability to be a major limitation given the fact that Texas Medicaid is comprised predominately of minority races and those of low socioeconomic status (SES). Similarly, in the treated adult T2DM population, low persistence is notably common with rates fluctuating between 36 and 79% (63, 64). However, studies in adult populations have demonstrated high reinitiation rates of OADs, which emphasizes the dynamic use of OADs in populations (64, 65). To our knowledge, the rates of reinitiation and factors predicting such occurrences have yet to be explored.
The proposed research will focus on enhancing the understanding of persistence and factors prompting patients to reinitiate therapy in a population of pediatric T2DM patients. It will examine a more diverse population than the Texas Medicaid study and include an extensive list of potential predictors of persistence - demographic characteristics, healthcare utilization variables, and concomitant medications. These medications include a combination of drugs targeting metabolic syndrome (antihypertensives, statins, fibric acid derivations) and drugs that are linked with obesity and T2DM onset (antipsychotics, antidepressants) (66, 67).
CHAPTER 2: STATEMENT OF SPECIFIC AIMS
2.1 Aim 1: To describe time trends and identify predictors of treatment initiation for youth treated for T2DM. We will examine overall incidence of treatment of T2DM and incidence stratified by drug class, physician specialty, age group, geographic region, and gender. Hypothesis: We anticipate increasing use of oral antidiabetics over time and increasing use among primary care pediatricians.
Rationale: Previous studies have assessed period prevalence but none have studied the rates of new users, or characteristics of these new users. It is important for clinicians and
researchers to understand the characteristics of patients who are starting treatment and how that has changed over time in order to better treat this patient population.
2.2 Aim 2: To describe rates of oral antidiabetic medication persistence using prescription refill data, overall and compared within clinically relevant subgroups. Furthermore, to assess rates of re-initiation among patients with extended periods of non-adherence and to determine factors predicting re-initiation.
Hypothesis: Overall persistence will be low with levels depending on patient characteristics and drug class. Rates of re-initiation will be moderate with increased follow-up being a strong predictor of restarting therapy.
CHAPTER 3: METHODS
3.1 Study 1 methods: trends and determinants of oral anti-diabetic initiation in youth with suspected type 2 diabetes
3.1.1 Data source
Using the Marketscan™ Research Database, we studied a population of youth enrolled in an employer-provided private insurance plan between the years 2001 to 2012. Marketscan is comprised of a large and diverse sample of the U.S. commercially insured population and contains comprehensive individual-level records on patient demographics, enrollment information, inpatient, outpatient, and prescription drug claims (68). In 2012, the database included approximately 5.5 million youth aged 6-17, equivalent to 10% of the overall population and 20% of the commercially insured population in the US for that age group (69, 70).
3.1.2 Patient population
excluded from the study population: type 1 diabetes (ICD-9: 250.x1, 250.x3), gestational diabetes (ICD-9: 648.8), and females with polycystic ovarian syndrome (PCOS) (ICD-9: 256.4. Furthermore, females with diagnosis codes for symptoms of PCOS including hirsutism (ICD-9: 704.1) and ovarian cysts (ICD-9 620.0 and 620.2) were also excluded. 3.1.3 Predictors of treatment initiation
Potential predictors of treatment initiation were determined at baseline and included age (age groups: 8-10, 11-14, and 15-18), gender, the U.S geographic region (Northeast, North Central, South, and West) that the patient resided in, and physician specialty (family practice, pediatrician, both, and other). The defined age categories considered that young children are off-label users, and early teen versus late-teen initiation rates may vary as T2DM disproportionately affects late-teens, e.g. 15-19 year olds (71). Physician specialty was categorized based on those who had at least one visit to a pediatrician, family practitioner (FP), both a pediatrician and FP, and specialties other than pediatrician and FP in the three-months prior to their index date. Analyses utilizing a six-month physician visit window were also performed to evaluate the impact of the pre-defined window on study results. All other predictors were pre-categorized in the Marketscan database.
3.1.4 Statistical analysis
Treatment incidence among children and adolescents initiating OAD therapy was estimated monthly from January 1, 2002 through December 31, 2012. Rates for each month of the study period were calculated by dividing the number of eligible patients with an index date falling in that month by the total number of youth who would have been in the
Descriptive analyses included mean monthly frequencies for baseline characteristics, reported separately for the general denominator and the new user populations, and mean monthly incidences. Mean monthly incidences and 95% CIs were calculated per 100,000 youth per month and were reported for the entire population as well as by explanatory variables. In order to evaluate the strength of a priori identified predictors, mean monthly relative risks (RR) and 95% CIs were calculated and assessed over calendar time. Trends in prescription rates, smoothed using local polynomial regression (72), were graphed along with 95% confidence intervals (CIs) monthly for the overall population as well as for each
predictor subgroup. The graph by physician specialty included plots for the subgroups of patients who only visited either a pediatrician or FP in the 3-months prior to their index date. All analyses reported monthly means for the calendar periods of 2002-2012, 2002-2003, 2004-2005, 2006-2007, 2008-2009, and 2010-2012.
3.2 Study 2 methods: persistence and re-initiation following discontinuation of oral anti-diabetic agents in children and adolescents
3.2.1 Data source
3.2.2 Study population
Patients included in the present study were aged 8-18 years who were newly initiated on a therapy from any class of OADs (metformin, sulfonylureas, thiazolidinediones, alpha-glucosidase inhibitors, meglitinide analogs, and dipeptidyl peptidase-4 inhibitors) during the period of January 2002-Decemeber 2012. New users were identified based on the following criterion: (1) patients had ≥12-months of continuous enrollment prior to their OAD drug fill date, hereon referred to as their “index drug” date and (2) patients without an OAD
medication in the 12-months prior to their index drug date. Youth with any of the following diagnoses at baseline, as indicated by International Classification of Diseases, Ninth
Revision, Clinical Modification (ICD-9) codes associated with inpatient or outpatient claims, were excluded from the study population: type 1 diabetes (ICD-9: 250.x1, 250.x3),
gestational diabetes (ICD-9: 648.8), and females with polycystic ovarian syndrome (PCOS) (ICD-9: 256.4. Furthermore, females with diagnosis codes for symptoms of PCOS including hirsutism (ICD-9: 704.1) and ovarian cysts (ICD-9 620.0 and 620.2) were also excluded. 3.2.3 Outcome assessment
From the database, we created a drug coverage file for all identified new users by linking their filled OAD prescriptions from their index date to their last fill date or the end of their enrollment period or December 2012 (administrative end to follow-up), whichever came first. Using the dispensing dates and days’ supply corresponding with each prescription, we attempted to identify periods of continuous use and discontinuation.
days or more without any filled OAD prescriptions after stopping therapy were considered discontinuators. In other words, patients were considered persistent until they had a
discontinuation event. Reinitiation was defined as filling at least one prescription for any OAD following a period of discontinuation.
3.2.4 Predictors of persistence and reinitiation
Potential predictors of persistence were determined at study baseline and included age (age groups: 8-12, 13-15, and 16-18), gender, copayment costs of the index OAD agent ($0, $1-5, $6-10, $11-15, and >$15), and the specialty of the treating physician (family practice and pediatrician). The pre-defined age categories considered that younger children and adolescent persistence may be influenced by very different factors as younger children are generally affected by parental motivation (73) while adolescents’ persistence is influenced more by their experienced mental and emotional challenges (59). Copay categories were established a priori but were confirmed after assessing the quintiles of the copay variable from the data. Physician specialty was assessed among those who had at least one visit to a pediatrician, a family practitioner (FP), both specialties, or other specialties in the three-months prior to their index date.
We focused on modifiable factors to assess as potential predictors of reinitiation after a period of discontinuation. This included the following procedures specified by Current Procedural Terminology (CPT) codes: outpatient medical encounters (CPT: 99201-99205, 99211-99215), LDL tests (CPT: 80061, 83700, 83701, 83704 83721), and HbA1c and related glucose monitoring tests (CPT: 83036, 83037, 82962, 82948, 82950, 82947). In addition, the following T2DM complications regarded as clinical manifestations of disease progression were also considered: hypertension (ICD-9: 401.9), hyperlipidemia (ICD-9: 272.4),
(ICD-9: 783.5), and hyperosmolar hyperglycemic state (ICD-9: 250.2). Dual occurrences of T2DM complications and medical encounters, LDL testing and medical encounters, and HbA1c testing and medical encounters were considered as well.
3.2.5 Statistical analysis
Descriptive and univariate analyses of baseline characteristics for incident OAD users were summarized. Three binary variables were created to flag the frequency of patients who were non-persistent at (1) 30-days, (2) 180-days, and (3) 360-days, allowing for a 90-day gap, and were assessed based on cumulative risks for the overall cohort and by the aforementioned predictors of persistence. Additional sensitivity analyses were conducted using different permissible gaps including a 30-day and 60-day gap. Cox proportional hazards regression models were used to approximate unadjusted hazard ratios (HR) of discontinuation by day 360 for potential predictors.
Patients who discontinued for 90 days or more and subsequently reinitiated therapy were identified. We performed a case-crossover analysis on identified reinitiators by
CHAPTER 4: RESULTS
4.1 Study 1 results: trends and determinants of oral anti-diabetic initiation in youth with suspected type 2 diabetes
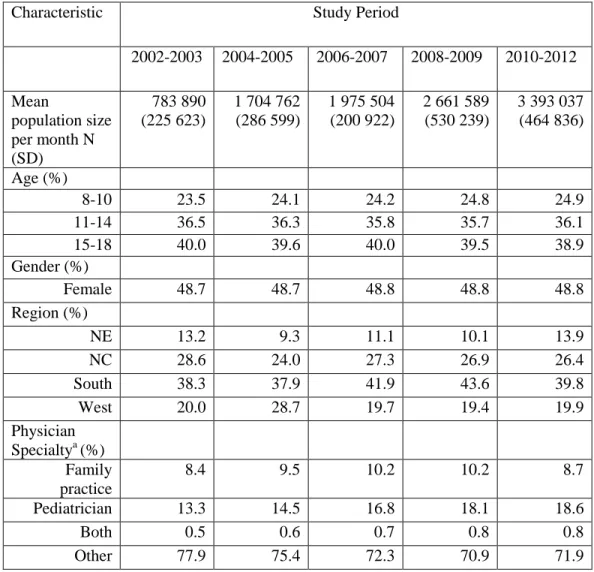
The average monthly population size increased 6-fold over the course of the study period (Table 1) as the Marketscan Research Database increased in size over that time from 700,000 to over 4 million individuals, with a median population size of 2.2 million.
Frequency distributions in age, sex, and geographic region remained consistent in the
population sample throughout the study period, while minor variations in physician specialty encounters were recorded, signifying a small increase in primary care utilization by this population (Table 1).
A total of 13,824 new users of any OAD prescriptions were identified between 2002 and 2012 (Table 2). Baseline characteristics of OAD initiators fluctuated slightly over the years as the percentage of females, 8-10 year olds, and patients from southern region
The overall monthly incidence in the population was 4.6 (95% CI=3.6, 5.5) per 100,000 youths (Table 3). Patients who initiated treatment were more likely to be females (RR=2.57; 95% CI=1.59, 4.39), age 15 to 18 (8-10 years, RR=4.74; 95% CI=2.04, 13.60; 11-14 years, RR =1.69; 95% CI=1.03, 2.90), and residents of the southern region (Northeast, RR=1.91; 95% CI=0.77, 6.02); North Central, RR=1.22; 95% CI=0.70, 2.31; West, RR=1.72; 95% CI=0.88, 3.85). They were also twice as likely to have visited a family practitioner, compared to a general pediatrician, in the 3-months prior to OAD initiation (RR=2.00; 95% CI=1.02, 5.02).
4.1.1 Trends in incidence of use
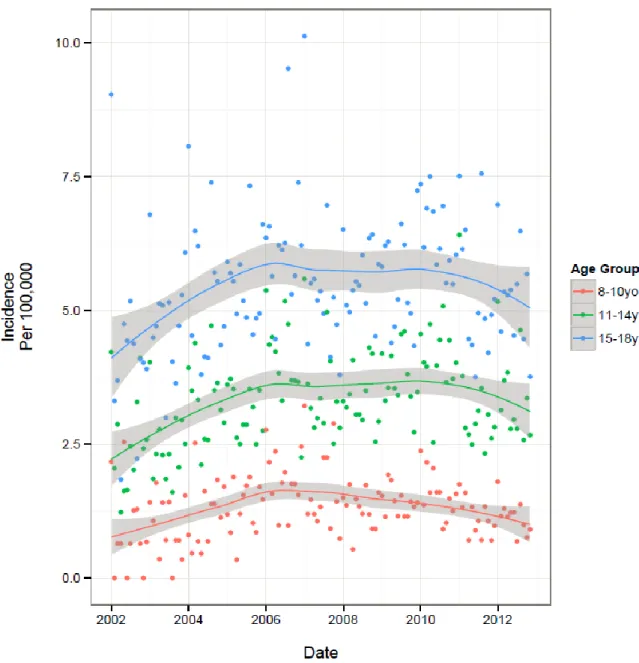
The temporal trends in overall and subgroup specific monthly incidence rates are presented in Table 3 and visually depicted in figures 1-4. Fig. 1 illustrates an increase in overall incidence between years 2002 (3.0 per 100,000 youth) to early 2008 (5.3 per 100,000), before gradually declining during the remainder of the study period (4.3 per 100,000 in 2012), suggesting a corresponding 43% increase in new users over the course of 11 years. This pattern was also reflected consistently in all age group specific trends (Fig. 2) and to a lesser extent, the regional trends. Gender-specific initiation rates over time
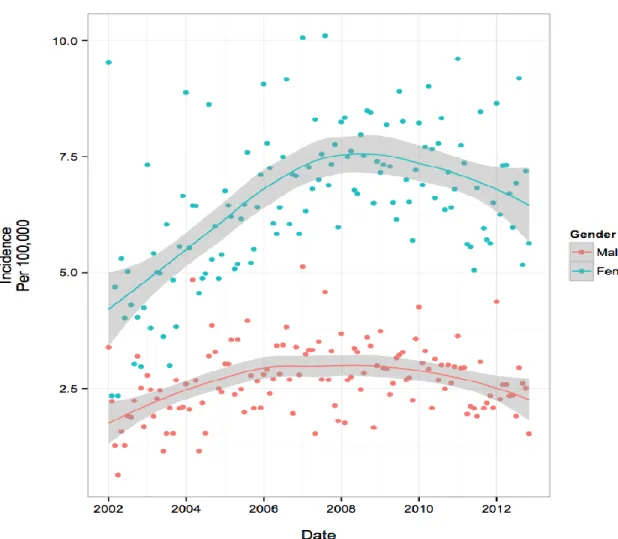
illustrated differences in temporal trends between male and female patients (Fig. 3). Female incidence increased by 45% between 2002 to early 2008 before experiencing a 12% decrease for the remainder of the study period. Overall, the female population underwent a 62% increase in usage over 11-years. The male population experienced their peak in incidence 2-years earlier than females in 2006 where rates increased by 67% from 2002. Their overall increase during the study period was 28%, demonstrating a lesser increase compared to their female counterparts. At all timepoints, individuals with visits to a FP physician were
general pediatrician (Fig. 4). Individual trends show an 89% increase in FP prescriptions from 2002 to mid-2009 and then dropping by 11% during the remainder of the study. Pediatrician trends suggest a 95% increase in prescriptions from 2002 to early 2007, before experiencing a 14% drop over the course of the remaining 5-years of the study period. Overall, FPs and pediatricians experienced similar percent increases in prescriptions over the duration of the study, 67% and 68%, respectively.
4.1.2 Tables and figures
Table 3. Beneficiary Baseline Characteristics by Study Period
Characteristic Study Period
2002-2003 2004-2005 2006-2007 2008-2009 2010-2012
Mean
population size per month N (SD)
783 890 (225 623)
1 704 762 (286 599)
1 975 504 (200 922)
2 661 589 (530 239)
3 393 037 (464 836)
Age (%)
8-10 23.5 24.1 24.2 24.8 24.9
11-14 36.5 36.3 35.8 35.7 36.1
15-18 40.0 39.6 40.0 39.5 38.9
Gender (%)
Female 48.7 48.7 48.8 48.8 48.8
Region (%)
NE 13.2 9.3 11.1 10.1 13.9
NC 28.6 24.0 27.3 26.9 26.4
South 38.3 37.9 41.9 43.6 39.8
West 20.0 28.7 19.7 19.4 19.9
Physician Specialtya (%)
Family practice
8.4 9.5 10.2 10.2 8.7
Pediatrician 13.3 14.5 16.8 18.1 18.6
Both 0.5 0.6 0.7 0.8 0.8
Other 77.9 75.4 72.3 70.9 71.9
SD, Standard deviation; NE, Northeast; NC, North Central a
Table 4. Baseline Characteristics of New Users of Oral Anti-Diabetic Agents by Study Period
Characteristic Study Period
2002-2003 (n=616) 2004-2005 (n=1784) 2006-2007 (n=2429) 2008-2009 (n=3246) 2010-2012 (n=5749) Age (%)
8-10 7.3 8.5 10.2 8.9 8.3
11-14 30.7 32.2 32.8 33.6 33.5
15-18 62.0 59.4 57.0 57.6 58.2
Gender (%)
Female 68.5 67.5 70.0 70.6 71.7
Region (%)
NE 13.9 7.3 7.3 6.4 11.8
NC 26.4 25.4 27.7 29.3 26.9
South 39.8 45.2 51.7 49.8 45.3
West 19.9 22.0 13.3 14.4 16.0
Index Drug Type (%)
Metformin 78.9 84.9 89.4 94.5 95.6
Sulfonylurea 6.0 5.8 3.5 1.9 1.5
TZD 8.9 4.5 3.5 1.2 0.6
Other Classesa 1.8 1.6 2.3 1.2 1.8
Metformin + Sulfonylurea
3.6 1.4 0.7 0.6 0.3
Metformin+ TZD 0.8 1.8 0.5 0.5 0.2
Physician Specialtyb
Family Practice 20.5 24.2 25.4 26.1 24.1
Pediatrician 19.2 21.8 24.7 24.3 25.4
Both 4.3 3.6 2.5 3.2 2.8
Other 54.7 51.3 47.6 46.7 47.8
NE, Northeast; NC, North Central; TZD, Thiazolidinediones
a Includes alpha-glucosidase, meglitinide analogs, glucagon-like peptide-1 agonist, and dipeptidyl peptidase-4 inhibitors
b
Table 5. Monthly Mean Incidence (95% CI) Per 100 000 Commercially Insured Children: Overall and by Predictor Subgroups
Characteristic Study Period
2002-2012 2002-2003 2004-2005 2006-2007 2008-2009 2010-2012
Overall 4.6 (3.6, 5.5) 3.3 (2.0, 4.6) 4.4 (3.4, 5.4) 5.1 (4.1, 6.1) 5.1 (4.2, 6.0) 4.8 (4.0, 5.5)
Age
8-10 1.4 (0.4, 2.3) 1.1
(-0.4, 2.5)
1.3 (0.3, 2.2) 1.8 (0.7, 2.8) 1.4 (0.6, 2.1) 1.3 (0.6, 2.0)
11-14 3.4 (2.1, 4.6) 2.5 (0.7, 4.3) 3.2 (1.9, 4.5) 3.8 (2.5, 5.0) 3.6 (2.5, 4.6) 3.6 (2.6, 4.5)
15-18 5.5 (3.9, 7.0) 4.5 (2.3, 6.8) 5.5 (3.8, 7.1) 5.9 (4.4, 7.4) 5.6 (4.3, 6.9) 5.7 (4.5, 6.9)
Gender
Female 6.5 (4.9, 8.2) 4.7 (2.4, 6.9) 6.1 (4.4, 7.8) 7.4 (5.6, 9.1) 7.4 (5.9, 8.9) 7.0 (5.7, 8.3)
Male 2.7 (1.6, 3.7) 2.0 (0.6, 3.5) 2.7 (1.6, 3.8) 3.0 (1.9, 4.1) 2.9 (2.0, 3.8) 2.7 (1.9, 3.4)
Region
NE 3.4 (1.0, 5.8) 2.6
(-0.05, 5.8)
3.5 (0.5, 6.4) 3.4 (1.0, 5.8) 3.3 (1.1, 5.4) 4.0 (2.2, 5.8)
NC 4.7 (2.8, 6.6) 3.3 (0.9, 5.7) 4.6 (2.5, 6.7) 5.4 (3.3, 7.2) 5.6 (3.8, 7.4) 4.9 (3.4, 6.3)
South 5.5 (3.8, 7.1) 4.1 (1.8, 6.5) 5.3 (3.5, 7.1) 6.4 (4.7, 8.2) 5.9 (4.5, 7.3) 5.5 (4.2, 6.8)
West 3.6 (1.7, 5.5) 3.1 (0.1, 6.2) 3.3 (1.7, 5.0) 3.5 (1.6, 5.3) 3.8 (2.1, 5.5) 3.9 (2.4, 5.4)
Physician Specialtya, b
Family Practice 11.9 (6.8, 17.0) 8.2 (1.2, 15.1) 11.4 (6.1, 16.6) 12.8 ‘ (7.8, 17.7)
13.3 (8.9, 17.7)
13.2 (9.1, 17.4) Pediatrician 6.5 (3.6, 9.3) 4.7 (0.5, 8.9) 6.6 (3.3, 9.8) 7.6 (4.6,
10.5)
6.8 (4.5, 9.2) 6.5 (4.5, 8.5)
Both 2.0 (-0.3, 4.2) 3.0
(-2.1, 8.1)
2.4 (-0.4, 5.3)
1.8 (-0.4, 4.0)
2.0 (0.1, 3.8) 1.6 (0.2, 3.0)
CI, Confidence Interval; NE, Northeastern; NC, North Central a
Based on medical encounters in the 3-months prior to index drug date b
Figure 3. Population Trends by Predictor of Initiation- Age Group Specific Trends: Incidence per 100 000 Youth
Figure 5. Population Trends by Predictor of Initiation- Physician Specialty Trends: Incidence per 100 000 Youth
4.2 Study 2 results: persistence and re-initiation following discontinuation of oral anti-diabetic agents in children and adolescents
A total of 15,270 new users of OADs between the ages of 8 to 18 were identified between 2002 and 2012. Most of the identified users initiated treatment during the years of 2010 to 2012 (43.7%), were females (72.9%), aged 16-18 (47.1%), and from the southern region (47.5%) (Table 1). In terms of the index drug, off-label use was low as most patients were initiated on metformin (92.4%) and 86.4% of the corresponding copay for the index drug was $10 or less.
The overall mean (standard deviation (STD)) and median (interquartile range (IQR)) days to non-persistence in this population were 190.2 days (256.0 days) and 96 days (199 days), respectively. Cumulative risks of non-persistence demonstrate a rapid drop in
persistence, falling to 65.1% (95% CI: 64.3, 65.9%) by 180 days and 83.3% (95% CI: 82.7, 84.0%) by 360 days (table 2). Sensitivity analyses allowing for 30-day and 60-day
permissible gaps showed slightly higher risk of non-persistence, although conclusions were comparable between the all analyses. Patients in the oldest age category, 16-18 years, had a higher hazard of discontinuing therapy compared to patients 13-15 and 8-12 (HR=0.88, 95% CI: 0.85, 0.91; HR=0.89, 95% CI: 0.85, 0.93, respectively). Youth treated by pediatricians had a slightly lower hazard of being non-persistent compared with those treated by family practitioners, HR=0.87 (95% CI: 0.82, 0.91). Patients who had an index drug copay over $15 were more persistent compared to patients who did not have a copay on their index drug (HR=0.89, 95% CI: 0.83, 0.95). All other sub-group analyses did not demonstrate any meaningful differences in hazard ratios (Table 2).
Among the identified new OAD users, 10,832 had a period of 90 days or more
total of 1,897 (55.7%) and 2,844 (83.5%) of reinitiators restarted within six months and one year, respectively, of discontinuation date. The median number of days (IQR) to reinitiation from discontinuation was 164 days (163 days) with a range of 90 to 2,256 days. Among those who reinitiated therapy, switching rates were low as roughly 95% of patients returned to using the same OAD class as their last drug prior to discontinuation. Metformin users who switched tended to move to sulfonylureas (24%) and thiazolidinedione (26%).
Non-metformin users who switched tended to move to Non-metformin (100% sulfonylurea switchers reinitiated on metformin).
All events examined were more frequent in the hazard period compared to the control period. More than half of the patients (50.4%) who restarted OAD therapy had at least one outpatient encounter in the hazard period, compared to 27.2% in the control period.
Similarly, 16.3% and 4.6% had an HbA1c and related test in the hazard and control periods, respectively (Appendix Table 1). All events studied were strongly associated with restarting OAD therapy (Table 3). The combination of having an A1c and related test with an
4.2.1 Tables
Table 6. Baseline Characteristics of New User Cohort Total Cohort
No. of Subjects 15270
Age (%)
8-12 3221 (21.1)
13-15 4850 (31.8)
16-18 7199 (47.1)
Gender (%)
Female 11132 (72.9)
Index Drug Type
Metformin 14102 (92.4)
Sulfonylurea 401 (2.6)
TZD 308 (2.0)
Other Drug Classesa 459 (3.0)
Physician Specialtyb
Family Practice 3185 (20.9)
Pediatrician 3133 (20.5)
Both 373 (2.4)
Unknown 8579 (56.2)
Copay of Index Drug
$0 3264 (22.4)
$1-5 5251 (36.0)
$6-10 4083 (28.0)
$11-15 713 (4.9)
>$15 1270 (8.7)
Region
NE 1384 (9.1)
NC 4125 (27.0)
South 7253 (47.5)
West 2399 (15.7)
Index Drug Calendar Period
2002-2005 2561 (16.8)
2006-2009 6044 (39.6)
2010-2012 6665 (43.7)
a
Table 7. Cumulative Risk (30-Days, 180-Days, and 360-Days Non-Persistence) and Predictors of Discontinuation
30-D Non-Persistence (%)
180-D Non-Persistence (%)
360-D Non-Persistence (%)
Hazard Ratio at Day 360 (95% CI)
Overall 28.5 (27.7, 29.2) 65.1 (64.3, 65.9) 83.3 (82.7, 84.0)
Age Group
8-12 43.9 (42.2, 45.7) 78.0 (76.6, 79.4) 85.5 (84.3, 86.7) 0.89 (0.85, 0.93) 13-15 43.1 (41.7, 44.5) 77.5 (76.3, 78.7) 83.9 (82.8, 84.9) 0.88 (0.85, 0.91)
16-18 45.7 (44.5, 46.8) 80.5 (79.6, 81.4) 86.8 (86.0, 87.6) 1.0
Gender
Female 44.5 (43.6, 45.4) 79.2 (78.5, 80.0) 85.6 (84.9, 86.2) 1.04 (1.00, 1.08)
Male 44.5 (43.0, 46.0) 78.6 (77.3, 79.8) 85.6 (84.6, 86.8) 1.0
Physician Specialty
Family Practitioner
46.6 (44.8, 48.3) 83.1 (81.8, 84.4) 89.8 (88.8, 90.9) 1.0
Pediatrician 43.1 (41.3, 44.8) 78.5 (77.0, 79.9) 87.0 (85.8, 88.2) 0.87 (0.82, 0.91)
Unknown 44.4 (43.4, 45.5) 77.8 (76.9, 78.7) 83.5 (82.7, 84.3) ---
Copay
$0 45.2 (43.4, 46.9) 86.9 (85.7, 88.1) 95.4 (94.7, 96.2) 1.0
Table 8. Case-Crossover Results: Unadjusted Conditional Odds Ratios Predicting Reinitiation of Therapy
15-Day Hazard and Control Periods*
30-Day Hazard and Control Periods** Outpatient Medical
Encounter
3.29 (2.91, 3.71) 2.88 (2.58, 3.22)
T2DM
Complicationsa
3.08 (2.14, 4.44) 3.00 (2.16, 4.16)
LDL Test 2.58 (2.04, 3.26) 3.75 (2.98, 4.72)
HbA1c Test 3.19 (2.62, 3.88) 4.13 (3.41, 5.01)
Complicationsa + Med
Enc
3.96 (2.60, 6.04) 3.22 (2.27, 4.57)
LDL + Med End 3.19 (2.37, 4.30) 4.36 (3.30, 5.76)
HbA1c + Med Enc 4.20 (3.29, 5.35) 4.41 (3.55, 5.47)
Enc, Encounter
*Sensitivity analysis; **Primary analysis a
CHAPTER 5: DISCUSSION
5.1 Study 1 discussion: trends and determinants of oral anti-diabetic initiation in youth with suspected type 2 diabetes
The incidence of filled OAD prescriptions among children and adolescents increased substantially from 2002 to 2012, especially among females and individuals treated by FPs. Temporal trends demonstrate a decline in new prescriptions starting in 2008,
counterbalancing the sharp increase in new prescriptions from 2002 to 2008. We estimated similar trends of increasing use followed by gradual declines in treatment initiation for all sub-group specific analyses. The off-label usage of all other OAD drug classes decreased in this population over time as nearly all patients were on metformin by 2008. Conversely, off-label prescriptions for children aged 8-10 increased during the study period.
To our knowledge very little has been published on the incidence of pharmacy dispensed OAD prescriptions in children and adolescents, which makes comparisons with other studies difficult. Two studies were identified that evaluated prevalence trends in OAD prescriptions amongst youth in the US over a period spanning from 2002 to 2007.
Conclusions drawn from both studies were consistent and illustrated an approximate doubling in prevalence with the highest prevalence amongst females and adolescents (54), (51). The results from our study are consistent with this earlier work, as we reported
extends this prior work by providing estimates for the number of new users of OAD therapies, which allowed us to examine factors influencing treatment initiation.
The trend in T2DM disease incidence and prevalence has been well documented by the SEARCH for Diabetes in Youth Research group (71, 75, 76). Based on their reports, the prevalence and incidence of T2DM has increased by 30.5% and 37.5%, respectively,
between the years 2001 and 2009 with the most substantial subgroup increases seen in females, late-teens between 15-19 years of age, and racial minorities (71). The estimated increase in T2DM disease incidence is aligned with our findings on OAD incidence; however, we are unable to correlate our findings with theirs after the year 2009 where we observed a decrease in new OAD fills.
symptom-related diagnoses with female initiators over the same calendar period, and established that PCOS was unlikely to impact the observed female trend. We recognize that by excluding PCOS, our study may have somewhat underestimated the true rate of OAD initiation.
Our observation that initiators were twice as likely to have visited a FP compared with a general pediatrician is of particular interest. Obesity and obesity-related comorbidities are difficult to manage, contributing to the low self-perceived competence level to treat such disease states by physicians (79, 80). Differences in attitudes and management of T2DM have been seen to vary by physician characteristics (81). Results from survey data showed that younger providers and female physicians were more inclined to be aggressive with screening and monitoring practices (81). Less is known about how provider specialty impacts treatment decisions regarding OADs. However, as FPs frequently manage adult patients with T2DM and pre-diabetes (82, 83), they may be more comfortable with prescribing OADs than general pediatricians. Therefore, it may not be surprising that our study reported differences in prescribing rates by provider type. Nevertheless, this high degree of variation by provider may indicate overuse and/or underuse, and suggests opportunities for improvement in education, training, and care.
underrepresented in our study, we are unable to extrapolate our results to the general
population but can assume our reported rates of treatment initiation are an underestimation of the rates in the overall population. Second, we were unable to analyze additional patient characteristics that may impact OAD prescribing, such as race/ethnicity, family SES status and BMI, as these data are not routinely collected by health insurance plans. Third, outpatient pharmacy claims do not include the identity or specialty of the provider that ordered the filled prescription. Thus, we employed a method that included using a 3-month look-back window in outpatient claims files to classify patients who visited either a family practitioner or pediatrician and separately considered those patients who visited both or other specialties. Although this method does not guarantee the correct classification of the prescribing
provider, using a 6-month look back window resulted in consistent findings with the 3-month window. Lastly, prescription claims data do not capture medications obtained without
insurance, such as drugs paid out-of-pocket and is of particular concern to our study given that $4 generic drug programs launched in late 2006, offering metformin at discounted prices (not resulting in insurance claims). Although the impact of these low-cost, out-of-pocket programs on claims for OADs is unknown (85), it has been reported that at least 1 in 10 warfarin prescriptions are filled in this manner (86). This may partially explain the observed decrease in OAD usage from 2008 to 2012.
prescriptions filled without health insurance coverage. Continued efforts to educate and support physicians treating these patients are necessary in order to address the emerging epidemic of T2DM and its consequences in youth.
5.2 Study 2 discussion: persistence and re-initiation following discontinuation of oral anti-diabetic agents in children and adolescents
These results are from one of the largest population-based cohort on pediatric new users of OADs that we are aware of, and demonstrate that sub-optimal OAD use is common. We saw a rapid decline in persistence after initiation where over three-quarters of patients were non-adherent by 6-months of follow-up. However, almost one in three patients who had at least 1 extended period of without drug supply during the study subsequently restarted therapy, with more than half of these patients restarting within six months of discontinuation. Follow-up care of different forms were associated with reinitiation, particularly the dual occurrence of a laboratory test with an outpatient visit.
The magnitude of poor persistence in the pediatric OAD population has been
previously reported in only one other study. Although the study population was drawn from Medicaid and consisted of families of generally lower socioeconomic status than the
lowest compared with all other age groups for numerous therapies with reported treatment compliance rates varying from 10-56% (73). Further research is clearly needed to identify effective strategies for overcoming the unique adherence barriers faced by adolescents with T2DM and other chronic conditions.
Our study found that many non-adherent patients subsequently restarted therapy, suggesting that OAD persistence is not quite as bad as it appears. Comparable paradigms have been previously reported in adult chronic medication users. Reinitiation rates following a period of discontinuation among OAD users in the adult population are between 60% and 80.6% (64, 65). These rates are much higher compared to what was observed in the current study and can largely be attributed to higher disease severity of T2DM in the adult
population. Similar research conducted in the adult statin and antihypertensive user populations have also demonstrated high rates of reinitiation following a period of non-adherence (87, 88).
A major strength of using a case-crossover design in the current study is that it helps to adjust for confounding by an individual’s health-seeking attitudes, which should not change over a short period of time. In other study designs, such as a standard cohort study, it would be difficult to determine if it was the occurrence of follow-up care or if it was the patient’s health-seeking tendencies that played the key role in restarting therapy. By
follow-up care would be associated with reinitiation of OADs but the degree of the effect is still striking.
Our finding that a physician visit along with a glucose test was strongly associated with reinitiation of OAD therapy is consistent with previous research in adult statin users that found that non-adherent patients who visited the same physician who initiated their statin regimen and had a cholesterol test were more likely to restart statin therapy. Their study concluded that regular follow-up and continuity of care were likely important determinants of long-term medication adherence among statin users (87). Relatively little research has been conducted on the influence of health care-related factors on medication adherence in children and adolescents. However, the benefits of these factors have been linked to other outcome measures. High continuity of care in infants has been associated with decreased emergency department visits during early childhood and increased receipt of dental, nutritional, and developmental advice (89, 90). Furthermore, children with over one-year of follow-up care, regardless of whether they remained with one provider, were up to 17 times more likely to be up-to-date with immunization compared to children with less than 6-months of follow-up care (91). Our study extends on this previous work and supports the validity of these findings by demonstrating that follow-up care of different forms is also associated with improved medication adherence.
Results from this study suggest that greater follow-up care may improve the
require additional research. The improper use of chronic medications likely stems from a lack of appreciation for the long-term implications of ineffective management of these conditions. Consequentially, adherence becomes a dynamic process where treatment gaps of varying lengths of time are common. Management strategies aimed at improving adherence should focus on approaches that can decrease the frequency and length of these gaps in these different patient populations. Quality improvement approaches should focus on identifying and recalling patients with poor persistence, assessing their adherence, providing education to both the patient and provider, and performing appropriate diagnostic testing before patients develop short- and long-term disease related complications.
Our study has several limitations. First, it is important to note that the re-initiation analysis only assessed a population of kids who restarted therapy. We are unable to say anything about the population of children who discontinued and did not subsequently restart therapy. Second, despite the aforementioned strengths of a case-crossover design, the study may be confounded by time-varying patient characteristics. An individual patient’s views on their health status and the benefits of OAD therapy is difficult to predict and may change over time, especially by influences at the doctor’s office or factors outside of the healthcare setting. Therefore, the study is unable to remove confounding by these factors and cannot eliminate these additional explanations when interpreting our results. Third, we are unable to determine the reasons behind the gaps in treatment. It is possible that the patient experienced lack of effectiveness or an adverse reaction to the drug, which prompted the treating
limitations in terms of their capabilities and usefulness including inconsistencies and
oversights in coding practices. CPT procedure codes are present in over 85% of all physician claims in Marketscan (92); however, the consistency between documentation and actual performance is unknown. . This may be particularly relevant for some of the laboratory testing such as HbA1C and lipid levels, which may have been coded as miscellaneous laboratory or bundled services rather than through discrete CPT codes. Similarly, the prescription fill data in Marketscan only signifies availability of that drug to the patient. It does not provide complete information on actual drug consumption so it is possible that during the perceived gaps in treatment, patients were taking the drug but on an inconsistent basis. However, numerous studies have examined the relative validity of a prescription drug claim compared to a patient’s self-reported drug use and consistently found high agreement between the two sources (93-96). Furthermore, in terms of utilizing claims data for
compliance research, prescription claims data have been shown to be highly concordant with pill counts (96). Lastly, prescription claims data do not capture medications obtained without insurance, such as drugs paid out-of-pocket and is of particular concern to our study given that $4 generic drug programs launched in late 2006, offering metformin at discounted prices. Although the impact of these low-cost, out-of-pocket programs on claims for OADs is unknown (85), it has been reported that at least 1 in 10 warfarin prescriptions are filled in this manner (86). It is possible that some of the observed patients who discontinued therapy had in fact switched to a lower cost generic that did not result in an insurance claim.