1
An ethics-based decomposition of Malmquist productivity index
using data envelopment analysis
Fatemeh Rakhshan
1*, Mohammad Reza Alirezaee
11Department of Mathematics, Iran University of Science and Technology, Tehran, Iran
[email protected], [email protected], [email protected]
Abstract
Productivity growth and efficiency improvements are the major sources of economic development. Pure efficiency, scale efficiency, and technology are basic factors, and rules and regulations and balance are recently known factors affecting the Malmquist productivity index. The index is the most common productivity growth index that uses data envelopment analysis models over multiple time periods. In this paper, we focus on the effect of the ethics factor in the decomposition of Malmquist productivity change index at the bank branch level by first developing an ethics model using some ethical codes and then calculating the ethics factor of decision making units. The ethics model uses weight restrictions for the constant returns to scale technologies to increase discrimination power of basic data envelopment analysis models. Then, the proposed ethics model is applied to a sample of 41 commercial bank branches and the results for both traditional and extended Malmquist index are analyzed.
Keywords: Data Envelopment Analysis (DEA), Malmquist productivity index, ethical codes, weight restrictions, bank branches.
1-Introduction
Data Envelopment Analysis (DEA) is a powerful methodology for assessing the relative efficiency of a set of comparable decision making units (DMUs) with multiple inputs and outputs. This technique based on Farrell's seminal work (Farrell, 1957) and first developed by Charnes, Cooper and Rhodes (Charnes, Cooper and Rhodes, 1978), is a linear programming-based methodology. The first model of DEA is known as CCR under constant returns to scale (CRS) technology. Later, Banker, Charnes and Cooper (Banker, Charnes and Cooper, 1984) developed the BCC model, assuming variable returns to scale (VRS) technology.
DEA defines the efficiency of a given DMU as the ratio of the weighted sum of outputs to the weighted sum of inputs. Complete freedom of DMUs in selecting input and output weights may result in ignoring some of the inputs/outputs or assigning a zero weight to them.
Journal of Industrial and Systems Engineering Vol. 12, No. 4, pp. 1 - 17
Autumn (November) 2019
Corresponding author
2
Most methodological extensions of DEA followed an application-driven path as a result of the application of the method in solving real life problems. The desire to incorporate restrictions on the weights attached to the inputs/outputs of DMUs is one of the areas of development in DEA (Allen et al., 1997). One way to avoid such a situation is to restrict the weights. By incorporating absolute upper and lower bounds, assurance region type I (ARI) and type II (ARII), and virtual weight restrictions, the analyst can make the model more realistic and improve the discrimination of basic DEA models. For literature on different types of weight restrictions and value judgments in DEA, see Thanassoulis, Portela and Allen (2004). Weight restriction is also a way of reflecting the manager's or modeler's prior views or information about the relative importance of individual inputs and outputs or imposing a specific relation between them involving cost or price considerations. In addition to weight restrictions, there are other methods for improving discrimination power of DEA models such as trade-offs selective proportionality, and creating unobserved DMUs (Podinovski and Thanassoulis, 2007).
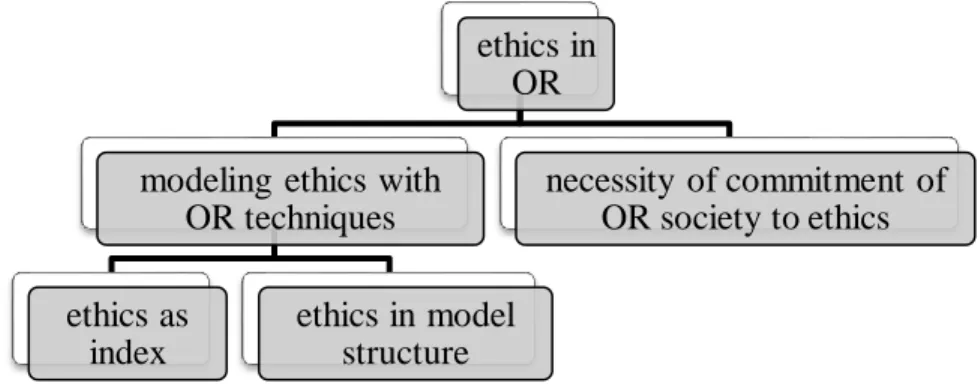
Any human activity raises ethical questions, questions about “good” and “right” ways to act and to live, or to put it differently, questions of values and responsibility (Ormerod and Ulrich, 2013). The literature on operations research (OR) and ethics is not very extensive, but it has roots extending at least back to the 1960s, and is increasing in breadth and vigor (Wenstøp, 2010). When we reviewed the literature of consideration of ethical issues in OR (and specifically in DEA), we found two types of studies. As Figure 1 shows, the first is studies that discuss the necessity of adherence of OR modelers and researchers to some ethical principles. There have long been concerns with ethics in the OR community. Since the inception of this concern systematically by Churchman, there has been great interest among scholars about this topic in areas such as economic growth and instability, loyalty in financial institutions, environmental degradation, and sustainable development. Churchman (1961,1968, 1979, 1994) and Ackoff (1974) believed that ethics is located within the scope of OR intervention. Kleijnen (2001) stated that OR societies have no formal codes of ethics, but other societies do have them. Gass (2009) reviewed past endeavors by OR societies to establish ethical guidelines or codes to which their members must subscribe. The role of OR in resolving modern ethical problems such as sustainable development, is discussed by Brans and Kunsch (2010). Since this paper doesn’t address this type of study, we refer the reader to the survey of Ormerod and Ulrich (2013) for further study in this area. The second type, that is, the subject of our paper, is studies that want to model ethics in terms of some ethical indices or criteria. Very few studies have focused on this area. Probably, one of the reasons for the literature weakness on this issue is the considerable challenges of incorporating qualitative variables such as ethics into the analysis.
Fig 1. Areas of intervention of ethical issues in OR
Although there is almost no ethics-based DEA study, from a general point of view, we can say that two approaches for taking ethics into account may be considered: As illustrated in Figure 1, one straightforward procedure is to define an ethics index in an appropriate way, make it quantitative using
ethics in
OR
modeling ethics with
OR techniques
ethics as
index
ethics in model
structure
necessity of commitment of
OR society to ethics
3
questionnaire or another method, and then consider it as an extra input or output in different basic DEA models. Another novel approach adopted in this study is to incorporate ethical concepts into the model structure, for example, by adding additional constraint(s) to the basic models or by changing the relationship between the variables in a way that suggests the respective ethical purpose of doing research. Basso and Funari (2003, 2007) assessed ethical mutual funds in which an ethical measure, as the ethical level of the fund obtained through questionnaires, is considered as an additional output along with other inputs and outputs of basic DEA models. The advantage of the second approach is that one can discuss ethical issues in performance evaluations with different aspects (or different indices). We found only these two papers in the literature of ethics-based DEA studies. Unfortunately, there is no research in conjunction with the second view. Of course, there are also studies in the field of Islamic work ethics in financial institutions such as banks. For example, Mohammad et al. (2016) studied the moderating role of Islamic work ethic in Malaysia. Abbas et al. (2015) provided a guideline for establishing the ethical financial institutions by means of DEA and Malmquist total factor productivity growth. When the employee perceives his/her ethical environment as Eegoism, productivity, quality, and work efficiency would be significantly higher than those of the environments of benevolence (Yen, 2017). We also note that the subject of this research is out of the field of this type of studies.
Productivity is viewed as the most important long-run driver of economic growth in both economic theory and empirical research (Ding et al., 2016). Therefore, understanding the factors affecting productivity is very important. Economists often use total factor productivity estimates as proxies for management (Triebs and Kumbhakar, 2018). In recent years, the measurement and analysis of productivity change has attracted many researchers. The Malmquist index (MI), first introduced by Malmquist (1953) as a quantity for use in the analysis of input consumptions, is a prominent index measuring productivity change over time. It was first used in productivity literature by Caves,Christensen and Dievert (1982). Fare et al., (1992) developed a DEA-based decomposition of the Malmquist index, known as FGLR decomposition, consisting of two components, technology change (TC) and efficiency change (EC), over two time periods. Three-component decomposition of the index was developed by Fare et al., (1994) regarding both CRS and VRS technologies involving pure efficiency change (PEC), scale efficiency change (SEC), and technological change. This decomposition is called FGNZ. These decompositions were conducted using basic models of CCR and BCC. In this context, there are two more studies that apply new technologies as a basis. In order to improve the meaning of efficiency using expanded production possibility set (PPS), Alirezaee and Afsharian (2010) presented an extended Malmquist index (EMI) using trade-offs technology aligned with two basic models. Also, in order to take into account the effect of imposed strategies on DMUs’ behavior, Alirezaee and Rajabi Tanha (2015) proposed a balance model for assessing balance factor and developed another extended Malmquist index. The implication of employing a code of ethics fewer than two incentive systems on overall productivity were explored in the work of Smith (2018).
Here, in line with the second approach stated above and with the aim of introducing a model with more discrimination power relative to basic DEA models, we use weight restrictions in the form of ARI in the proposed ethics model (EM) and then define an ethics factor (EF) for each DMU. In applying ARI restrictions, we utilize one or more ethical predefined codes corresponding to each (or some) output(s) (in an output-oriented model) or input(s) (in an input oriented model) and then integrate them as the relative value of that index. The codes contain norms specifying the most important general clauses that are used in banking law, in particular the clause of good morals and commercial honesty (Frańczuk, 2019). The codes must be chosen so that they reflect some of ethical aspects of the related index regarding the object of evaluation. Of course there will be some challenges in selecting related codes and then quantifying them that will be discussed. We will use the proposed EM in developing an extended Malmquist index (EMI) to determine the role of ethics as a contributing factor in productivity growth or decline. The EMI will be decomposed into two components of extended efficiency change (EEC) and extended technology change (ETC). Regarding both ethics-based and CRS technologies, we define the ethics factor change
4
(EFC) and propose a three-component decomposition of EMI consisting of EC, EFC, and ETC. Also, if we consider VRS technology in addition to ethics-based and CRS technologies, a new four-component decomposition of EMI consisting of SEC, PEC, EC, and ETC will be obtained. These decompositions provide us new insight about the contribution of ethical issues along with other known factors in productivity changes.
The remainder of this article is organized as follows: Section 2 describes the proposed EM considering some ethical codes and defines EF of a given DMU. An extended MI and its different decompositions including EFC are presented in section 3. In section 4, we use a real-world case study at the bank branch level to demonstrate the applicability and efficacy of the proposed methods in calculating EMI with its decompositions. We will analyze and compare MI and EMI for two time periods in this section. Concluding remarks and future directions will appear in section 5.
2-The proposed EM for calculating EF in DEA
Suppose that we have n DMUs with m inputs and s outputs denoted by 𝑋𝑗= (𝑥1𝑗, 𝑥2𝑗, … , 𝑥𝑖𝑗, … , 𝑥𝑚𝑗)
and 𝑌𝑗= (𝑦1𝑗, 𝑦2𝑗, … , 𝑦𝑟𝑗, … , 𝑦𝑠𝑗) respectively for DMUj, 𝑗 = 1, … , 𝑛. It is assumed that 𝑋𝑗≥ 0 and 𝑌𝑗≥
0 with 𝑋𝑗≠ 0 and 𝑌𝑗≠ 0 for all DMUs. The multiplier forms of output-oriented CCR and BCC models
for measuring TE and pure efficiency (PE) respectively for a given DMUp are defined as follows:
𝜃
𝐶𝐶𝑅= Min ∑ 𝑣
𝑖𝑥
𝑖𝑝 𝑚𝑖=1
𝜃
𝐵𝐶𝐶= Min ∑ 𝑣
𝑖𝑥
𝑖𝑝− 𝑢
0 𝑚𝑖=1
𝑠. 𝑡. ∑ 𝑢𝑟𝑦𝑟𝑝= 1 𝑠
𝑟=1
(1) 𝑠. 𝑡. ∑ 𝑢𝑟𝑦𝑟𝑝= 1 𝑠
𝑟=1
(2)
∑ 𝑢
𝑟𝑦
𝑟𝑗𝑚
𝑖=1
− ∑ 𝑣
𝑖𝑥
𝑖𝑗≤ 0
𝑚
𝑖=1
, 𝑗 = 1, … , 𝑛 ∑ 𝑢
𝑟𝑦
𝑟𝑗𝑚
𝑖=1
− ∑ 𝑣
𝑖𝑥
𝑖𝑗− 𝑢
0≤ 0
𝑚
𝑖=1
, 𝑗 = 1, … , 𝑛
𝑢
𝑟≥ 𝜀, 𝑟 = 1, … , 𝑠 𝑢
𝑟≥ 𝜀, 𝑟 = 1, … , 𝑠, 𝑢
0free
𝑣
𝑖≥ 𝜀, 𝑖 = 1, … , 𝑚 𝑣
𝑖≥ 𝜀, 𝑖 = 1, … , 𝑚
Where 𝑢𝑟 and 𝑣𝑖 are weights assigned to output 𝑟 and input 𝑖, respectively, and 𝜀 > 0 is a
non-archimedean infinitesimal applied to avoid zero weights. Models (1) and (2) compute 𝑢𝑟𝑠 and 𝑣𝑖𝑠 as the
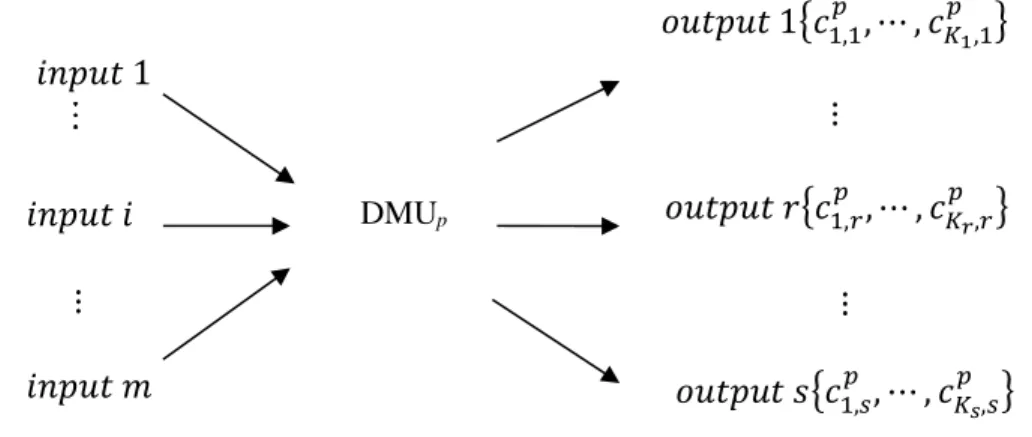
relative value of outputs and inputs. Hereafter, we want to reform the weighting structure of this model in a manner such that an ethical value of each index, defined by considering the priorities of decision maker (DM), is considered as the relative value of them. The typical inputs of banks in production approach are full time equivalent employees and fixed assets, and the typical outputs are deposits, loans and services (Ahn and Lee, 2014). Based on these typical inputs and outputs, suppose we have defined the set of quantified ethical codes 𝐶𝑟𝑝 = {𝑐1,𝑟
𝑝
, ⋯ , 𝑐𝐾𝑝𝑟,𝑟} related to output 𝑟 of DMUp for 𝑟 = 1, … , 𝑠 as illustrated in figure 2 (the same analysis can be done for inputs). The way these codes are defined and how they are calculated, are stated in subsection 4.2.
5
Note that 𝐶𝑟𝑝 can be empty for some but not all outputs 𝑟 of DMUp . For defining EM, we need to introduce a unique value for each output as the “ethical value” of it. For this purpose, we integrate the codes in each set by regarding DM priorities about the relative importance of them, or one could simply use other weighting and consolidating techniques. So we have 𝑐𝑟𝑝 as the unique ethical value of output 𝑟
for DMUp and 𝑟 = 1, … , 𝑠. Now, 𝑐𝑟𝑝s could be interpreted as the output prices from an ethical point of view rather than financial concepts.
We change weighing structure of the basic CCR model in such a way that relative value of output weights be equal to the relative ethical value of them. Adding these restrictions will force the model to do an ethics-based evaluation, so the better the ethical performance (in terms of defined ethical codes), the better the efficiency score.
Here, we introduce the proposed EM as follows:
𝜃
𝐸𝑀= Min ∑ 𝑣
𝑖𝑥
𝑖𝑝𝑚
𝑖=1
𝑠. 𝑡. ∑ 𝑢
𝑟𝑦
𝑟𝑝= 1
𝑠
𝑟=1
∑ 𝑢𝑟𝑦𝑟𝑗 𝑚
𝑟=1
− ∑ 𝑣𝑖𝑥𝑖𝑗≤ 0 𝑚
𝑖=1
, 𝑗 = 1, … , 𝑛 (3)
𝑢
𝑟𝑎𝑢
𝑟𝑏=
𝑐
𝑟𝑝𝑎𝑐
𝑟𝑏𝑝
𝑟
𝑎< 𝑟
𝑏, 𝑟
𝑎, 𝑟
𝑏= 1, ⋯ , 𝑠
𝑣
𝑖≥ 𝜀, 𝑖 = 1, … , 𝑚.
In EM above, 𝑢𝑟𝑎 and 𝑢𝑟𝑏 are output weights and 𝑐𝑟𝑝𝑎 and 𝑐 𝑟𝑏
𝑝
are ethical values of outputs observed at DMUp for any two outputs 𝑟𝑎 and 𝑟𝑏 produced by the DMU. A given DMU is called ethically efficient if
𝜃𝐸𝑀= 1.
Fig 2. Ethical coding structure of a DMU DMUp
𝑖𝑛𝑝𝑢𝑡 1
𝑖𝑛𝑝𝑢𝑡 𝑖
⋮
𝑖𝑛𝑝𝑢𝑡 𝑚
𝑜𝑢𝑡𝑝𝑢𝑡 1{𝑐
1,1𝑝, ⋯ , 𝑐
𝐾1,1 𝑝
}
⋮
𝑜𝑢𝑡𝑝𝑢𝑡 𝑟{𝑐
1,𝑟𝑝, ⋯ , 𝑐
𝐾𝑝𝑟,𝑟}
⋮
6
Definition 1. The ethics factor (EF) of a DMU is defined as the ratio of the EM to the CCR efficiency scores of the DMU. This factor measures frontier changes after adding ethical constraints.
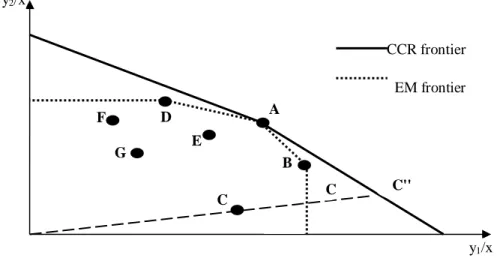
In order to demonstrate the effect of ethical weight restrictions and the EF concept, consider the PPS generated by DMUs A to G with one input and two outputs under CCR and EM technologies in Figure 3. By definition 1, the gap between two drawn efficient frontiers shows the EF of each DMU. This difference measures the efficiency status before and after taking ethical issues into consideration. Considering DMU C, 𝜃𝐶𝐶𝑅, 𝜃𝐸𝑀, and EF are as follows:
𝜃
𝐶𝐶𝑅=
𝑂𝐶𝑂𝐶′
𝜃
𝐸𝑀=
𝑂𝐶𝑂𝐶′′
𝐸𝐹 =
𝑂𝐶′𝑂𝐶′′
(4)
Obviously, both the 𝜃𝐶𝐶𝑅 and 𝜃𝐸𝑀 measures obtained for DMU C are less than 1, so it is neither
technically nor ethically efficient, and its EF is less than 1. The EF for DMU A is equal to 1, meaning that it is efficient under both technologies. Hence, DMU A is an ethically and technically efficient. DMU B is technically but not ethically efficient, and the EF of it is less than 1. In this figure, it is DMU A that still remains on the frontier after adding new ethical constraints. Improving the discrimination of the CCR model as a result of extending PPS can easily be seen in figure 3.
3-Extending MI
In this section, first we have a brief review of the traditional Malmquist index in subsection 3-1 and then use the proposed EM for developing EMI in subsection 3-2.
3-1- MI and its decompositions
Let (𝑥𝑝𝑡, 𝑦𝑝𝑡) and (𝑥𝑝𝑡+1, 𝑦𝑝𝑡+1) be inputs and outputs of DMUp observed at two time periods, 𝑡 and 𝑡 + 1. The (output-oriented) Malmquist productivity index can be expressed as.
𝑀𝐼 = [𝐷 𝑡(𝑥
𝑝𝑡+1, 𝑦𝑝𝑡+1) 𝐷𝑡+1(𝑥
𝑝𝑡, 𝑦𝑝𝑡) .𝐷
𝑡+1(𝑥
𝑝𝑡+1, 𝑦𝑝𝑡+1) 𝐷𝑡(𝑥
𝑝𝑡, 𝑦𝑝𝑡) ]
1 2 ⁄
. (5)
y1/x
y2/x
A
B D
E
C F
G
CCR frontier EM frontier
Fig 3. CRS and EM efficiency frontiers for sample DMUs C'' C
7
Calculation of MI requires two single-period and two mixed-period measures. The two single-period measures are 𝐷𝑡(𝑥
𝑝𝑡, 𝑦𝑝𝑡) and 𝐷𝑡+1(𝑥𝑝𝑡+1, 𝑦𝑝𝑡+1), which refer to the distance of (𝑥𝑝𝑡, 𝑦𝑝𝑡) and (𝑥𝑝𝑡+1, 𝑦𝑝𝑡+1)
from efficient frontiers of time periods 𝑡 and 𝑡 + 1 respectively. Also, the two mixed-period measures are
𝐷𝑡+1(𝑥
𝑝𝑡, 𝑦𝑝𝑡) and 𝐷𝑡(𝑥𝑝𝑡+1, 𝑦𝑝𝑡+1), which refer to the distance of (𝑥𝑝𝑡, 𝑦𝑝𝑡) and (𝑥𝑝𝑡+1, 𝑦𝑝𝑡+1) from different
efficient frontiers constructed in time periods 𝑡 + 1 and 𝑡 respectively. These four measures are called distance functions. All of the required distance functions in the MI formula can be obtained from DEA models. Assuming output-oriented CRS technology 𝐷𝑡(𝑥
𝑝𝑡+1, 𝑦𝑝𝑡+1) could be obtained as follows:
[𝐷
𝐶𝑅𝑆𝑡(𝑥
𝑝𝑡+1
, 𝑦
𝑝𝑡+1)]
−1= Min ∑ 𝑣
𝑖𝑡𝑥
𝑖𝑝𝑡+1
𝑚
𝑖=1
𝑠. 𝑡. ∑ 𝑢𝑟𝑡𝑦𝑟𝑝𝑡+1 = 1 (6) 𝑠
𝑟=1
∑ 𝑢
𝑟𝑡𝑦
𝑟𝑗𝑡 𝑚
𝑖=1
− ∑ 𝑣
𝑖𝑡𝑥
𝑖𝑗𝑡≤ 0
𝑚𝑖=1
,
𝑗 = 1, … , 𝑛
𝑢
𝑟𝑡≥ 𝜀, 𝑟 = 1, … , 𝑠
𝑣
𝑖𝑡≥ 𝜀, 𝑖 = 1, … , 𝑚.
The other three distance functions can be computed similarly. FGLR two-component decomposition of MI, which presents EC and TC, is
𝑀𝐼 =𝐷𝐶𝑅𝑆 𝑡+1(𝑥
𝑝 𝑡+1, 𝑦
𝑝𝑡+1) 𝐷𝐶𝑅𝑆𝑡 (𝑥
𝑝𝑡, 𝑦𝑝𝑡)
[𝐷𝐶𝑅𝑆
𝑡 (𝑥
𝑝 𝑡+1, 𝑦
𝑝𝑡+1) 𝐷𝐶𝑅𝑆𝑡+1(𝑥
𝑝𝑡+1, 𝑦𝑝𝑡+1) .𝐷𝐶𝑅𝑆
𝑡 (𝑥
𝑝𝑡, 𝑦𝑝𝑡) 𝐷𝐶𝑅𝑆𝑡+1(𝑥
𝑝 𝑡, 𝑦
𝑝𝑡) ]
1 2 ⁄
= 𝐸𝐶 × 𝑇𝐶. (7)
Considering two CRS and VRS technologies, FGNZ decomposition breaks down MI into three components. These components are PEC, SEC, and TC, using CCR and BCC models. We note that SE is defined as the ratio of CCR to BCC efficiency scores.
𝑀𝐼 =𝑃𝐸 𝑡+1(𝑥
𝑝 𝑡+1, 𝑦
𝑝𝑡+1) 𝑃𝐸𝑡(𝑥
𝑝𝑡, 𝑦𝑝𝑡)
×𝑆𝐸 𝑡+1(𝑥
𝑝𝑡+1, 𝑦𝑝𝑡+1) 𝑆𝐸𝑡(𝑥
𝑝 𝑡, 𝑦
𝑝𝑡)
× [𝐷𝐶𝑅𝑆
𝑡 (𝑥
𝑝𝑡+1, 𝑦𝑝𝑡+1) 𝐷𝐶𝑅𝑆𝑡+1(𝑥
𝑝𝑡+1, 𝑦𝑝𝑡+1) .𝐷𝐶𝑅𝑆
𝑡 (𝑥
𝑝𝑡, 𝑦𝑝𝑡) 𝐷𝐶𝑅𝑆𝑡+1(𝑥
𝑝 𝑡, 𝑦
𝑝𝑡) ]
1 2 ⁄
(8) = 𝑃𝐸𝐶 × 𝑆𝐸𝐶 × 𝑇𝐶
Where
𝑃𝐸
𝑡(𝑥
𝑝𝑡, 𝑦
𝑝𝑡
) = 𝐷
𝑉𝑅𝑆𝑡(𝑥
𝑝𝑡, 𝑦
𝑝𝑡),
𝑆𝐸
𝑡(𝑥
𝑝𝑡, 𝑦
𝑝𝑡) =
𝐷
𝐶𝑅𝑆𝑡(𝑥
𝑝𝑡, 𝑦
𝑝𝑡)
𝐷
𝑉𝑅𝑆𝑡(𝑥
𝑝𝑡, 𝑦
𝑝𝑡)
8
[𝐷
𝑉𝑅𝑆𝑡(𝑥
𝑝𝑡, 𝑦
𝑝𝑡)]
−1
= Min ∑ 𝑣
𝑖𝑡𝑥
𝑖𝑝𝑡− 𝑢
0𝑡𝑚
𝑖=1
𝑠. 𝑡. ∑ 𝑢𝑟𝑡𝑦𝑟𝑝𝑡 = 1 (9) 𝑠
𝑟=1
∑ 𝑢
𝑟𝑡𝑦
𝑟𝑗𝑡 𝑚
𝑖=1
− ∑ 𝑣
𝑖𝑡𝑥
𝑖𝑗𝑡
− 𝑢
0𝑡≤ 0
𝑚𝑖=1
,
𝑗 = 1, … , 𝑛
𝑢𝑟𝑡 ≥ 𝜀, 𝑟 = 1, … , 𝑠, 𝑢0𝑡 free 𝑖𝑛 𝑠𝑖𝑔𝑛
𝑣
𝑖𝑡≥ 𝜀, 𝑖 = 1, … , 𝑚.
It is noteworthy that in all decompositions above, an MI quantity greater than, equal to, or less than 1 means that productivity has grown, remained unchanged, or declined during periods 𝑡 and 𝑡 + 1. Similar results hold about growth or decline of individual components in various MI decompositions.
3-2- Developing EMI using ethics concept
If we consider EM as the base technology in (5), a novel extended MI (EMI) with respect to ethics will be obtained as (10).
𝐸𝑀𝐼 = [𝐷𝐸𝑀
𝑡 (𝑥
𝑝𝑡+1, 𝑦𝑝𝑡+1) 𝐷𝐸𝑀𝑡+1(𝑥
𝑝𝑡, 𝑦𝑝𝑡)
𝐷𝐸𝑀𝑡+1(𝑥𝑝𝑡+1, 𝑦𝑝𝑡+1) 𝐷𝐸𝑀𝑡 (𝑥
𝑝𝑡, 𝑦𝑝𝑡) ]
1 2 ⁄
(10)
Where (𝑥𝑝𝑡, 𝑦𝑝𝑡) and (𝑥𝑝𝑡+1, 𝑦𝑝𝑡+1) are the observed inputs and outputs of DMUp in time periods 𝑡 and
𝑡 + 1 respectively. 𝐷𝑡(𝑥
𝑝𝑡+1, 𝑦𝑝𝑡+1) is calculated by solving model (10). Other measures in (10) are
calculated in a similar manner.
[𝐷
𝐸𝑀𝑡(𝑥
𝑝𝑡+1
, 𝑦
𝑝𝑡+1)]
−1= Min ∑ 𝑣
𝑖𝑡𝑥
𝑖𝑝𝑡+1
𝑚
𝑖=1
𝑠. 𝑡. ∑ 𝑢
𝑟𝑡𝑦
𝑟𝑝𝑡+1
= 1
𝑠𝑟=1
∑ 𝑢𝑟𝑡𝑦𝑟𝑗𝑡 𝑚
𝑖=1
− ∑ 𝑣𝑖𝑡𝑥𝑖𝑗𝑡 ≤ 0 𝑚
𝑖=1
, 𝑗 = 1, … , 𝑛 (11)
𝑢
𝑟𝑡𝑎𝑢
𝑟𝑡𝑏=
𝑐
𝑟𝑎𝑝,𝑡+1
𝑐
𝑟𝑏 𝑝,𝑡+1𝑟
𝑎< 𝑟
𝑏, 𝑟
𝑎, 𝑟
𝑏= 1, ⋯ , 𝑠
𝑣
𝑖≥ 𝜀, 𝑖 = 1, … , 𝑚
Where 𝑢𝑟𝑡𝑎 and 𝑢 𝑟𝑏
9 As described in section 2, 𝑐𝑟𝑝,𝑡+1𝑎 and 𝑐
𝑟𝑏 𝑝,𝑡+1
are relative ethical values of outputs 𝑟𝑎 and 𝑟𝑏 for DMU
p in time period 𝑡 + 1.
Now we can develop other versions of EMI decompositions regarding CCR and EM technologies. Two-component EMI can be written as
𝐸𝑀𝐼 = 𝐸𝐸𝐶 × 𝐸𝑇𝐶
Where
𝐸𝐸𝐶 =𝐷𝐸𝑀 𝑡+1(𝑥
𝑝𝑡+1, 𝑦𝑝𝑡+1) 𝐷𝐸𝑀𝑡 (𝑥𝑝𝑡, 𝑦
𝑝𝑡)
, 𝐸𝑇𝐶 = [𝐷𝐸𝑀
𝑡 (𝑥
𝑝 𝑡+1, 𝑦
𝑝𝑡+1) 𝐷𝐸𝑀𝑡+1(𝑥𝑝𝑡+1, 𝑦
𝑝𝑡+1) .𝐷𝐸𝑀
𝑡 (𝑥
𝑝𝑡, 𝑦𝑝𝑡) 𝐷𝐸𝑀𝑡+1(𝑥𝑝𝑡, 𝑦
𝑝𝑡) ]
1 2 ⁄
(12)
This is obtained by substituting EM instead of CCR model in (7). Using EF concept developed in Definition 1, a new three-component decomposition that specifies EFC portion in productivity change is developed as follows:
𝐸𝑀𝐼 = 𝐸𝐶 × 𝐸𝐹𝐶 × 𝐸𝑇𝐶
Where
𝐸𝐶 =
𝐷
𝐶𝑅𝑆𝑡+1
(𝑥
𝑝𝑡+1
, 𝑦
𝑝𝑡+1)
𝐷
𝐶𝑅𝑆𝑡(𝑥
𝑝𝑡, 𝑦
𝑝𝑡)
,
𝐸𝐹𝐶 =𝐸𝐹 𝑡+1(𝑥
𝑝𝑡+1, 𝑦𝑝𝑡+1) 𝐸𝐹𝑡(𝑥
𝑝𝑡, 𝑦𝑝𝑡)
= [𝐷𝐸𝑀 𝑡+1(𝑥
𝑝𝑡+1, 𝑦𝑝𝑡+1) 𝐷𝐶𝑅𝑆𝑡+1(𝑥𝑝𝑡+1, 𝑦𝑝𝑡+1)
𝐷𝐶𝑅𝑆𝑡 (𝑥𝑝𝑡, 𝑦𝑝𝑡) 𝐷𝐸𝑀𝑡 (𝑥𝑝𝑡, 𝑦𝑝𝑡)
], (13)
𝐸𝑇𝐶 = [
𝐷
𝐸𝑀𝑡
(𝑥
𝑝𝑡+1
, 𝑦
𝑝𝑡+1)
𝐷
𝐸𝑀𝑡+1(𝑥
𝑝𝑡+1
, 𝑦
𝑝𝑡+1)
𝐷
𝐸𝑀𝑡(𝑥
𝑝𝑡, 𝑦
𝑝𝑡)
𝐷
𝐸𝑀𝑡+1(𝑥
𝑝𝑡, 𝑦
𝑝𝑡)
]
1 2 ⁄
,
Which is obtained from (12) according to the relation 𝐷𝐸𝑀𝑡 (𝑥𝑝𝑡, 𝑦𝑝𝑡) = 𝐷𝐶𝑅𝑆𝑡 (𝑥𝑝𝑡, 𝑦𝑝𝑡) × 𝐸𝐹𝑡(𝑥𝑝𝑡, 𝑦𝑝𝑡). In
this decomposition, we considered the two technologies EM and CCR.
In addition, if consider VRS technology in addition to EM and CCR, another novel four-component decomposition of EMI will be obtained that breaks down EMI into PEC, SEC, EFC, and ETC as follows:
𝐸𝑀𝐼 = 𝑃𝐸𝐶 × 𝑆𝐸𝐶 × 𝐸𝐹𝐶 × 𝐸𝑇𝐶
.
(14)The components PEC and SEC were defined in (8).
4-Bank branch case study
In this section, we implement the proposed procedure on a real-world case study at the bank branch level and then analyze the results. 41 branches of Maskan Bank of Iran located in Tehran for two time periods 2016-2017 were selected for this research. It is noted that Maskan Bank is the largest Iranian
10
governmental bank in the housing sector. The results of the case study can be useful for managers to understand the effect of ethics factor on the productivity growth of the branches and also to find out how they can manage any budget for improving the ethics factor of the branches
4-1- Input and output data
Production analysis is one of the most significant dimensions of bank branch performance (Paradi and Zhu, 2013). In this case study, we measure the performance of bank branches with respect to this aspect as shown in Figure 4. Then, branches are considered as producers of services for taking deposits, making loans, and providing other diverse banking services using personnel expenses and location index as inputs.
It should be noted that computation of the location index of branches, showing the status of a branch in terms of different factors, was done as part of the research project “Model design and implementation for Maskan Bank branches location” contact No. 48-90-2612, dated 13/07/2011, carried out by Behin-Cara-Pajoh Research Center of Operations Research. Just briefly, it is mentioned that the model of computing location index is a combination of analytical hierarchy process, factor analysis, and direct observation. The most important factors considered in computing location index are branch customers’ specifications, physical location of branch, and branch staff characteristics.
Here we provide a brief explanation on how to calculate the deposits index. Other output indices are also calculated in the same way. Both the value of each type of deposit and the number of transactions recorded for them are considered in computing the index. We implement an analytical hierarchy process for both the value and number of transactions related to all types of deposits. Finally, the deposits index is achieved by a weighted sum of them. Of course, the weights are determined with respect to expert opinion.
The descriptive statistics of inputs and outputs for two time periods are given in table 1. Measurement unit of personnel expenses is 10000 Rials. Other indices have no units because they are normalized.
Personnel expenses
Location index
Bank branch
Deposits
Loan
Services
11
Table 1. Data statistics
Min Max Mean STD Min Max Mean STD
2016 2017
Inputs
Personnel expenses 192124.2 857309.2 366186.8 145454.9 189617.1 1149545.7 408021.9 186105.5 Location index 632.6 1168 1018.3 100.2 632.6 1168 1018.3 100.2
Outputs
Deposits 516.9 8522 1564.2 1402.3 341.3 4840 1359.3 901.4 Loans 64.8 2218 748.5 464.0 75.6 2075 754.7 427.9 Services 520.1 10250 1310.7 1561.7 482.3 5574 1060.7 880.38
4-2- Ethical codes related to outputs
Since there are a significant number of ethical codes at the bank branch level that could be regarded in the assessment, we chose to obtain a classification of these codes by interviewing managers repeatedly. Therefore, as Figure 5 shows, we divide them into three categories: operational codes, physical codes, and customer relationship codes. Operational codes are related to those ethical issues that may be appear in various banking operations and financial transactions. To what extent the physics and appearance of a branch respect for the customers and take into account the convenience of them is relevant to physical codes. Honoring the customers and an ethics-based respectful customer relationship are subjects of the third category of codes. It should be noted here that we believe there is a subtle distinction between immorality and malfeasance. Immorality may not necessarily be malfeasance. Monitoring compliance with rules and discovering the violations is the task of the audit office in bank and is not the topic of our discussion. However, there are many cases of immorality that are not considered as violations of rules. Lack of facilities for a customer with a wheelchair to enter the branch, failure to provide car parking for customers, improper counter heights that give the customer trouble, not enough chairs, flower arrangements in the branch environment, and more are cases of immorality related to the physics of the branch. Helping the customers, guiding them to meet their needs, informing them about the various bank services, expediting their requests, customer privacy, observing the customer turns, cheerful communication of personnel with customers, and so on are samples of ethics-based customer relationships.
Fig 5. Classification of ethical codes at the bank branch level
ethical codes at the
bank branch level
12
Since evaluating branches with respect to all three categories above is complex and requires permission to access a large amount of data, we decided to do an assessment based on only the codes of one category. Physical codes are selected for doing research in this paper, but the same process can be used for other categories.
The robustness of the results of a DEA analysis relies on the availability and quality of data (Sowlati and Paradi, 2004). In this research, availability of appropriate ethical codes is the greatest challenge in selecting them. For objectivity purposes, the codes should be chosen in such a way that their numerical value is available for all 41 branches under review. For this reason, after a long consultation with the bank officials and experts about the ethical codes at the branch level that could be regarded, we conclude that the codes should be selected or constructed using the existing bank accounting headings available for each branch.
Comparing two branches with each other from the customer’s point of view, the deposits attracted by the branch with more favorable and pleasant physical environment regarding the convenience of them, is more valuable, even if its deposit volume is lower. In explaining this claim, we state that part of the resources absorbed by the branch are spent for providing appropriate facilities and equipment that is available to the customers. The more expenditures made in this way, the more respect for the customer, and the more valuable deposits in terms of ethics. Three codes of total costs accounting headings related to office furniture, computer systems, copy and print machine, fees and formalities and other equipment available to the customers are combined to obtain a quantity as the ethical value of resources. According to expert opinion, we take the arithmetic mean of these three numbers to obtain a single number as the weight of deposits output for individual branches applied in constructing EM. It should be noted that the value of some of these three codes is equal to zero for some branches during one (but not two consecutive) year(s).
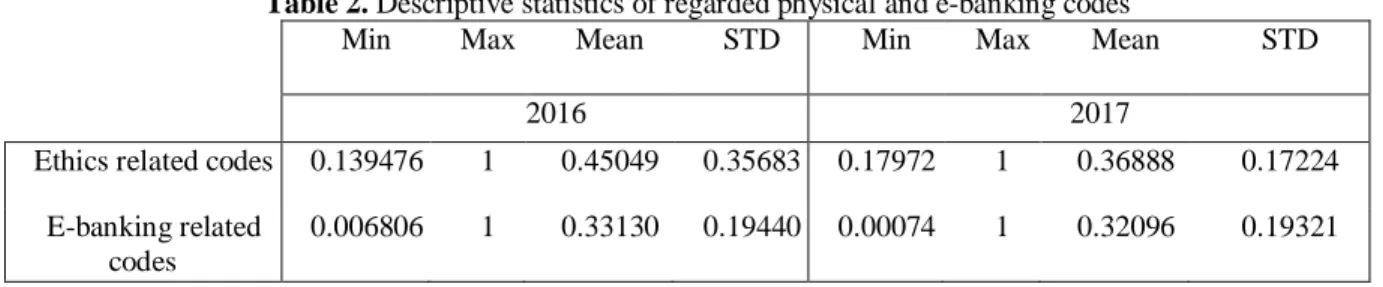
Nowadays, e-banking services have provided more convenience in doing various banking operations. Ethical value of service delivery in a specified branch is related to the number of transactions carried out electronically. Certainly, a branch that has encouraged the customers to do more of their banking activities electronically without physical presence in the branch has saved customers time and money. This will prevent congestion and crowding in the branch’s space and leads to delivering better services and more ethical behavior. So we consider the number of e-banking transactions as the ethical value of services index. In summary, the services provided in the form of non-face to face have more ethical values. Descriptive statistics of codes that will be applied in the model are presented in table 2.
Table 2. Descriptive statistics of regarded physical and e-banking codes
Min Max Mean STD Min Max Mean STD
2016 2017
Ethics related codes 0.139476 1 0.45049 0.35683 0.17972 1 0.36888 0.17224 E-banking related
codes
0.006806 1 0.33130 0.19440 0.00074 1 0.32096 0.19321
The process to combine e-banking codes for each branch in order to get a single number for them is similar to what was used in obtaining output indices above. These numbers have been normalized by dividing them to the maximum. Then they have no units and will be used as the weights of deposits and services for each branch in the model.
13
4-3-EM construction
Having two inputs, three outputs, a number as the relative weight of deposits, and a number as the relative weight of services for each branch, we begin to construct the proposed EM. The relative weight assigned to loans is considered as 1 for all branches. Surely, one can assign another weight to it by defining appropriate codes. The proposed model (3) for evaluating DMUp will be as follows:
𝜃
𝐸𝑀= Min ∑ 𝑣
𝑖𝑥
𝑖𝑝2
𝑖=1
𝑠. 𝑡. ∑ 𝑢
𝑟𝑦
𝑟𝑝= 1
3
𝑟=1
∑ 𝑢𝑟𝑦𝑟𝑗 3
𝑟=1
− ∑ 𝑣𝑖𝑥𝑖𝑗≤ 0 2
𝑖=1
, 𝑗 = 1, … ,66 (14)
𝑢
1𝑢
3=
𝑐
1𝑝𝑐
3𝑝𝑣
𝑖≥ 𝜀, 𝑖 = 1,2,
𝑢
𝑟≥ 𝜀, 𝑟 = 1,2,3,
Where 𝑐1𝑝 and 𝑐3𝑝 are respectively the ethical values of deposits and services of DMUp obtained in previous section. 𝑢1, 𝑢2, and 𝑢3 are the weights of deposits, loans, and services, respectively. In addition,
𝑣1 and 𝑣2 are the weights of personnel expenses and location index, respectively. If we have also an
ethical value for loans, then two other constraints will be added to the model. The EF for DMUp is calculated according to Definition 1.
4-4-EM results
Efficiency scores calculated through the CCR model and EM along with the EF for 10 randomly selected branches are shown in Table 3. An EF equal to 1 means that performance of the related branch in both perspectives of technical efficiency and ethical behavior with respect to considered ethics codes is perfect. The difference between CCR and EM scores shows the effect of adding new constraints to the model (14). Units with lower score changes before and after adding the new ethics constraint have better ethical behavior in related ethics codes.
Table 3. Results of CCR, EM, and EF for selected branches
2016 2017
Branches CCR model EM EF CCR model EM EF
1 65.05301 17.52604 0.27 63.56755 31.84916 0.50
5 47.39608 21.28068 0.45 87.61792 84.66166 0.97
9 72.68236 24.56394 0.34 92.99776 73.88105 0.79
11 39.5729 18.36921 0.46 61.21128 47.83575 0.78
16 60.07314 21.79254 0.36 75.50359 61.68896 0.82
19 90.36221 26.30268 0.29 75.30326 71.39779 0.94
29 82.90729 26.28925 0.32 100 93.19479 0.93
34 50.33676 20.28451 0.40 70.67979 66.30701 0.94
38 57.45192 23.05164 0.40 85.13228 81.8855 0.96
14
As table 3 shows, branch 40 has the highest EF in 2016 and 2017. All models are solved by GAMS software Brooke, Kendrick, Meeraus and Raman (1998).
4-5-EMI results
Four components of EMI given in (14) are computed for all 41 branches and the results for 10 branches selected in the previous section are presented in table 4.
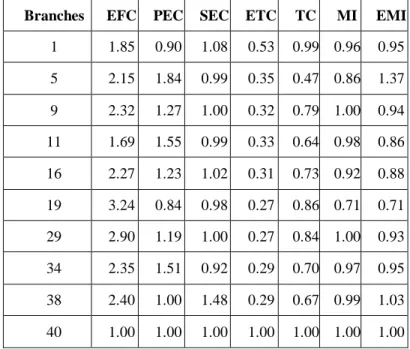
Table 4. MI, EMI, and their components for selected branches Branches EFC PEC SEC ETC TC MI EMI
1 1.85 0.90 1.08 0.53 0.99 0.96 0.95 5 2.15 1.84 0.99 0.35 0.47 0.86 1.37 9 2.32 1.27 1.00 0.32 0.79 1.00 0.94 11 1.69 1.55 0.99 0.33 0.64 0.98 0.86 16 2.27 1.23 1.02 0.31 0.73 0.92 0.88 19 3.24 0.84 0.98 0.27 0.86 0.71 0.71 29 2.90 1.19 1.00 0.27 0.84 1.00 0.93 34 2.35 1.51 0.92 0.29 0.70 0.97 0.95 38 2.40 1.00 1.48 0.29 0.67 0.99 1.03 40 1.00 1.00 1.00 1.00 1.00 1.00 1.00
Productivity growth or decline of these branches in two subsequent periods 2016 and 2017 is clearly evident from table 4. Comparing the first four columns related to EFC, PEC, SEC, and ETC, one can determine each component’s contribution in increasing or decreasing EMI. Specifically, the role of EFC that wasn’t computable so far is now identified and careful analysis can be performed based on it. It is clear from the ETC and TC columns that considering ethical issues can cause significant changes in frontiers. Hence, MI and EMI may show quite different results of growth or decline of productivity change, as DMU5 shows.
5-Conclusion
Productivity change is affected by a variety of factors: the greater the number of them included in measurement, the more accurate the productivity rate obtained. Beside technology, efficiency, and scale, the paper contributes the role of the ethics factor in calculating an extended Malmquist index by introducing EM. The EF of each DMU was defined as the ratio of EM to CCR efficiency scores. The new three- and four-component decompositions of the Malmquist index were developed to provide us with useful information about the sources of productivity growth or decline. The proposed method was applied to a real-world case study selected from bank branches.
15
References
Abbas, M., Hammad, R., Elshahat, M. and Azid, T. (2015), Efficiency, productivity and Islamic banks: an application of DEA and Malmquist index, Humanomics, Vol. 31 No. 1, pp. 118-131. https://doi.org/10.1108/H-03-2013-0022.
Ackoff, R. L. (1974). The social responsibility of operational research. Operational Research Quarterly 25: 361–371.
Ahn, H., Le, & M. H. (2014). An insight into the specification of the input-output set for DEA-based bank efficiency measurement. Manag Rev Q 64: 3. https://doi.org/10.1007/s11301-013-0098-9.
Alirezaee, M. R., & Afsharian, M. (2010). Improving the discrimination of data envelopment analysis models in multiple time periods. International Transactions in Operational Research 17: 667-679. Alirezaee, M. R., & Rajabi Tanha, M. (2015). Extending the Malmquist index to consider the balance factor of decision making units in a productivity analysis. IMA journal of Management Mathematics 27(3): 439-452.
Allen, R., Athanassopoulos, A., Dyson, R. G., & Thanassoulis, E. (1997). Weights restrictions and value judgments in data envelopment analysis: Evolution development and future directions. Annals of Operations research 73: 13-34.
Banker, R. D., Charnes, A., & Cooper, W. W. (1984). Some models for estimating technical and scale in efficiency in data envelopment analysis. Management Science 31: 1078-1092.
Basso, A., Funari, S. (2003). Measuring the performance of ethical mutual funds: a DEA approach.
Journal of Operational Research Society 54(5): 521-531.
Basso, A., & Funari, S. (2007). DEA models for ethical and non ethical mutual funds. Mathematical Methods in Economics and Finance 2(1): 21-40.
Brans, J. P., & Kunsch, P. L. (2010). Ethics in operations research and sustainable development.
International Transactions in Operational Research 17: 427-444.
Brooke, A. D., Kendrick, A., Meeraus, A., & Raman, A. (1998). GAMS: A Use Guide. GAMS Development Corporation, Washington, DC.
Caves, D. C., Christensen, L. R., & Dievert, W. E. (1982). The economic theory of index number and the measurement of input, output, and productivity. Econometrica 50: 1393-1414.
Charnes, A., Cooper, W. W., & Rhodes, E. (1978). Measuring the efficiency of decision making units.
European Journal of Operational Research 2: 429-444.
Churchman, C. W. (1961). Prediction and Optimal Decision: Philosophical Issues of a Science of Values. Prentice-Hall, Englewood Cliffs, NJ.
16
Churchman, C. W. (1979). The Systems Approach and Its Enemies. Basic Books, New York.
Churchman, C. W. (1994). Management science: science of managing and managing of science.
Interfaces 24 (4): 99–110.
Ding, S., Guariglia A., Harris, R., (2016). The determinants of productivity in Chinese large and medium-sized industrial firms, 1998–2007. J Prod Anal 45: 131. https://doi.org/10.1007/s11123-015-0460-0. Fare, R., Grosskopf, S., Lindgren, B., & Roose, P. (1992). productivity change in Swedish analysis pharmacies 1980-1989: A nonparametric Malmquist approach. Journal of productivity 3: 85-102.
Fare, R., Grosskopf, S., Norris, M., & Zhang, A. (1994). Productivity growth, technical progress, and efficiency changes in industrial country. American Economic Review 84: 66-83.
Farrell, M. J. (1957). The measurement of productive efficiency. Journal of the Royal Statistical Society, Series A 120: 253-281.
Frańczuk, M. (2019). Codes of Banking Ethics and Banking Soft Law in Poland. Journal of Vasyl Stefanyk Precarpathian National University, Vol. 6 No. 2: 49-54.
Gass, S. I. (2009). Ethical guidelines and codes in operational research. Omega 37: 1044–1050.
Kleijnen, J. P. C. (2001). Ethical issues in modeling: Some reflections. European Journal of Operational Research 130: 223-230.
Malmquist. S. (1953). Index numbers and indifferent surfaces. Trabajos de Estadistica 4: 209-242. Mohammad, J., Quoquab, F., Omar, R., (2016). Factors Affecting Organizational Citizenship Behavior among Malaysian Bank Employees: The Moderating Role of Islamic Work Ethic, Procedia - Social and Behavioral Sciences, Volume 224, 562-570.
Ormerod, R. J., & Ulrich, W. (2013). Operational research and ethics: A literature review. European Journal of Operational Research 228: 291-307.
Paradi, J. C., & Zhu, H. (2013). A survey on bank branch efficiency and performance research with data envelopment analysis. Omega 41: 61-79.
Podinovski, V. V., & Thanassoulis, E. (2007). Improving discrimination in data envelopment analysis: Some practical suggestions. Journal of Operational Research Society 28: 117-126.
Smith, S. M. (2018). Can a Code of Ethics Reduce Sabotage and Increase Productivity Under Tournament-Based Compensation? An Experimental Study. AAA 2019 Management Accounting Section
(MAS) Meeting. Available at
SSRN: https://ssrn.com/abstract=3234022 or http://dx.doi.org/10.2139/ssrn.3234022.
Sowlati, T., & Paradi, J. C. (2004). Establishing the "practical frontier" in data envelopment analysis.
17
Thanassoulis, E., Portela, M., & Allen, R. (2004). Incorporating value judgments in DEA In: Cooper, W.W., Seiford, L.W., Zhu, J. (Eds.). Handbook on Data Envelopment Analysis. Kluwer Academic Publishers, pp 99-138, Dordrecht.
Triebs T.P., Kumbhakar S.C. (2018). Management in production: from unobserved to observed. Prod Anal 49: 111. https://doi.org/10.1007/s11123-018-0526-x.
Yen, H., (2017). Perception on ethical climate and individual job performance of bank employees.
Journal of Economic Development. 24. 85-98. 10.24311/jed/2017.24.4.4.
Wenstøp, F. (2010). Operations research and ethics: development trends 1966-2009. International Transactions in Operational Research 17: 413-426.