ANALYSIS OF PCBs IN WATER USING HIGH RESOLUTION GAS CHROMATOGRAPHY/HIGH RESOLUTION MASS SPECTROMETRY
Jakal M. Amin (Under direction of J. Ronald Hass, Ph.D.)
Polychlorinated biphenyls (PCBs) in water samples are
generally analyzed by high resolution gas chromatography/low
resolution mass spectrometry (HRGC/LRMS) or high resolutiongas chromatography with electron capture detection (HRGC/ECD).
The detection limits reported using these techniques are on the order of 50-500 parts per trillion (ppt) per sample forthe Mono-Deca PCBs (HRGC/LRMS).
High resolution gas chromatography/high resolution mass spectrometry (HRGC/HRMS) is routinely used for the analysis of polychlorinated dibenzodioxins and dibenzofurans (PCDDs/PCDFs)
in water samples, with detection limits as low as 10 parts per
quadrillion (ppq). This HRGC/HRMS technique has been utilized for the analysis of PCBs in water/wastewater samples and the
results indicate that the detection limits of these species
are at least two orders of magnitude lower (100 ppq range)
than achieved using the low resolution mass spectrometric
technique. Using this technique, PCBs are reported as totals for each isomer group as well as isomer specific analysis for eleven isomers, seven of which are quantified by isotope dilution mass spectrometry. The technique was validated using
blank reagent water samples and then it was applied to measure
TABLE OF CONTENTS
LIST OF TABLES... XV
LIST OF FIGURES... vi
LIST OF ABBREVIATIONS... vii
Chapter £aae I. Literature Review ... 1
A. Introduction ... 1
B. Chemical, Environmental, and Biological Properties ... 4
C. Environmental Occurrence ... 7
D. Toxicological Effects... 8
II. Method Development... 14
A. Introduction... 14
B. The Isotope Dilution Technique ... 17
C. Objectives of Proposed Method ... 18
III. Experimental Section... 22
A. Materials... 22
B. Solutions... 22
C. Water Sample Extraction Procedure .... 27
D. Water Sample Cleanup Procedure ... 27
E. Cape Fear River Water Samples... 30
F. GC/MS Analytical Conditions ... 32
G. Quality Control Criteria and Calculations 41 H. Analyte Identification Criteria ... 42
I. Analyte Relative Response Factor .... 43
J. Initial Calibration Mean RRF... 44
K. Continuing Calibration Delta RRF .... 44
L. Analyte Concentration ... 45
IV. Results and Discussion... 52
A. Calibration... 52
B. Results of Method Performance ... 55
C. Cape Fear River Water Samples... 63
D. The Contribution Problem... 70
E. Conclusion... 78
ACKNOWT.EDGEMENT
I wish to thank all the employees (past and present) of Triangle Laboratories,Inc. of R.T.P. for assisting me through the development of the method. I would especially like to
thank Carol Ritsher for giving me a spare space to do the extraction of samples whenever I needed to in a short amount of time. I would also like to thank Dave Minser, Vijay Chhabra, and Dave Barrow for assisting me in analyzing the samples. I would also like to thank Ed Marti, Dean Marbury, Don Harvan, Yves Tondeur, Mick Chu, and Ron Hass for providing the guidance I needed in developing the method. I would also
like to thank Jim Jersey assisting me in reviewing the Thesis. Finally, I would like to thank my father, Manhar R. Amin, and
mother, Vanlila M. Amin, for supporting me through the good
LIST OF ABBREVIATIONS
ACS American Chemical Society
CIL Cambridge Isotope Laboratories CONCAL Continuing Calibration
DL Detection Limit
EMPC Estimated Maximum Possible Concentration
eV Electron Volts
GC/ECD Gas Chromatography/Electron Capture Detector GC/FID Gas Chromatography/Flame Ionization Detector
GC/MS Gas Chromatography/Mass Spectrometry
GC/TCD Gas Chromatography/Thermal Conductivity Detector
HPLC High Performance Liquid Chromatography
HRGC/HRMS High Resolution Gas Chromatography/High Resolution Mass Spectrometry
ICAL
K-D
LCD
LOQ
mA
Initial Calibration
Kuderna-Danish
Limit of Detection
Limit of Quantitation
ͣ
"T^^SK^^-. ^Bffr^*'jg?-'g;>'^^.gjiaw';i;ftg^^j!jfe!H..a«g^
T JST OF TABT.RS
Table I: Polychlorinated Biphenyls Isomers for Each Homolog... 6
Table II: Composition of Unlabelled PCB Primary Standard Solution... 24
Table III: Initial Calibration Solutions (ICAL)... 25
Table IV: Matrix Spike Solution containing Analytes and Internal Standards ... 29
Table V: GC/MS Analytical Conditions... 35
Table VI: Mass Descriptors used for Selected Ion Recording using HRGC/HRMS 36
Table VII: PCB Window Defining Mix... 40
Table VIII: Quantification Relationship for Analytes... 48
Table IX: Quantification Relationship for Internal Standards... 49
Table X: Quality Control Criteria for Response Factor of ICALs CONCALs . . 50
Table XI: Quality Control Ion-Abundance Ratio Acceptable Ranges ... 51
Table XII: Mean Response Summary of Analytes and Internal Standards... 59
Table XIII: Results of Method Performance Matrix Spiked Samples ... 61
Table XIV: Polychlorinated Biphenyls Results from Cape Fear River (Study 1) ... 65
Table XV: Polychlorinated Biphenyls Results from Cape Fear River (Study 2) .. . 66
Table XVI: Polychlorinated Biphenyls Results from Cape Fear River (Study 3) ... 67
Table XVII: Polychlorinated Biphenyls Results from Cape Fear River (Study 4) ... 68
Table XX: M-1 and M-2 Masses for each Homolog... 74
Table XXI: Polychlorinated Biphenyls Analysis of Aroclor 1232... 75
Table XXII: Polychlorinated Biphenyls Analysis of Aroclor 1254... 76
MDL Method Detection Limit
MFO Mixed-Function Oxidase
PCBs Polychlorinated Biphenyls
PCDDs Polychlorinated Dibenzodioxins PCDFs Polychlorinated Dibenzofurans
PFK Perfluorokerosene
PFTBA Perfluorotributyl amine
QC Quality Control
RRF Relative Response Factor RPD Relative Percent Deviation
RSD Relative Standard Deviation
RTCHK Retention Window Check
SD Standard Deviation
SIR Selected Ion Recording
TLC Thin Layered Chromatography TSCA Toxic Substances Control Act
LIST OF FIGURES
Figure I: Air Sample Analyzed by LRGC/LRMS ... 20
Figure II: Air Sample Analyzed by HRGC/HRMS ... 21
I. Literature Review
A. Introduction:
Polychlorinated biphenyls (PCBs) are a class of
compounds comprised of 209 discrete isomers or congeners, in
which one to ten chlorine atoms are attached to the common biphenyl structure.
4'
Polychlorinated biphenyls were commercially produced
as complex mixtures for a variety of uses. From 1930 to 1977
the Monsanto Corporation was the major producer of PCBs which
marketed for use in transformers, capacitors, printing inks, paints, pesticides, and many other applications (Durfee et
al., 1976, Alford-Stevens 1986).
Since PCBs are particularly stable compounds in terms of their chemical and physical characteristics, they
have given rise to environmental contamination problems. PCBs
do not readily degrade in the environment after disposal or
dissemination. In addition, they are lipophilic, persistent and consequently tend to bioaccumulate. Occupational exposure to PCBs was reported to cause toxic effects as early as 1936
and subsequently workplace threshold limit values were set.
The animal toxicological data have tended to indicate that
PCBs are toxic. However, contamination of the commercial PCB
mixtures with more toxic compounds such as polychlorinated dibenzofurans (PCDFs) and polychlorinated dibenzodioxins (PCDDs) confound clear interpretation of their toxic effects. It has been shown that the toxicity of PCB varies with both
homolog and isomer (Safe et al. 1983).
the ban under TSCA if the manufacture, processing, and
commercial distribution were enclosed or if it did not
present an unreasonable risk of injury to human or the environment. The USEPA has subsequently promulgated a series of rules with respect to PCBs under various guidelines of
TSCA.
The disposal of PCBs has been a major concern since
the imposed restriction upon PCBs use in the United States and other countries. Large quantities of PCBs-containing products such as transformer oils and capacitors are being removed from service and they must be disposed of properly. In 1979, USEPA set disposal guidelines that were dependent on the concentration and matrix in which the PCBs existed. For example, if the PCBs concentration was 500 ppm or greater, disposal in a high efficiency incinerator was stipulated
(Erickson, 1989). If the concentration of PCBs was found to be
between 50 and 500 ppm and they were in a liquid matrix such as a mineral oil dielectric fluid, then incinerators, landfills, or high efficiency boilers were allowed to be used
for disposal. Alternate methods of disposal were also allowed
•jW«*i;',^jy5a!a.^jJ^p^iJiJl-WMfty" Wjllg^jln?jWag5BJS"'ͣ'^^
B. Chemical. Environmental. and Biological Properties i
PCB Nomenclature
A PCB is. one of 209 compounds having the formula
monochlorobiphenyl through
decachlorc biphenyl, with the general structxire:
^ia^io-n^-'-n where n = 1-10; i.e
CIm
CIn
m +n = 1to10
The term "PCBs" is used to refer to the entire class
or any subset of one or more compounds. The entire set of 209
PCBs form a set of congeners. When PCBs are further
ͣ
PART.p; T; POLYCHLORTNATED ISOMTgPS FOR EACH HOMOLOG
Homo log _____Molecular Formula No. of Isomers
Monochlrobiphenyls C,2H9C1 3
Dichlorobiphenyls C^gHgClj 12
Trichlorobiphenyls C^jH^Clj 24
Tetrachlorobiphenyls C^jH^Cl^ 42 Pentachlorobiphenyls C^gHjClg 46
Hexachlorobiphenyls C^2H4Clg 42 Heptachlorobiphenyls C^j^sCl^ 24 Octachlorobiphenyls C^^H^'^^a ^^ Nonachlorobiphenyls C^j^Cl, 3 Decachlorobiphenyl C^jCI^q 1
C. Environmental Occturrence
Polychlorinated biphenyls may be considered
ubiquitous pollutants. They have been found in nearly all
plant and animal species including fish, mammals, birds, bird
eggs, and humans. The environmental transport of PCBs is
complex and global. Polychlorinated biphenyls are transported
by air, water, fish, birds, and other routes. They are
deposited from air by rain, snow, dry fall-out, and
vapor-deposition. Since . PCBs have high lipid-water partition
ratios, they tend to accumulate in fatty tissues and thus
biomagnify in the food chain. The long-term distribution in
adipose tissue is adipose > skin > liver > muscle > blood
(Safe, 1980).
PCBs are very stable compounds; however, under
certain conditions, they may be destroyed by chemical,
thermal, and biochemical processes. The degradation processes
usually require high temperatures or catalysis. Environmental
and metabolic degradation generally proceed quite slowly
relative to degradation of most other compounds. Their
destruction has generally been limited to incineration,
although some chemical degradation processes such as
dechlorination with metallic sodixom are permitted in the
United States and other coiintries. Several nonthermal
and developed. The chemical techniques include adsorption,
catalytic de-hydrochlorination, ozonation, photolytic
degradation, wet air oxidation (Ackerman, et al., 1981).
In the environment, photolysis is the only significant chemical degradation process (Hutzinger et al.,
1972). The half-lives for atmospheric photodegradation are dependent upon the degree of chlorination. The half-lives of the monochlobiphenyls range from 0.62 to 1.4 days, while
pentachlorobiphenyls have a half life of 67 days (Billing et al., 1983). The microbial degradation of PCBs depends upon
the degree of chlorination and the position of the chlorine
atom on the biphenyl molecule. Lower chlorinated homologs are readily transformed by bacteria, but the higher chlorinated
homologs are not (Moolenaar, 1983). Ortho substitution generally decreases the rate of their degradation by microbes.
The major by-products of microbial degradation of PCBs are
conjugated and/or free hydroxychlorobiphenyls (Messier et.
al., 1983). Furiikawa et al. (1978) found that PCBs with a
nonchlorinated ring degraded faster, with preferential fission
of the unsubstituted benzene rings.
D. Toxicoloqical Effects
seven chlorine atoms per molecule. These chlorinated isomer groups (penta-, hexa-, and hepta-chlorinated biphenyls) contain 112 of the 209 possible PCB configurations. They were synthesized in high proportions in many Aroclor formulations and thus are likely to be prevalent in environmental matrices (Alford-Stevens, 1986, Hutzinger, et al., 1974). The chlorinated isomer groups also contain most of the mixed function oxidase (MFO)-inducing congeners. The more highly chlorinated congeners are generally less bioavailable because they are more tightly bound to .soils and sediments and because they usually are present in lower quantities in the environment. Congeners with less chlorination are more readily metabolized and eliminated and consequently tend to bio-accumulate less (Goldstein, et al., 1977); Safe, et al.,
1982; Bush, et al., 1985).
PCBs are not acutely toxic to aquatic bio-organisms in the natural environment. The USEPA water quality criteria docviment for PCBs noted that problems possibly could exist with the validity of acute toxicity tests because of the low solubility of PCBs in water and because the solubilities of PCBs are less than their acute toxicities (USEPA, 1980). The
toxic potency of individual congeners vary by as much as six orders of magnitude (Storm, J. E.; et al. 1981). Experiments which involved exposing saturated aqueous solutions of pure
for 48 to 96 hrs. resulted in no mortalities that were
attributable to PCB toxicity (McFarland, et al. 1989). These results are consistent with the work of other researchers who found that water solubility was the primary determinant of acute toxicity of a series of hydrocarbons and
chlorohydrocarbons to Daphnia macma and Artemia salina
(Abernethy, et al. 1986). The researchers also noted that
since there is a trend for larger molecules to be less soliible in octanol. They also may be less soluble in the lipids of organisms. Such large molecules (e.g. PCBs) may conseguently
partition less readily into sites of toxic action within
cells. Kinetic factors also influence acute toxicity, and larger molecules may take longer to establish concentrations necessary to produce toxic manifestations due to their lower diffusivity in water and lipid phases (Abernethy, et al.
1986).
Toxic effects of aquatic environmental PCB
biotransformation of foreign compounds are metabolic activities in both fish and higher vertebrates that are strongly influenced by terminal oxidase activities of the microsomal cytochrome P-450 systems (referred to also as mixed-function oxidase (MFO) systems). Some, although not all, PCB congeners are MFO inducers in fish, mammals, and birds, and to a lesser extent in aquatic invertebrates
(McFarland, et al. 1989).
The potency and specificity of MFO induction by individual PCB congeners can be directly related to how closely they approach the molecular spatial configuration and distribution of forces of 2,3,7,8-tetrachlorodibenzo-p-dioxin (2,3,7,8-TCDD). Isomers that are similar in structure are the non-, mono-, and some di-ortho-substituted PCBs (Williams, L. L., et al. 1992). 2,3,7,8-TCDD is generally considered to be the most potent synthetic environmental toxicant and thus is regarded as a standard for comparison for other organic toxicants that are more or less isoteric, including some of the PCBs (Kociba, et al. 1985; Safe, et al. 1985; Safe, et al. 1987). Dioxins are chlorinated aromatic molecules that form a planar volvime in the form of a box or rectangle occupying about 3 by 10 Angstrom (McKinney, et al. 1981). The cytosolic receptor that binds 2,3,7,8-TCDD or its isosteres to the Ah
receptor is facilitated by coplanarity of the phenyl rings
the polarizability of the lateral chlorines may be important in determining the strength of binding to the receptor (Albro, et al. 1981). Translocation of the inducer-receptor complex
to the nuclear Ah locus is thought to initiate the synthesis
of AHH, EROD, and related enzymes that may be involved in
either biotransformation, conjugation and removal, or the bioactivation of certain planar lipophilic foreign compounds
to toxic intermediates (Nebert, et al. 1979; Safe, et al.
1983; Roberts, et al. 1985).
The most toxicologically active PCB congeners are
those having chlorine svibstitution at the para (4 and 4') and
at least two meta (3,3',5 and 5') positions on the biphenyl
rings, but no ortho (2,2',6 and 6') siobstitutions (Safe, et
al. 1985). Since the phenyl rings of a biphenyl nucleus are
linked by a single carbon-carbon bond, the two rings have
relatively unconstrained rotational freedom. Unlike dioxins
or dibenzof urans, the phenyl rings of PCBs are not rigidly
bound in the same plane. X-ray crystallographic analyses
indicate that the preferred conformation for all PCBs,
including those without ortho-substituents, is noncoplanar
(McKinney, et al. 1981). The proportion of molecules of a
particular congener assuming a coplanar configuration becomes
increasingly small as the energetic cost of conforming
increases (McKinney, et al. 1981). Since chlorines are bulky
the biphenyl rings inflicts constraints on rotational freedom. The greatest effect is exerted by substitution of at least two
opposing ortho-substituted chlorines on opposite rings. Increasing the number of chlorine ate tis at the ortho positions
increases steric hindrance to rotation (Lau S. et al. 1981; Boon, J. P. et al. 1987).
PCBs have been shown to cause reproductive toxicity, birth defects, and behavioral changes in aquarian animals (Levin, E. D., et al. 1988; Tilson, H. A., et al. 1979) and they have also been associated with low birth weights and
learning and behavioral deficits in children of women who
consumed large (>50 meals/yr. 100-g meals) quantities of fish from the Great Lakes (Williams, L. L. et al. 1992). The toxic
potencies of PCB mixtures are dependent upon the relative
concentrations of individual congeners. It has been shown
that the most potent PCB congeners are also some of the
congeners most resistent to degradation and metabolism
(Tanabe, S. et al. 1987). As a result, there has been concern that risk assessments based on total concentrations of PCBs
are inaccurate because measurement of total concentrations of PCBs may not reflect the potency of the PCB mixture to cause
II. Method Development:
A. Introduction:
Over the past twenty years, environmental analysis
has grown tremendously due to technical advances made in the
instrumental analysis. The major techniques which are used to
determine the amoiint of pollutants present in the environment
are GC/ECD (Gas chromatography/electron capture detector),
GC/FID (Gas Chromatography/Flame Ionization detector), HPLC
(High Performance Liquid Chromatography, and TLC (Thin Layer
Chromatogrpahy) and GC/MS (Gas Chromatography/Mass
Spectrometry). Two methods by which the environmental
analysis are performed in GC/MS are the full scan analysis and
the SIR (Selected Ion Recording). The full scan analyses are
ii*9t^L\tsr.r;rrif^iM!atl^imiSfim^ »i»llMilHjSJ.J .f!B^
either full scan or SIR analyes.
There are basically seven factors which have to be
considered where the analysis of PCB is concerned: 1) limit
of detection required, 2) anticipated number, level, and type
of interferences, 3) resolution needed 4) qualitative
discrimination power, 5) quantitative accuracy and precision,
6) availability of instrumentation, and 7) analysis time and
cost (Erickson, 1986). There is no technique that best
satisfies the above criteria. The extraction, cleanup, and determination technique are all interrelated and must be
considered in the development of the method. The qualitative
discrimination power of a detector plays a major role in
selection of the measurement technique. For example, if the
concentrations of PCBs are high enough and the interferences
are minimal, a low resolution detector such as GC/FID or
GC/TCD (Gas Chromatography/Thermal Conductivity Detector) may
be appropriate. If additional discrimination power is
required and there are few non-electron capturing compounds in
the matrix, then GC/ECD may be appropriate. In all of these
cases above, PCB mixtures are identified by pattern
recognition. When visual pattern recognition cannot be used
qualitative confidence is required a more discriminating
technique such as HRGC/HRMS (High Resolution Gas
Chromatography/High Resolution Mass Spectrometry) must be
employed.
Today one of the most widely used instrument for the
analysis of pollutants in the environment is GC/MS. There are
basically two types of GC/MS instrumentation available:
Quadrupole and the Magnetic Sector. GC coupled with
quadrupole mass spectrometry is the most widely used
instrument for environmental analysis due to its low operating
costs and the ease of its use. Over the past ten years,
HRGC/HRMS has started to play a major role in the
environmental industry due to increasing demands for the high
sensitivity and selectivity it can provide. The USEPA has
implemented many low resolution methods such as Method 680,
Method 8080, Method 608, etc. for the analysis of PCBs. As
discussed above, depending on the type of matrix and the
interferences present, different methods may have to be used
to determine the concentration of PCBs in a given matrix.
Another problem is that quantification of PCB analytes in a
particular matrix is done using compounds which are not PCBs
(Alford-Stevens, et al. 1985; Hernandez, et al. 1987). For
example Method 680 involves the use of chrysene-d^j or
napthalene-dg as the internal standard in order to quantify
and PCBs are not similar compounds, the extraction and the
cleanup procedures do not affect the PCBs and the internal
standards in a similar manner. As a result, data may be
skewed in quantifying the analytes depending on whether the
internal standards were affected in the same manner as the
analyte during the extraction and the cleanup procedures.
B. The Isotope Dilution Technique;
Over the past 20 years, the technique of isotope
dilution has revolutionized environmental analyses. The
growth of environmental analyses has been partially due to the
increasing availability of compounds labeled with stable
isotopes and the advances in instrumentation for isotope ratio
measurement (Pickup, J. et al. 1976). Although the general
principles of the isotope dilution technique are generally
agreed upon (Colby, et al. 1979), there is basically no
guidance available to the analyst on the theory behind stable
isotope dilution assays when applied to organic analysis
(Schoeller, D. A. (1976); Matthews, D. E. et al. (1976);
Colby, et al. 1981). Pickup and McPherson explained the
fundamental theory of isotope dilution mass spectrometry in
organic analysis using the binomial probability theory to
evaluate the effect of changing isotopic abiindance on the mass
stable isotope dilution analysis can be viewed as a
special case of internal standardization in which the internal
standards mimic the target analyte behavior as closely as
possible. In the isotope dilution technique, the only difference between the analyte and the internal standard is a
small difference in the molecular mass. The analyte and
internal standards are thus chemically and physically equivalent, an ideal situation from an analytical standpoint. Processes and factors affecting the analyte similarly affect
the internal, standards. As a result, the "internal
standard/analyte ratio" is an isotope ratio that must be measured by mass spectrometry. The technique involves perturbing the normal isotopic composition of the sample by
adding a known quantity of an isotopically enriched analog of
the material being determined. The assumption is made thatextraction technigue and the GC/MS analysis will affect the analyte and the internal standard in a similar manner. The isotopically labelled compounds serve to correct the
variability in the method which may be caused by failures of the internal standards to exactly mimic analyte behavior
(USEPA 1985, Erickson, M. D., et al. 1988).
C; Objectives of the Protxased Method
sensitive. On page 20, there is an illustration of tetrachloro PCBs channel of an air sample which was analyzed by HRGC/LRMS (Trio-1) (Figure I). The sample was analyzed by SIR at a approximate resolution of 1,000. On page 21, Figure II shows the same sample that was analyzed by HRGC/HRMS at
resolving power of 10,000. From two figures it can be
oberseved that Figure I show very few detected peaks of tetrachloro PCBs. On the other hand. Figure II shows many
peaks which were detected as tetrachloro PCBs. The figures
illustrate that bias (false negatives) in the results can occur depending on what kind of method is being used to analyze the environmental saamples. As a result, development of a new method of analysis of selected toxic PCBs in water
using the HRGC/HRMS has been designed to quantify PCBs with high sensitivity and selectivity using isotope dilution technique. The method has been designed to accurately quantify specific PCBs in water to parts per quadrillion (ppq) levels with high precision and accuracy and to determine the
FIGDRE I. AIR SJ^MPLE ANALYZED BY LRGC/URMS
17-NOM-92 19:49 Triangle Laboratories of RIP, l«c.
<^,^y^^ͣ. MM.q-2 22055ft
GK83a Tetra CI PCB
(919) 544-5729 Instruwent G
26.12- 75584
lee-i
i>!FSi
24.15 24
21.31
867fi8 22,96
IBBi
22,31 21.66
HfflBtJi^^i^§aiE.8^Hsi''^^saJX-Bse.
Pile:J{g2iaai #l-8fi7 Acq: 5-N6V-19g2 22:17:32 (SC El+ Voltage SIR
AutoSpec---289.9224 F:2 Exp:CO-PCB
San^letl Text:MM5-2 TLI# 22055A File Text:TRIANGLE LABORATORIES,INC. OF RTP::DB5
100^ 25 08
90J80. 70. 60J 50J 40j 30j 20J 10. 0.
rrr. -r I I I I I I
19:00 1 1 I I I I20:00
] -i I' [' I t
21:00
26:24 24:45
23:52
25:48 17:00 18:00
File:X921881 #1-867 Acq: 5-NOV-1992 22:17:32 GC EI+ Voltage SIR AutoSpec
291.9194 F:2 Exp:CO-PCB
San5>le#l Text:MM5-2 TLI# 22055A File Text:TRIANGLE LABORATORIES,INC. OF RTF:
100 25 08
90J aoi 70. S04 50. 40J 30J 20J lOj 0 27:40
ii
I I 1 I I I ͣ! I I I 1 i "^ ''Oi 1^1 I ͣ/ Vi'' 1^ I r i')"^ T 'i ^ I ? r r I" H"i'Ti 22:00 23:00 24:00 25:00 26:00 27:00 28:00
.1.3E6 .1.1E6
.1.0E6 .8. 8E5
;DB5
i 1 I I I -I 'i I r I I I
17:00 18:00 19:00 20:00I'll'
23:52 24:4£
26:25
21:00 22:00 23:00 24:00
25:47
III. Experimental Section:
A. Materials:
All compounds used in this study were the highest
purity available. Individual PCB isomers and their
corresponding carbon-labelled internal standards were obtained
from Cambridge Isotope Laboratories (CIL) (Woburn, MA).
Reagents such as hexane, nonane, acetone, methylene chloride,
sulfuric acid, potassium hydroxide, and HPLC graded water wereobtained from Fisher Scientific (Fair Lawn, NJ).
B. Solutions:
A stock solution of analytes was prepared in nonane
ͣ
KS^SP^^**!:
samples.
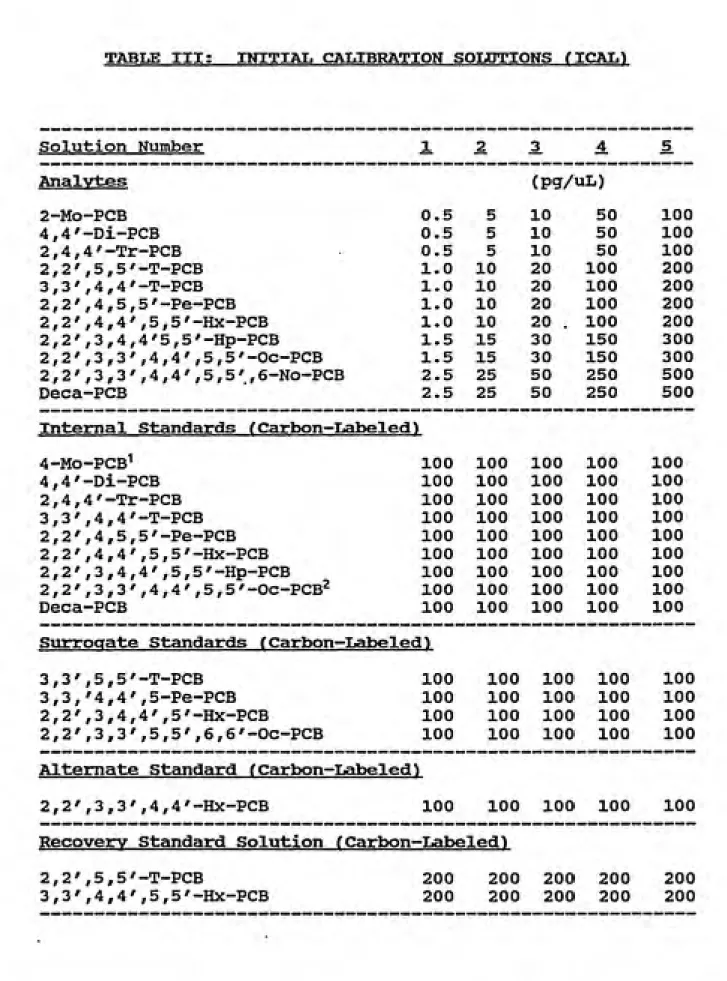
The initial calibration solutions were prepared at 0.5, 5.0, 10.0, 50.0, and 100.0 pg/uL from the primary stock
solution. These concentrations doubled for each Cl^ - Clj PCB
congener, tripled for each Cl^ - Clg PCB congener, and
quintupled for each CI9 - CI^q PCB congener (Table III). The
solutions 1 through 5 contained 100 pg/uL, 100 pg/uL, and 200 pg/uL each of internal standards, surrogate and alternate standards, and recovery standards, respectively. The alternate and surrogate standards were spiked in the extract before the cleanup procedure and the recovery standards were
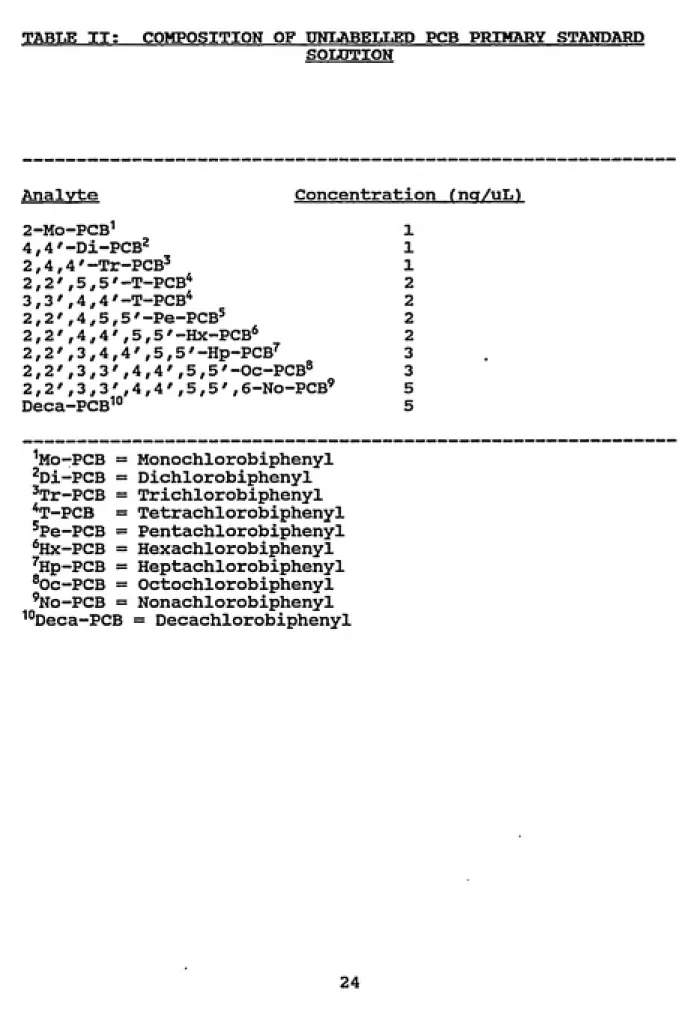
TABLE II: COMPOSITION OF UNLABELLED PCB PRIMARY STANDARD SOLOTION
Analyte Concentration fng/uL) 2-Mo-PCBi
4,4'-Di-PCB^ 2,4,4'-Tr-PCB^ 2, 2 ' , 5 , 5 ' -T-PCB"^ 3 , 3 ' , 4 ,4 '-T-PCB* 2 , 2',4,5,5'-Pe-PCB^ 2,2',4,4',5,5' -Hx-PCB'^ 2, 2 ' , 3 ,4 ,4 ' , 5 ,5'-Hp-PCB^'
TABLE III: INITIAL CALIBRATION SOLDTIONS fICAL) Solution Number Analvtes 2-Mo-PCB 4,4'-Di-PCB 2,4,4'-Tr-PCB 2 , 2',5,5'-T-PCB 3 , 3',4,4'-T-PCB 2,2',4,5,5'-Pe-PCB 2,2',4,4',5,5'-Hx-PCB 2,2',3,4,4'5,5'-Hp-PCB 2,2',3,3',4,4',5,5'-Oc-PCB 2,2',3,3',4,4',5,5',6-No-PCB Deca-PCB (pg/uL)
0.5 5 10 50 100
0.5 5 10 50 100
0.5 5 10 50 100
1.0 10 20 100 200 1.0 10 20 100 200 1.0 10 20 100 200 1.0 10 20 . 100 200 1.5 15 30 150 300 1.5 15 30 150 300 2.5 25 50 250 500 2.5 25 50 250 500
Internal Standards fCctrbon-Labeled^
4-Mo-PCB^ 4,4'-Di-PCB 2,4,4'-Tr-PCB 3,3',4,4'-T-PCB 2,2',4,5,5'-Pe-PCB 2,2',4,4',5,5'-Hx-PCB 2,2',3,4,4',5,5'-Hp-PCB 2,2',3,3',4,4',5,5'-Oc-PCB^ Deca-PCB
100 100 100 100 100 100 100 100 100 100 100 100 100 100 100 100 100 100 100 100 100 100 100 100 100 100 100 100 100 100 100 100 100 100 100 100 100 100 100 100 100 100 100 100 100
Surrogate Standards (Carbon-Labeled)
3,3',5,5'-T-PCB
3,3,M,4',5-Pe-PCB 2,2',3,4,4',5'-Hx-PCB
2,2',3,3',5,5',6,6'-Oc-PCB
100 100 100 100 100 100 100 100 100 100 100 100 100 100 100 100 100 100 100 100
Alternate Stemdard (Cctrbon-Labeled)
2,2',3,3',4,4'-Hx-PCB 100 100 100 100 100 Recovery Standard Solution (Carbon-Labeled)
2,2',5,5'-T-PCB
3,3',4,4',5,5'-Hx-PCB
Tctble III: Continued
^The Mo-PCB Internal Standard is "c^ and not a
^^C^g-^The Oc-PCB (Carbon-Labelled) is used to compute response
C. Water Sample Extraction Procediure:
To each 1-L water sample (adjusted to pH = 7.0) in
a 2-L separatory funnel 100 uL, (Pipet delivery) of the
matrix spike solution containing unlabeled analytes was
added (Table IV). After spiking unlabelled PCBs, each
separatory funnel was spiked with 100 uL of the acetone
solution containing carbon-labeled internal standards (Table
IV). The sample was then shaken rigorously for two minutes,
and allowed to stand for at least thirty minutes to allow
equilibrium of the spiked compounds with the matrix. Each
1-L fortified water sample was then extracted with three
sequential 60-mL portions of methylene chloride.
After the extraction was completed, each extract
was dried by filtering through anhydrous sodium sulfate
using a glass funnel with glasswool. The extract was
concentrated to approximately 5.0 mL using a Kuderna-Danish
(K-D) apparatus. To each extract 40.0 mL of hexane was
added and it was again concentrated to approximately 5.0 mL
using the K-D apparatus. Each extract was then stored in
the refrigerator at 4 °C until cleanup procedures were
performed.
The final extract in hexane was transferred
(Pasteur Pipet) to a 200 mL separatory flannel. It was then
spiked with 100 uL (eppendorf) of an acetone solution
containing carbon-labeled surrogate and alternate standards
(Table IV). The contents of the separatoiry funnel were then
rinsed with three sequential 40 mL portions of sulfuric acid
and 40 mL portions of HPLC graded water. The hexane extract
residue was rinsed with 40 mL of 20% (by weight) potassixim
hydroxide solution and 40 mL of HPLC graded water. The
extract was then transferred to a K-D apparatus and
concentrated to an approximately 10.0 mL voliime. The
extract was then finally transferred to 13 mL test tubes and
TABLE IV: MATRIX SPIKE SOLDTION CONTAINING ANALYTES AND INTERNAL STANDARDS Analvtes 2-Mo-PCB 4,4'-Di-PCB 2,4,4'-Tr-PCB 2,2',5,5'-T-PCB 3,3',4,4'-T-PCB 2,2',4,5,5'-Pe-PCB 2,2',4,4',5,5'-Hx-PCB 2,2',3,4,4'5,5'-Hp-PCB 2,2',3,3',4,4',5,5'-Oc-PCB 2,2',3,3',4,4',5,5',6-No-PCB Deca-PCB (pq/uL) 5 5 5 10 10 10 10 15 15 25 25
Internal Standards (Carbon-Labeled)
4-Mo-PCB 100
4,4'-Di-PCB 100
2,4,4'-Tr-PCB 100
3,3',4,4'-T-PCB 100
2,2',4,5,5'-Pe-PCB 100
2,2',4,4',5,5'-Hx-PCB 100
2,2',3,4,4',5,5'-Hp-PCB 100
2,2',3,3',4,4',5,5'-Oc-PCB 100
Deca-PCB 100Surxoqate Standards (Carbon-Labeled)
3,3',5,5'-T-PCB 100
3,3,'4,4',5-Pe-PCB 100
2,2',3,4,4',5'-Hx-PCB 100
2,2',3,3',5,5',6,6'-Oc-PCB 100
Alternate Standcurd (Ccurbon-Labeled)
2,2',3,3',4,4'-Hx-PCB 100
Recovery Stcundctrd Solution (Czirbon-Lctbeled)
2,2',5,5'-T-PCB
3,3',4,4',5,5'-Hx-PCB
E. Cape Fear River Water Sainpl (Ps ;
Cape Fear River water samples were collected from
a boat dock located 20 miles North East of the city of
Sanford, N.C. (See Figure I). The water grab sample was
collected by dipping a 1500 mL glass jar in the river. Two duplicate samples were collected from each of four places
(Places A, B, C, and D in Figure I). An effort was made to collect the water samples near the wastes discharged by the pulp industry and the electrical plants located along the
Cape Fear river. After the samples were collected, they
were stored in the refrigerator at 4 °C for one day before
extraction and the cleanup procedures. Prior to extraction,
the glass jars were shaken vigorously for approximately two
minutes to resuspend any solid before the water samples weretransferred to the separatory funnels. The pH of the
samples was then measured. The pH was adjusted to 7.0 using sulfuric acid prior to extraction if necessary. To the
separatory fxonnel, 500 mL of the water samples were
transferred from the glass jars and the sample extraction
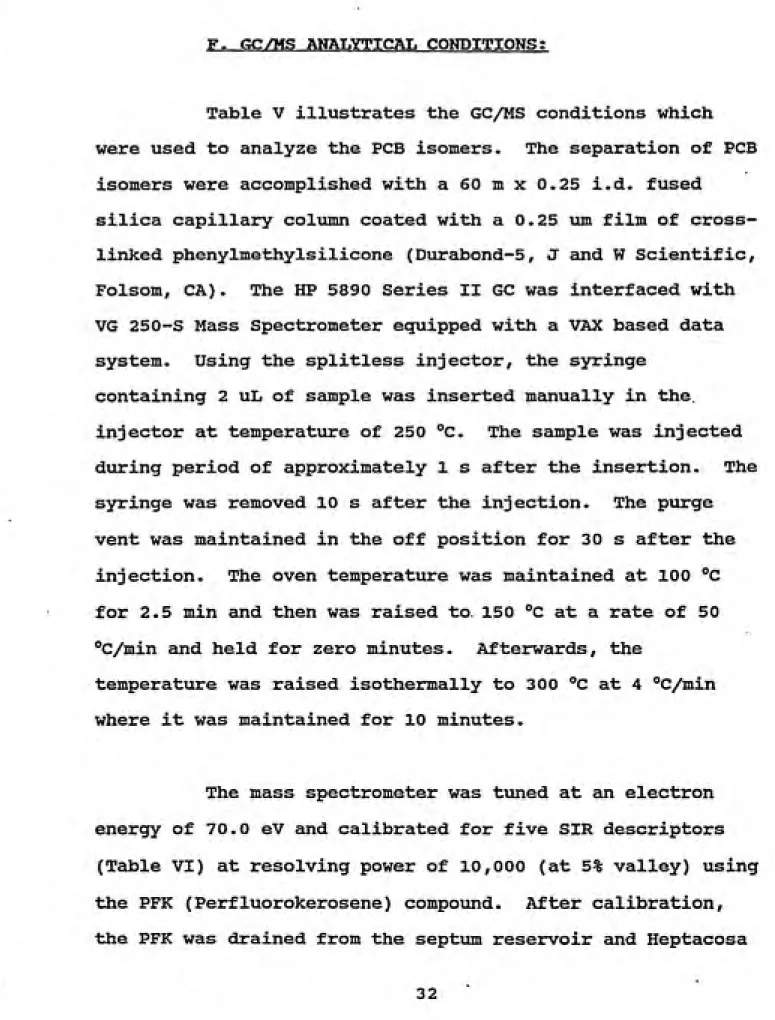
and cleanup procedures were followed as the fortified asF. GC/MS ANALYTICAL CONDITIONS;
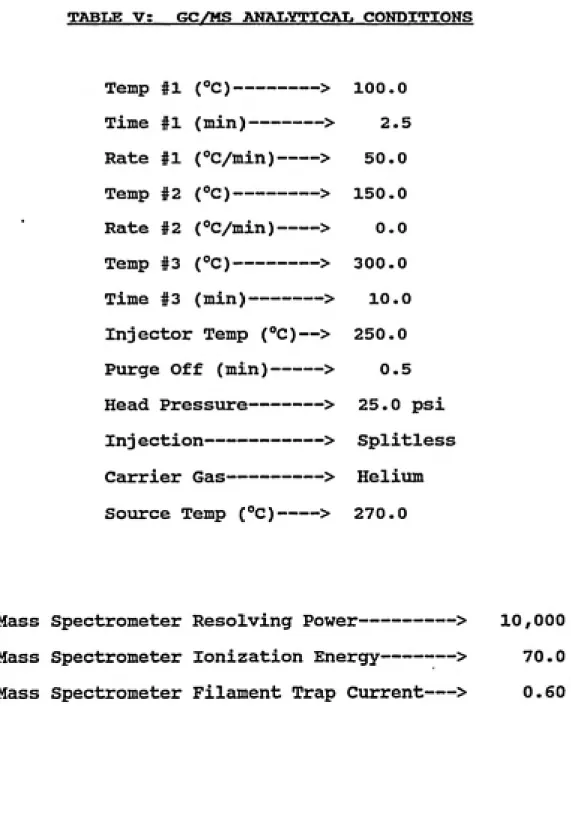
Table V illustrates the GC/MS conditions which
were used to analyze the PCB isomers. The separation of PCB
isomers were accomplished with a 60 m x 0.25 i.d. fused
silica capillary column coated with a 0.25 um film of
cross-linked phenylmethylsilicone (Durabond-5, J and W Scientific,
Folsom, CA). The HP 5890 Series II GC was interfaced with
VG 250-S Mass Spectrometer equipped with a VAX based data
system. Using the splitless injector, the syringe
containing 2 uL of sample was inserted manually in the
injector at temperature of 250 °C. The sample was injected
during period of approximately 1 s after the insertion. The
syringe was removed 10 s after the injection. The purge
vent was maintained in the off position for 30 s after the
injection. The oven temperature was maintained at 100 °C
for 2.5 min and then was raised to 150 °C at a rate of 50
"C/min and held for zero minutes. Afterwards, the
temperature was raised isothermally to 300 °C at 4 °C/min
where it was maintained for 10 minutes.
The mass spectrometer was tuned at an electron
energy of 70.0 eV and calibrated for five SIR descriptors
(Table VI) at resolving power of 10,000 (at 5% valley) using
the PFK (Perfluorokerosene) compoxind. After calibration,
(Perfluorotributyl amine [PFTBA]) was introduced in to the
septum reservoir. Ions from PFTBA were used as lock-mass
and QC (Quality Control) ions to monitor the performance of
mass spectrometer during the course of analysis (TABLE VI).
After the mass spectrometer and the GC were
checked (e.g. GC leaks or arching), a solution of Retention
Window Check (RTCHK) (Cambridge Isotope Laboratories, MA)
[Table VII] was injected to define the GC window of each PCB
isomer group. Acquisition times were adjusted if the proper
acquisition windows were not defined, and the RTCHK was
reinjected accordingly.
Once the GC elution of PCB isomers was defined,
five pt. ICAL solutions were (Table III) injected to
determine the response factors of PCB isomers and thus
the response of the GC/MS. Once the ICAL passed Quality
Control (QC) criteria (discussed in a later section), the
sample extracts were analyzed on GC/MS. A Continuing
Calibration Solution (CQNCAL) was injected every twelve
hours to check the performance of GC/MS by comparing the
CONCAL and ICAL response factors. If CONCAL response
factors did not meet the QC criteria, a new ICAL was done
and the next set of samples were analyzed.
manipulate GC/MS data. Special software (dBASE IV) was developed for automated data interpretation of samples as
well as the calculation of ICAL and CONCAL response factors.
The mass spectral data was integrated using the Peak Detect
program available on the VAX data system. Using the dBASE
IV software, the PCBs were automatically identified by level
of chlorination. The calculations and QC criteria used to
identified PCBs are discussed in a later section of this
report. A preliminary data report was generated for each
sample indicating the peaks that passed all initial criteria
and were identified as PCBs, and listed the reasons some peaks were rejected, and subjected to further testing. Extensive data review was then performed to check the integration of peaks in the chromatograms as well as
perfonnance of the dBASE IV software. Once the data review
was completed, a final report of the sample was generated
which provided the concentrations of the specific congeners (Table II) monitored as well as the total concentration of
each PCB isomer group. The report also provided EMPC (Estimated Maximum Possible Concentration) for peaks
detected but did not pass the quality control criteria due
to the possible matrix interferences or instrument
TABLE V: GC/MS ANALYTICAI. CONDITIONS
Temp #1 (°C)---> 100.0
Time #1 (min)---> 2.5
Rate #1 (°C/min)----> 50.0 Temp #2 (°C)---> 150.0
Rate #2 (°C/min)----> 0.0
Temp #3 (°C)---> 300.0
Time #3 (min)---> 10.0
Injector Temp (°C)—> 250.0 Purge Off (min)---> 0.5 Head Pressure---> 25.0 psi Injection---> Splitless Carrier Gas---> Helium Source Temp (°C)----> 270.0
^SItW>v-'»i.
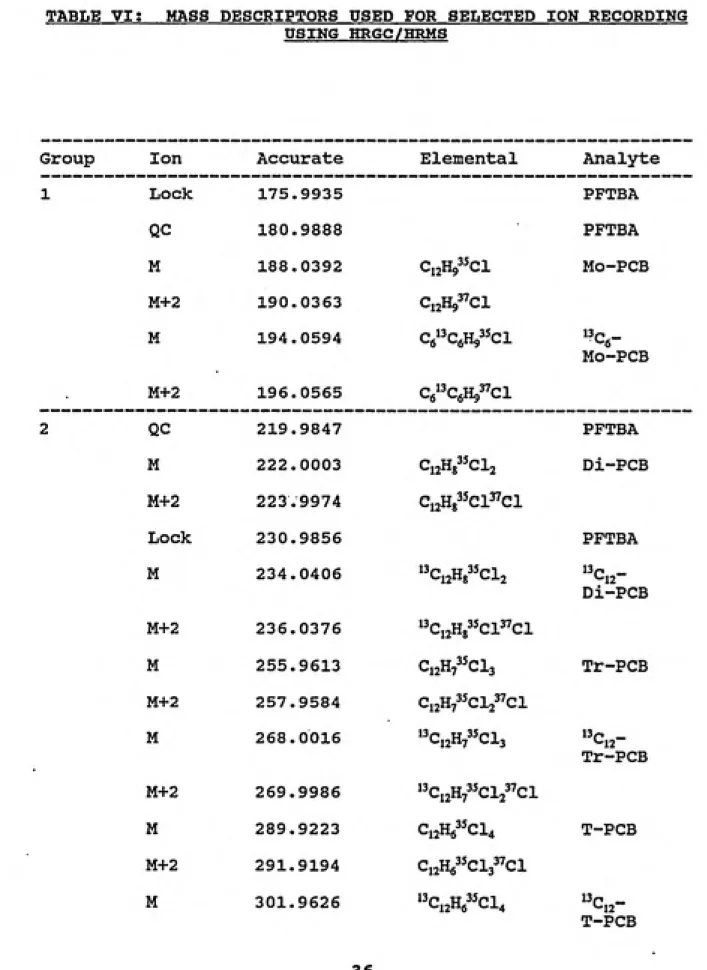
TABLE VIt MASS DESCRIPTORS USED FOR SELECTED ION RECORDING USING HRGC/HRMS
Group Ion Accurate Elemental Analyte
1 Lock 175.9935 PFTBA
QC 180.9888 PFTBA
M 188.0392 ^12"9 ^ ͣ'• Mo-PCB M+2 190.0363 CijHg^Cl
M 194.0594 Cg^CgH^^^ci
MO-PCB M+2 196.0565 Ce'^CfiH^^Cl
2 QC 219.9847 PFTBA
M 222.0003 CijHg CI2 Di-PCB
M+2 223.9974 Ci2H83^Cl3''ci
Lock 230.9856 PFTBA
M 234.0406 CijHg CI2
Di-PCB
M+2 236.0376 "Ci2Hg"Cl"Cl
M 255.9613 C12H7 CI3 Tr-PCB
M+2 257.9584 Ci2H7'5cVci M 268.0016 l^Ci2H7^^Cl3
Tr-PCB M+2 269.9986 "Ci2H73^Cl2"Cl
M 289.9223 C12H6 C14 T-PCB
M+2 291.9194 CijHg^'Cls^'Cl
M 301.9626 ^^C,2He^^Cl4 13p _
TABLE VI; CONTINUED
M+2 303.9597 "CijHg^^Cls^Cl
M 323.8833 Cn^s^'Cls Pe-PCB
M+2 325.8804 Ci^Hj^^cV^Clj
M 335.9236 "C12H535CI5 13p _^12 Pe-PCB M+2 337.9207 i^CizHs'^cV'Cl
3 M 289.9223 ^n^6 CI4 T-PCB
M+2 291.9194 Ci2H,35ci^37ci
M 301.9626 "Ci2He^^Cl4 13p _ T-PCB M+2 303.9597 "CijHfi^^Cls^Cl
Lock 313.9839 PFTBA
M 323.8833 CijH/^Clj Pe-PCB
M+2 325.8804 12^5 ^-^4 ^-^5
QC 325.9839 PFTBA
M 335.9236 "C,,Hs''Cl, 13p _ Pe-PCB M+2 337.9207 i^CijHs^^cVci
M+2 359.8415 Ci2H435cij37ci Hx-PCB M+4 361.8385 C,2H435C14"C12
M+2 371.8817 i'Ci2H43^Cl53''ci 13/-. _ Hx-PCB M+4 373.8788 13Ci2H43'Cl4"Cl2
4 M 323.8833 CijHj CI5 Pe-PCB
M+2 325.8804 Ci2H535cl^37cl
TABLE VI; CONTINUED
M+2 337.9207 "CijHs^^ci^sVci
M+2 359.8415 Ci^H^^^Clj^cl Hx-PCB M+4 361.8385 12"4 *^4 ^-^2
M+2 371.8817 "Ci2H435ci53''Cl 13p _*-12
Hx-PCB M+4 373.8788 "Ci2H43^Cl43''Cl2
M+2 393.8025 CijHs^^Clg^Cl Hp-PCB
M+4 395.7995 C12H335CI337CI2
M+2 405.8427 "Ci2H335ci6"ci *-12
Hp-PCB
M+4 407.8398 "Ci2H3^5Cl5"Cl2
Lock 413.9775 '• PFTBA
QC 425.9775 PFTBA
M+2 427.7635 Ci2H2^^Cl7"Cl Oc-PCB M+4 429.7606 Ci2H2 Clg CI2
M+2 439.8038 "Ci2H2^^Cl7"Cl 13p _L.12
Oc-PCB
M+4 441.8008 "Ci2H2^^cVci2
M+2 393.8025 CijHj^'Clg^Cl Hp-PCB
M+4 395.7995 Ci2H3^^Cl5"Cl2
M+2 405.8427 "Ci2H3^5ci6^''Cl
^^Cjj-Hp-PCB
M+4 407.8398 "Ci2H3^^Cl5"Cl2
Lock 413.9775 PFTBA
TABLE VI; CONTINUED
M+2 427.7635 CijHj^'cV'Cl Oc-PCB M+4 429.7606 CiaH/^Cl^^Clj
M+2 439.8038 "CijHj^^cV'Cl
(-12-Oc-PCB M+4 441.8008 "Ci^H^^^Cls^'cl^
M+2 461.7245 Ci2Hi^^Cl8"Cl No-PCB M+4 463.7216 C,2Hi^5Cl7"Cl2
M+4 497.6826 Ci/5C1,^'C12 Deca-PCB M+6 499.6797 Ci2^^cV'ci3
M+4 509.7229 "C,,35C1«"C1,
Deca-PCB
M+6 511.7199 13Ci2'5Cl7^'Cl3
The following nuclidic masses were used:
H = 1.007825 Lock = Lock-mass ion
C = 12.000000 QC = Quality Control Ion
13C = 13.003355
35C1 = 34.968853
TABLE VIIt; PCB WINDOW DEFINING MIX
PCB Isomer Group Number
2-Mo-PCB (F) 4-Mo-PCB (L) 2,6-Di-PCB (F) 4,4 2,4 2,3 3,4 2,2 2,3 3,3 2,2 3,3 2,2 2,2 2,2 3,3 2,2 2,2 2,3 2,2 2,2 2,2 2,2 -Di-PCB (L) 6-Tr-PCB (F) 5-Tr-PCB 4'-Tr-PCB (L) ,6,6 3'',4-T-PCB ,4,4 ,4,6 ,4,4 ,4,4 ,3,4 ,3,4 ,4,4 ,3,4 ,3,3 3',4 ,3,3 ,3,3 ,3,3 ,3,3 -T-PCB (F) -T-PCB (L) 6',-Pe-PCB (F) ,5-Pe-PCB (L) ,6,6'-Hx-PCB (F) 4',6-Hx-PCB 5,6'-Hx-PCB ,5,5'-Hx-PCB (L) ,5,6,6'-Hp-PCB (F) ,4,4',5-Hp-PCB 4',5,5'-Hp-PCB (L) ,5,5',6,6'-Oc-PCB (F) ,4,4',5,5'-Oc-PCB (L) ,4,5,5',6,5'-No-PCB (F) ,4,4',5,5',6-No-PCB (L) Dec-PCB 1 1 2 2 2 2 2 2 2 3 2 4 3 3 4 4 4 5 5 4 5 5 5 5
Note: The letter "F" implies the first eluter and the letter
"L" implies the last eluter.
*The retention time of PCB analytes were determined
using the PCB analyte elution order in SE-54 column
G. Quality Control Criteria and Calculations;
The MS response to each analyte and internal
standard were computed using the formulas described below.
The analytes were quantified against their corresponding
internal standards while the internal standards were
quantified against their respective recovery standards (Table
VIII and Table IX; respectively). Mono through Penta PCB
internal standard isomers were quantified against the
^^C-2,2',5,5'-T-PCB recovery standard while the Hexa through Deca
PCB internal standards were quantified against the
"c-3,3',4,4',5,5'-Hx-PCB recovery standard (Table IX). Table IX
also specifies the quantification relationship for the
surrogate and alternate standards, each of which were
quantified against their appropriate internal standards. The
mean response factor and the relative standard deviation
(%RSD) were calculated for each analyte and the internal
standard from the five point initial calibration (ICAL)
solutions. Every twelve hours RTCHK was analyzed to verify
that no retention window shift which may have occurred during the past twelve hours. If the retention windows had shifted, the acquisition windows were adjusted and the RTCHK was reanalyzed to confirm its correctness. The continuing
calibration solution (CONCAL) was analyzed every 12 hours to
which were used to assess ICAL and CONCAL performance. Table XI lists the criteria for chlorine abundance ratios which were
used to monitor proper GC/MS performance. These ratios are derived from known isotopic abundances. Samples were not analyzed until both the ICAL and CONCAL had passed the QC
criteria listed in Tables X and XI.
H. Analyte Identification Criteria
The positive identification criteria used for the
characterization of the target analytes were as follows:
1) The integrated ion-abundance ratio for the
analytes (M/M+2, M+2/M+4, M+4/M+6) must be within 15 percent
of the theoretical value (Table XI).
2) For those target analytes with an analogue
carbon-labeled standard, the retention time of the analyte must be within +3 seconds. The retention times of the non-target analytes for which carbon-labeled analogues were available in the ICAL/CONCAL must also be within +3 seconds of the analogous carbon-labeled standard. For those target analytes which did not have an analogous carbon-labeled standard available in the ICAL/CONCAL, the analyte relative retention time (RRT) must be within 0.005 retention time units of the corresponding RRTs obtained from the Continuing Calibration or the Initial Calibration, as applicable. The
carbon-labeled internal standard using the following formula;
Ana ly t Bj^^^on ^e(j)
RRTg^iyte
Internal Standard,^^^ ^„ (,)
3) The monitored ions must maximize within 2 s of
each other
4) The Signal/Noise for all monitored ions must be greater than 2.5:1 (greater than 10 for the labeled
standards).
I« Analyte Relative Response Factor (RRF);
The response factors of analyte standards were calculated from GC/MS calibration analyses (either CONCAL or ICAL as applicable) by the following expression:
Aa * Qi
RRF (a) =
---Qa * Ai
where
Aa and Qi are the integrated ion current of the ion
(s) characteristic of the analyte and the internal standard,
Qa and Qi are the amount of analyte and the
internal standard injected onto the GC column, respectively; a represents a given analyte, and i corresponds to
the its labeled internal standard.
J. Initial Calibration Mean RRFt
The initial calibration mean response factors were
obtained by using the following expression:
1 n Aa * Qi RRF (a) = —
S---n 1 Qa * Ai
where
RRP (a) represents the mean relative response factor
of a particular, analyte [e.g., a = 3,3',4,4'-T-PCB], and n is
the total number of data points derived from the initial
calibration.
K. Continuing Calibration Delta RRF;
initial calibration mean RRFs. The percent delta RRF was calculated as follows:
[RRFcoNCAL ~ RRF^ean]
%a =---* 100
RRF__
where
RRPcoNCAL represents the continuing calibration RRF
of a given analyte, and
RRF^e^ was the calculated mean RRF from the initial
calibration.
L. Analyte Concentration;
The concentration of any analyte was calculated
using the following expression:
Aa * Qi
C(a) =
---Ai * RRFmean(a) * W
ͣ
JiHPWy*^. JJ'i,?'5«?=Kr^-*s.¥5^s^'
C(a) is the concentration of a given analyte (e.g., a = 3,3',4,4'-T-PCB),
Aa is the integrated ion current for the ion(s)
characteristic of the analyte,
Ai is the integrated current of the ion(s) characteristic of the corresponding internal standard,
Qi represents the amount of internal standard added
to the sample before the extraction,
RRFmean(a) is the mean analyte relative response factor as determined from the initial calibration, and
W is the sample weight or volume as appropriate.
M. Detection Limits (PL);
The detection limits of the analytes were computed
when a given peak was not detected during the GC/MS analysis
either due to the absence of the analyte or inadequate instrument sensitivity. The detection limits were calculatedby using the expression below where the area of the analyte
was replaced by the noise level measured at the corresponding
m/z in a region of the chromatograms clear of genuine GC
signals. The DL is the detection limit for samples presenting
an analyte response that is less than 2.5 times the background
2.5 * Ha * Qi
DL (a) = ---Hi * RRF(a) * W
where
DL (a) is the estimated detection limit for a
particular analyte.
Ha is the estimated height of the noise in an ion
channel representative of the analyte.
Hi is the height of the ion characteristic of the
corresponding internal standard,
Qi represents the amount of internal standard added
to the sample before the extraction,
RRFmean is the analyte mean relative response factor as determined from the Initial Calibration, and
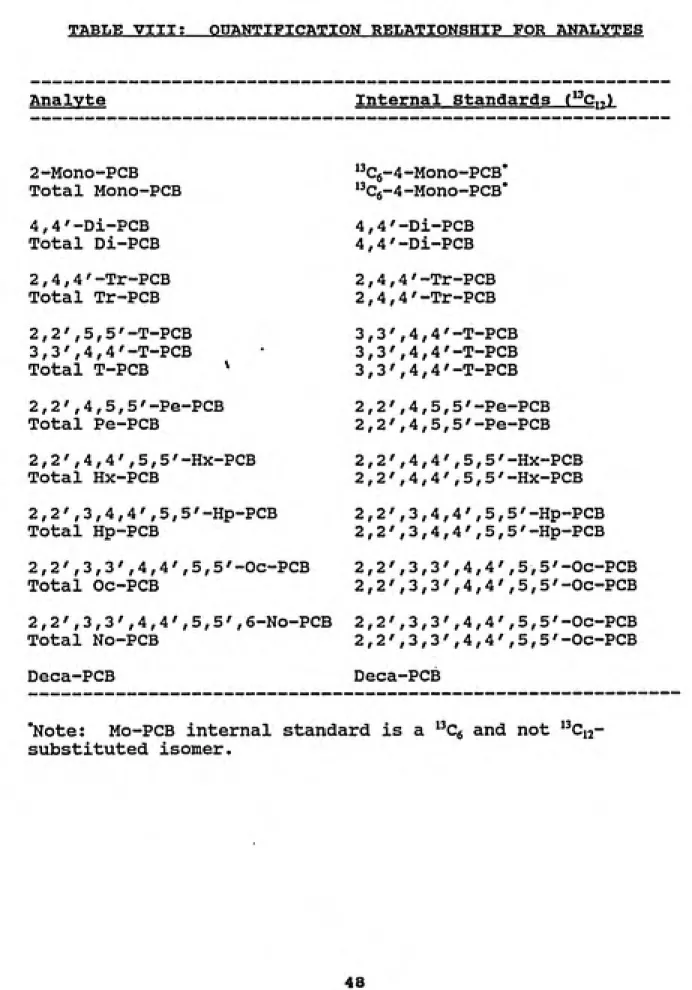
TABLE VIII; OUJ^NTIFICATION RELATIONSHIP FOR ANALYTES
Analyte Internal standards ( Ci;)
2-Mono-PCB Total Mono-PCB 4,4'-Di-PCB Total Di-PCB 2,4,4'-Tr-PCB Total Tr-PCB 2,2',5,5'-T-PCB 3,3',4,4'-T-PCB Total T-PCB ^ 2,2',4,5,5'-Pe-PCB Total Pe-PCB 2,2',4,4',5,5'-Hx-PCB Total Hx-PCB 2,2',3,4,4',5,5'-Hp-PCB Total Hp-PCB 2,2',3,3',4,4',5,5'-Oc-PCB Total Oc-PCB 2,2',3,3',4,4',5,5',6-No-PCB Total No-PCB "C6-4-Mono-PCB* "C6-4-Mono-PCB* 4,4 4,4 2,4 2,4 3,3 3,3 3,3 2,2 2,2 2,2 2,2 2,2 2,2 2,2 2,2 2,2 2,2 -Di-PCB -Di-PCB 4'-Tr-PCB 4'-Tr-PCB 4,4 4,4 4,4 4,5 4,5 4,4 4,4 3,4 3,4 3,3 3,3 3,3 3,3 -T-PCB -T-PCB -T-PCB 5'-Pe-PCB 5'-Pe-PCB ,5,5'-Hx-PCB ,5,5'-Hx-PCB 4',5,5'-Hp-PCB 4',5,5'-Hp-PCB ,4,4',5,5'-Oc-PCB ,4,4',5,5'-Oc-PCB ,4,4',5,5'-Oc-PCB ,4,4',5,5'-Oc-PCB Deca-PCB Deca-PCB
'Note: Mo-PCB internal standard is a "Cg and not
TABLE IX; QUANTIFICATION RELATIONSHIP FOR INTERNAL
STANDARDS
Internal Standards (^^C^^) Recovery Standards f^^Cj-,)
"C6-4-Mono-PCB* 2, 2',5, 5
4,4'-Di-PCB 2,2',5,52,4,4'-Tr-PCB 2,2',5,5 3,3',4,4'-T-PCB 2,2',5,5 2,2',4,5,5'-Pe-PCB 2,2',5,5
2,2',4,4',5,5'-Hx-PCB 3,3',4,4
2,2',3,4,4',5,5'-Hp-PCB 3,3',4,4 2,2',3,3',4,4',5,5'-Oc-PCB 3,3 ' ,4,4 Deca-PCB 3,3',4,4
-T-PCB
-T-PCB
-T-PCB
-T-PCB -T-PCB
,5,5'-Hx-PCB ,5,5'-Hx-PCB ,5,5'-Hx-PCB ,5,5'-Hx-PCB
Surrogate Standards ( Cj^)
3,3',5,5'-T-PCB 3,3',4,4',5-Pe-PCB 2,2',3,4,4,',5-Hx-PCB
2,2',3,3',5,5',6,6'-Oc-PCB
Internal Standards ("Ci;)
3 , 3 ',4,4'-T-PCB
2 ,2 ',4,5,5'-Pe-PCB 2,2',4,4',5,5'-Hx-PCB
2,2',3,3',4,4',5,5'-Oc-PCB
Alternate Standard ("Ci^)
2,2',3,3',4,4'-Hx-PCB 2,2',4,4',5,5'-Hx-PCB
TABLE X; QUALITY CONTROL CRITERIA FOR RESPONSE FACTOR OF
ICALS and CONCJUJs
Analyte ICAL f%RSD> CONCAL (^a)
2-Mo-PCB 30 4,4''-Di-PCB 25 2 , 4,4'-Tr-PCB 25 2,2',5,5'-T-PCB 30 3,3',4,4'-T-PCB 25 2,2',4,5,5'-Pe-PCB 30 2,2',4,4',5,5'-Hx-PCB 30 2,2',3,4,4',5,5'-Hp-PCB 25 2,2',3,3',4,4',5,5'-Oc-PCB 25 2,2',3,3',4,4',5,5',6-No-PCB 25 Deca-PCB 25 30 25 25 30 25 30 30 25 25 25 25
Surrogate Standards (^^Cto)
3,3',5,5'-T-PCB 25 3,3',4,4',5-Pe-PCB 25 2,2',3,4,4,',5-Hx-PCB 25 2,2',3,3',5,5',6,6'-Oc-PCB 25 25 25 25 25
Alternate Standard f^^Ci,)
2,2',3,3',4,4'-Hx-PCB 25 25
Internal Standards ("Ci^)
"C<i-4-Mono-PCB' 30
4,4'-Di-PCB 30 2,4,4'-Tr-PCB 30 3,3',4,4'-T-PCB 25 2,2',4,5,5'-Pe-PCB 30 2,2',4,4',5,5'-Hx-PCB 30 2,2',3,4,4',5,5'-Hp-PCB 30 2,2',3,3',4,4',5,5'-Oc-PCB 25 Deca-PCB 30 30 30 30 25 30 30 30 25 30TABLE XI: QUALITY CONTROL ION-ABUNDANCE RATIC1 ACCEPTABLE
RANGES
Number of Ion Type Theoretical Control Limits
Halogen Ratio Lower Upper
Atoms
1 CI M/M+2 3.08 2.62 3.54
2 CI M/M+2 1.54 1.31 1.77
3 CI M/M+2 1.03 0.87 1.18
4 CI M/M+2 0.77 0.65 0.89
5 CI M+2/M+4 0.61 0.52 0.70
6 CI M+2/M+4 1.24 1.05 1.43
7 CI M+2/M+4 1.04 0.88 1.20
8 CI M+2/M+4 0.89 0.76 1.02
9 CI M+2/M+4 0.78 0.66 0.90
IV. Results and Discussion;
A. Calibration Data;
Once the PCB-RTCHK was analyzed and the
acquisition windows were correctly set, 2 uL of each initial calibration solutions was injected into the- GC/MS and the
mean RRF of the analytes, internal standards, surrogate standards, and alternate standards were determined. The results are shown in Table XII. It is generally accepted by environmental analysts that there is no single definition of adequate linearity of detector response with varying
concentration (Alford-Stevens, et al. 1985).
For the analyte, in this work the mean RRF ranged from 0.843 for Mo-PCB to 3.247 for Hp-PCB. For the
Surrogates and the Alternate Standards, the mean RRF ranged
from a low of 0.541 for "Cj2-2,2'3,3'5,5'6,6'-Oc-PCB to a
high of 4.756 for '^Ci2-3,3M,4'5,5'-Pe. For the Internal
Standards, the mean RRF ranged from 0.222 for
'^Cjj-2, 2'3, 4, 4'55'-Hp-PCB to 2.065 for "Ci2-2 , 4, 4'-Tr-PCB. The
%RSD for the analyte, RRFs from the initial calibration,
mean RSD was 8.7% for all the analyte. The %RSD for the
surrogate and alternate standards ranged from 3% for
^'Cij-3,3',5,5'-T-PCB to 9% for "Ci2-2 , 2 ' , 3 , 3 , 5, 5', 6, 6'-Oc-PCB.
The overall mean RSD was 5.6% for the surrogate and
alternate standards. For the internal standards, the %RSD
ranged from 3% for ^^Ci2-2,4,4'-Tr-PCB to 12% for
'^Cij-Deca-PCB. The overall mean RSD was 6.4% for the internal
standards. The mean response factor of the
2,2',3,4,4',5,5'-Hp was high (3.247) and its corresponding
internal standard, ^^Ci2-2,2',3,4,4',5,5'-Hp-PCB had low
response factor (0.222) due to the incorrect concentration
of primary solution supplied by the Vendor (CIL). The %RSDs
were well within the criteria given in Table X.
The ability of the RRFs to be reproduced over a period of time was also an issue of concern in this work.
After performing analyses for approximately 12 months, the RRFs of analytes and internal standards have been relatively
consistent with those shown in Table XII. It should be
noted, however, that if GC leaks are present, the RRFs of
internal standards may. The RRFs are affected by settings
of the electron energy and repeller, thus tuning the mass
spectrometer may also have effects upon RRFs.
the "Ci2-Tr-PCB. The PFK ion with a mass of 223.9872
interfered with Di-PCB (M+2) ion of 223.9974. A mass
spectrometer resolution of 22000 was required to resolve
these two masses. A PFK ion also interfered with the
Internal Standard ion (268.0016) of Tr-PCB. In this case a mass spectrometer resolution of 33 000 was required to
separate the ^^Cjj-Tr-PCB and PFK ion of 267.9934. Since mass
spectrometer sensitivity decreases as the resolution
increases, a resolving power of 10,000 was chosen as a
compromise. At this resolving power, one can still achieve
the detection limit of 500 femptogram using (10:1 at a S:N
ratio of 10:1).In order to alleviate chemical interferences from
the reference compound PFK, Perfluorotributylamine (PFTBA)
was chosen as an alternate reference compound. Even thoughthe reference compound reservoir was cleaned very well using
solvents such as Methylene Chloride or Toluene, the problemof PFK interference was not totally alleviated since most
GC/MS systems use PFK as the reference compound on anongoing basis. The alternative reference compound itself
(PFTBA), with the residue of PFK, also interfered with
detection of Di-PCB. The interference of mass 222.0000 of
PFTBA to Di-PCB was most prevalent at low concentration of
Di-PCB. When 500 femptogram of Di-PCB was injected into the
approximately 8/1 and the lowest signal to noise observed
was approximately 2/1. During the analysis of lowest ICAL point, the level of PFTBA was kept to a minimum level as allowed by the mass spectrometer without compromising the intensity of other lock-mass ions for different SIR groups.
B. Results of Method Performance!
The data obtained by the fortification of five replicate HPLC water samples provided information regarding method performance in terms of precision, bias of
concentration, and the efficiency of the extraction and cleanup procedures. The five reagent water samples were fortified at concentration of 0.50 ng/L (see Table III). The results are shown in Table XIII. The mean %RSDs ranged from 3.51% for 2,2',3,4,4',5-Hp-PCB to 18.18% for
2,2',5,5'-T-PCB. The relative percent deviation (%RPD) ranged from —
1.8% for 2,2',5,5'-T-PCB to 23.6% for 2,4,4'-Tr-PCB. The mean percent accuracy ranged from 94.8% for 2-Mo-PCB to
123.2% for 2,4,4'-Tr-PCB. Excellent precision was achieved for 2,2',3,3',4,4',5,5',6-No-PCB and Deca-PCB with %RPD of
0.0%.
The %recoveries of carbon labelled internal
standards ranged form 43.0% for ^^Ci2-4-Mo-PCB to 77.0% for
"Cij-2 , 4, 4'-Tr-PCB to "Cij-25.0% for ^^Ci"Cij-2-4-Mo-PCB. The recoveries of
internal standards are not necessarily representative of the
efficiency of extraction and cleanup procedures since they
are not quantified using the isotope dilution technique. The recoveries of internal standards can be affected by howwell the GC/MS was tuned and whether or not they were any
leaks present. They do, however, indicate whether any problems which may have occurred during the extraction and/or cleanup and during the GC/MS analysis. For example,
the recovery of ^^Ci2-4-Mo-PCB always proved less than other
internal standards. It was discovered that part of the Mo-PCB was being evaporated during the concentration procedure
using Nj for the final extract volume since Mo-PCBs have
lower boiling points than other homologs. The concentration
procedure was kept as gentle as possible to minimize theevaporation of analyte.
The %recoveries of the carbon-labelled alternate
and surrogate standards were also determined. They ranged
from 65.0% for "Ci2-2,2',3,3',4,4'-Hx-PCB to 119.0% for ^^Cij"
3,3',5,5'-T-PCB. There was not a wide distribution of
recoveries of the surrogates and alternate standards observed since they are quantified against the internal standards and they are added prior to cleanup procedures.extraction and cleanup procedures since they are not
quantified using the isotope dilution technique. During the
development of the method, it was discovered that onesurrogate compound, "Ci2-2,2',3,3',5,5',6-Hp-PCB coeluted
with another surrogate, ^^Ci2-3 , 3', 4,4', 5-Pe-PCB. As a
result, high recoveries were observed for ^^Cij-Pe-PCB
surrogate since ^^Cij-Hp-PCB contributed to the Pe-PCB channel
by the loss of two chlorines. Since ^^Cij-Hp-PCB was not
considered as toxic as the "Cij-Pe-PCB, it was taken out from
the experimental analysis of samples and ICALS.
The data acquired with these extracts was also
used to estimate the detection limits and quantitation
limits for PCB analytes. The American Chemical Society(ACS) committee guidelines define the limit of detection
(LOD) as three times the standard deviation (SD) of
replicate measurements and limit of quantitation (LOQ) as
ten times the SD (Alford-Stevens et. al 1986, ACS 1983). The LOD is essentially equal to a method detection limit(MDL), which is calculated with an equation relating the standard deviation of replicate measurements and student's t
value for a one-tailed test at the 99% confidence level with
n-1 degrees of freedom. The MDL is defined as the minimum
concentration that can be measured and reported with 99% confidence that the value is above zero (Alford Stevens, et
0.0067 ng/L for 2,2',5,5'-T-PCB. The LOQ ranged from 0.0039
(ng/L) for 2-Mo-PCB to 1.87 (ng/L) for
2,2',3,3',4,4',5,5',6-No-PCB. The LOD ranged from 0.0012
(ng/L) for 2-Mo-PCB to 0.0056 (ng/L) for
2,2',3,3',4,4',5,5',6-No-PCB. The values of MDL were
computed to be higher than the lowest point of calibration
standards. The reason is that the reagent water extracts were spiked at higher amount (5 ng/L and greater). It
TABLE XII: MEAN RESPONSE SUMMARY OF 2^ALYTES 3^ND INTERNAL STANDARDS Analytes 2-Mo-PCB 4,4'-Di-PCB 2,4,4'-Tr-PCB 2,2',5,5'-T-PCB 3,3',4,4'-T-PCB 2,2',4,5,5'-Pe-PCB 2,2',4,4',5,5'-Hx-PCB 2,2',3,4,4'5,5'-Hp-PCB 2,2',3,3',4,4',5,5'-Oc-PCB 2,2',3,3',4,4',5,5',6-No-PCB Deca-PCB
Mean RRF %RSD
0.843 3 1.321 15 1.649 6 1.037 3 1.181 7 1.158 7 1.213 7 3.247 8 1.583 11 0.868 11 1.642 13
Internal Standards (Carbon-Labeled) 4-Mo-PCBi 4,4'-Di-PCB 2,4,4'-Tr-PCB 3,3',4,4'-T-PCB 2,2',4,5,5'-Pe-PCB 2,2',4,4',5,5'-Hx-PCB 2,2',3,4,4',5,5'-Hp-PCB 2,2',3,3',4,4',5,5'-Oc-PCB^ Deca-PCB 1.333 7 1.720 4 2.065 3 1.334 4 0.489 7 1.125 6 0.222 8 0.893 7 0.590 12
Surrogate standards (Carbon-Labeled)
3,3',5,5'-T-PCB 0.982 3,3,'4,4',5-Pe-PCB 4.756 2,2',3,4,4',5'-Hx-PCB 0.781 2,2',3,3',5,5',6,6'-Oc-PCB 0.561 3 8 4 9
Alternate Standard (Carbon-Labeled)
2, 2',3,3',4,4'-Hx-PCB 0.306
Recovery Standard Solution (Carbon-Labeled)
TABLE XII; CONTINUED
'The Mo-PCB Internal Standard is '^Cg and not a "Cj.
TABLE XIII! RESULTS OF METHOD PERFORMANCE MATRIX SPIKED
SAMPLES
Analytes Test 1 Test 2 Test 3 Test 4 Test 5 (ng/L)
2-Mo-PCB 0.44 0.52 0.51 0.44 0.47
44-Di-PCB 0.51 0.67 0.50 0.55 0.60
244-Tr-PCB 0.52 0.59 0.64 0.69 0.64
2255-T-PCB 0.90 1.30 0.89 0.89 0.93
3344-T-PCB 0.85 1.00 1.00 1.00 0.99
22455-Pe-PCB 0.91 1.00 0.93 1.00 0.95 224455-Hx-PCB 0.99 1.20 1.10 1.10 1.00
2234455-Hp-PCB 1.60 1.60 1.60 1.50 1.50
22334455-Oc-PCB 1.40 1.60 1.60 1.60 1.60
223344556-No-PCB 2.30 2.70 2.70 2.40 2.40
Deca-PCB 2.30 2.50 2.60 2.60 2.50
Internal Standards (Carbon--Labeled)
36.7 40.9
4-Mo-PCB^ 39.7 61.8 35.2
44-Di-PCB 61.6 58.7 45.8 66.4 42.1
244-Tr-PCB 58.1 55.9 53.4 68.8 48.7
3344-T-PCB 87.4 50.9 74.3 76.3 50.9
22455-Pe-PCB 83.0 90.8 75.5 75.8 59.5 224455-Hx-PCB 76.9 73.7 51.4 70.7 50.8
2234455-Hp-PCB 82.3 72.8 60.8 70.8 52.9
22334455-OC-PCB2 82.5 79.9 66.5 75.6 53.9
Deca-PCB 87.0 74.1 60.1 58.1 47.3
Surrogate Standards (Carbon-LabeledI
97.9 104
3355-T-PCB 83.9 162 146
33445-Pe-PCB 67.6 58.1 118 117 134
223445-Hx-PCB 99.4 108 113 108 143
22335566-Oc-PCB 90.4 103 96.2 102 149
Alternate Standard (Carbon--Labeled)
57.7 72.0
TABLE XIII CONTINUED; RESULTS OF METHOD PERFORMANCE MATRIX
SPIKED SAMPLES CONTINUED
Analytes Mean SD %RSD %RPD %Accuracy MDL
(ng/L) (ng/L)
0.47 0.038 8.12 -5.2 94.8 0.144 0.57 0.070 12.41 13.2 113.2 0.263 0.62 0.064 10.43 23.2 123.2 0.241 0.98 0.179 18.18 -1.8 98.2 0.669 0.97 0.066 6.83 -3.2 96.8 0.248 0.96 0.041 4.27 -4.2 95.8 0.153 1.08 0.086 7.99 7.8 107.8 0.323 1.56 0.055 3.51 4.0 104.0 0.205 1.56 0.089 5.73 4.0 104.0 0.335 2.50 0.187 7.48 0.0 100.0 0.701 2.50 0.122 4.90 0.0 100.0 0.459 2-Mo-PCB 44-Di-PCB 244-Tr-PCB 2255-T-PCB 3344-T-PCB 22455-Pe-PCB 224455-Hx-PCB 2234455-Hp-PCB 223344550C-PCB 223344556NO-PCB2.50 Deca-PCB
Internal Standards (Carbon-Labeled)
Mean SD_____%RSD
4-Mo-PCB' 44-Di-PCB 244-Tr-PCB 3344-T-PCB 22455-Pe-PCB 224455-Hx-PCB 2234455-Hp-PCB 223344550C-PCB2 Deca-PCB (ng/L)
42.86 10 83 25 27 54.92 10 47 19 .06 56.98 7 48 13 .12 67.96 16 .35 24 .06 76.9 11 .58 15 .05 64.7 12 .61 19 .49 67.9 11 35 16 .71 71.68 11. 65 16 .25 65.32 15 42 23 .61
Surrogate standards (Carbon-Labeled)
3355-T-PCB 33445-Pe-PCB
223445-Hx-PCB
22335566-Oc-PCB
119 33.47 28.18 98.9 33.80 34.16 114 16.80 14.69 108 23.40 21.65
Alternate standard (Carbon-Labeled)
C. Cape Fear River Water Extracts;
To demonstrate the method's performance with
samples more representative of true environmental samples, eight 500 mL aliquot of Cape Fear River water samples were fortified with internal standards, extracted, and analyzed. A blank sample was also extracted under identical conditions to demonstrate freedom of the method from interferences and contamination. The samples were extracted within one day of collection and analyzed by GC/MS within two days of
extraction. Results from these samples are summarized in
the Tables XIV through XV.
As the data in Table XIV show, no specific
analytes were detected in the reagent water blank, though there were a total of 0.03 pg/L PCBs [(O.Ol Di-PCB and 0.02
(Pe-PCB)] detected. All the samples analyzed had very low or non detectable concentration of specific isomers for Mo-PCB, No-Mo-PCB, and Deca-PCBs. The mean total concentration of PCBs measured in the samples taken near the Pulp Industry plant was 0.80 pg/L (Table XV). The total Di-PCBs, Pe-PCBs, Hx-PCBs, and Hp-PCBs at this site were found to be greater than 0.10 pg/L. The samples which were collected between the Pulp Industry and the Electrical plant had a mean total concentration of 0.88 pg/L of Total-PCBs (Table XVI).
Hp-PCBs were found for the two duplicate samples. There was
not any significant increase in the concentration of PCBs
near the waste dump area as compared to the samples
collected from the farthest point downstream. The Tables
XVII and XVIII show data from samples collected near the
waste dump area near the electrical plant and approximately five miles away from the dumping site; respectively. The mean total concentration of PCBs found near the waste dump
area was 3.20 pg/L (Table XVII). There were no detectable amounts found for Oc-PCBs and No-PCBs. The-samples which were collected downstream from the dump site had a mean total PCB concentration of 1.60 pg/L (Table XVIII). The decrease in going downstream unexpected since PCBs are non-polar compounds and they tend to settle to the bottom of the
river as the waste water became diluted with the river
TABLE XIV; POLYCHLORINATED BIPHENYLS RESULTS FROM CAPE FEAR
RIVER (STUDY 1)
PCB Analvtes Blank