NATURALLY OCCURING CLAY, MONTMORILLONITE, AS A
DRUG DELIVERY VEHICLE FOR IN VITRO EXTENDED
RELEASE OF VENLAFAXINE HYDROCHLORIDE
Shilpa Jain
[a]and Monika Datta
[a]*Keywords: Venlafaxine hydrochloride; montmorillonite; oral drug delivery
In the present work, a naturally occurring smectite group clay mineral, montmorillonite, (Mt) has been explored as a vehicle for delivery of an antidepressant drug Venlafaxine hydrochloride, VF. The effect of pH of the drug solution, time and initial drug concentration on drug loading capacity of Mt has been studied. The adsorption isotherm was fitted by the Langmuir model and follows the pseudo-second-order kinetics. The synthesized Mt-VF complexes were characterized by XRD, FTIR, TGA, DSC etc. VF was found to be intercalated in the Mt layers. The release profile of the VF and Mt-VF complex in simulated gastric and intestinal fluids has been discussed. The release behaviour of VF from Mt-VF complexes appears to be sustained/extended for a period of 12 h and reaches upto 52 % in simulated gastric fluid and is stable in intestinal fluid where as pure VF completely gets released in 5.5 h and 3.5 h in simulated gastric and intestinal fluid respectively. Out of all kinetic models used to elucidate the drug release mechanism, the best fitting was observed for first order model. On the basis of present studies it can be stated that the synthesized Mt-VF complexes have the potential for developing in to a sustained release formulation for oral drug delivery of an anti-depressant drug VF. This shows a path which can reduce doses substantially from 4 times in 24 h to twice in 24 h.
* Corresponding Authors
E-Mail: [email protected]
[a] Analytical Research Laboratory, Department of Chemistry, University of Delhi, Delhi 110007, India
INTRODUCTION
Clay minerals possessing layered structure are known to exhibit properties such as good water absorption, swelling and cation exchange ability which are considered beneficial for the synthesis of pharmaceutical products, both as inactive and active substances.1-3 Clay minerals being
natural cation exchanger can bind with cationic drugs via electrostatic interaction. These properties have encouraged the use of clay minerals for developing drug delivery vehicle for extended release of drugs.4-10 Pharmaceutical preparations, using minerals as carrier-releasers of active ingredients, can generally be administered orally to the patient there by making them a preferred choice for oral drug delivery vehicle.11
Montmorillonite (Mt), also known as medical clay, is a potent detoxifier that can adsorb dietary and bacterial toxins.12-14
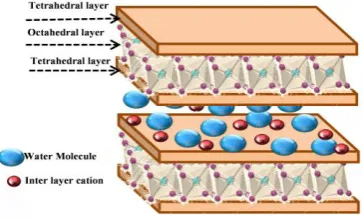
Figure 1. Structural representation of hydrated Mt general formula M+
x+y(Al2-x)(OH)2(Si4-yAly)O10
It is a GRAS grade FDA approved clay and has attracted great interest from researchers. It belongs to the 2:1 smectite group of clay minerals.
It has large specific surface area, good adsorption and cation exchange capacity. Mt is known to intercalate various protonated and hydrophilic organic molecules, which can be released in a controlled manner by replacement with other kind of cations in the release media.15-17 Drug intercalated Mt formulations offer a novel
route to prepare organic and inorganic complexes that contain advantageous properties of both the inorganic host and organic guest in a single material.18-20 (Fig. 1)
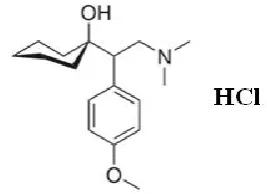
Belonging to the third generation antidepressant drugs Venlafaxine hydrochloride (Fig. 2) inhibits reuptake of serotonin, norepinephrine and, to a lesser extent, dopamine. It is a white crystalline solid which is highly soluble in water (>500 mg mL-1).21-22 Due to the short steady state elimination
half-life (4-5 h) the drug has to be administrated 2 to 3 times in 24 h so as to maintain required concentration of the drug in the blood plasma. The dose of VF ranges from 75 to 350 mg d-1.23 The available two formulations for this drug namely
immediate and extended release formulations have various side effects and certain drawbacks such as, slow release characteristics, instability in high acidic conditions.24
Therefore an effective oral drug delivery system is needed to overcome these drawbacks and to improve the clinical treatment process which is capable of maintaining the therapeutic concentration over a longer period of time. Therefore an oral drug delivery system with extended release characteristics can prove to be more patient compliant.25-26
There is no report, to the best of our knowledge, on the preparation of VF intercalated Mt complexes for the oral extended delivery of VF.
Figure 2. Structural representation of Venlafaxine hydrochloride (VF)
Therefore, the aim of our work was to undertake a systematic and detailed investigation on adsorption and optimization of conditions for preparing Mt-VF complexes for sustained release formulations. The effect of pH, time and initial drug concentration on drug intercalation capacity of Mt has been evaluated. Thus the developed Mt-VF complexes have the potential to be used as an oral extended delivery of VF for the patients requiring medicinal treatment around the clock.
EXPERIMENTAL
Materials
Montmorillonite (KSF) was procured from Sigma Aldrich (USA) and Venlafaxine hydrochloride (purity >98%) was gift from Ami life sciences Pvt. Limited, Maharashtra. Analytical grade sodium hydroxide, potassium dihydrogen phosphate, hydrochloric acid and potassium chloride for the preparation of drug release media were obtained from Merck Chemicals Ltd (India).Water used in the experiments was deionized and filtered (Milli-Q Academic, Millipore, France).
Effect of pH on absorption spectrum of VF
Initially the stability behaviour of VF was studied in the pH range 1-12 (Fig. 3).
Figure 3. UV-Visible spectra of aqueous VF solution (10 ppm) showing effect of pH
Drug loading capacity of Mt for VF
In order to determine the conditions for maximum loading of VF on Mt, effect of various parameters such as contact time, pH and initial concentration of VF were investigated using batch extraction method. As the drug was not stable beyond pH 9 therefore the influence of pH on loading of VF on Mt was studied with in pH range of 1-9 at 25 °C. Initially a stock solution of the drug, 1000 g mL-1, was prepared. 5
mL of this solution containing 5000 g of drug was taken in a 100 mL volumetric flask containing 100 mg of Mt. Then solution was maintained at various pH 1-9 and the volume was made upto 25 mL. The resulting dispersion was put on continuous mechanical shaking (Khera instruments).
The dispersion was centrifuged at 25,000 rpm for 30 min at room temperature (Sigma centrifuge). The free VF concentration in the supernatant was determined using UV– visible spectrophotometer (Analytic Jena) from the Lambert-Beer’s plot and the percentage of the drug loaded was calculated using Equation (1)
(1)
where
Ci is the initial drug concentration (mg L-1) and Ce is the concentration of the drug (mg L-1) in the
supernatant at the equilibrium stage.
The amount of drug adsorbed qe (mg g-1) was calculated
via the mass-balance relationship as per Equation (2)
(2)
where
V (in L) is the volume of the reaction media and m is the mass of Mt (in g) used for the studies.
The pH where the loading of drug on Mt was maximum was chosen to perform time dependent and adsorption kinetic studies in the time period of 0.25 h to 24 h, keeping all the other parameters constant.
Once the optimal time for highest uptake of drug was obtained, adsorption equilibrium studies of VF in the concentration range of 16 to 720 mg L-1 (400 g-18000 g)
were carried out maintaining other obtained best pH and time.
Characterizations
The samples were analyzed and characterized using suitable analytical techniques discussed under appropriate headings.
i e
i
C C
C
e ( i e)
V
q C C
m
UV– Visible spectrometry
UV–Visible absorbance of the supernatant solutions was measured at λmax= 225 nm (UV– Visible spectrophotometer
Analytic Jena) equipped with a quartz cell having a path length of 1 cm.
X-ray Diffraction
Powder X-ray diffraction (PXRD) measurements of samples were performed on a powder X-ray diffractometer
(D8 DISCOVER BRUKER AXS, Germany) the
measurement conditions were Cu α radiation generated at 40 kV and 40 mA as X-ray source 2-40° (2θ) and step angle 0.02° s-1.
Thermal Analysis
The effect of Mt content on thermal stability of Mt-VF-complex was assessed by the thermogravimetric analyzer (TGA 2050 Thermal gravimetric Analyzer, Perkin Elmer).
The differential scanning calorimetric studies were conducted on DSC instrument (DSC Q200 V23.10 Build 79). The samples were purged with dry nitrogen at a flow rate of 10 mL min-1, the temperature was raised at 5 °C
min-1.
Fourier-transformed infrared (FT-IR) spectrometry
FT-IR spectra was recorded with an FTIR spectrophotometer (Perkin Elmer, Spectrum BXFTIR Spectrometer) using the KBr (Merck, Germany) disc method.
Scanning electron microscopy (SEM) with EDS
Scanning Electron Microscopic (SEM) images were recorded to study the surface morphology of Mt and Mt-VF complex. Sample was mounted on carbon tape on a stub; sputter coated with gold in a vacuum evaporator and images were recorded using a scanning electron microscope (model, JEOL JSM-6610LV).
Behaviour of drug under in vitro conditions
Kinetics of drug release under in vitro conditions was performed using USP six stage dissolution rate test apparatus (DISSO 8000, Lab India, India) with the dialysis bag technique. Simulated gastric fluid was prepared by mixing 250 mL of 0.2 M HCl and 147 mL of 0.2 M KCl (buffer solution of pH 1.2). Simulated intestinal fluid was prepared by mixing 250 mL of 0.1 M KH2PO4 and 195.5
mL of 0.1 M NaOH (buffer solution of pH 7.4). Dialysis bags were equilibrated overnight with the dissolution media prior to experiments. A known amount of sample is placed in the dialysis bag containing 5 mL of dissolution medium. The drug loaded dialysis bag was placed into the receptor compartment containing 500 mL dissolution medium with constant stirring (80 rpm) maintained at 37±0.5 °C. An aliquot (5 mL) was withdrawn at regular interval of time followed by replenishment with equal volume of dissolution
medium to maintain same volume of dissolution medium. The extracted aliquots were analyzed for its drug content using UV spectrometer at 225 nm (calibration plot of standard drug solutions were prepared in the same releasing media). The above mentioned procedure is repeated for every sample (pure VF, Mt-VF complex) in simulated gastric fluid and simulated intestinal fluid.
To analyze the in vitro release data, various kinetic models including Zero order, First-order, Higuchi and Korsmeyer–Peppas model has been used to describe the release kinetics.27-29
RESULTS AND DISCUSSION
Interaction of VF at different pH values
Mt has the ability to swell on coming into contact with water and the exchangeable cations/drugs diffuse into the water phase [30]. To start with the experiment, effect of pH on the VF molecule was investigated in the range of 1-12. It was found that drug maintains its absorption maxima (Fig. 3) within the experimental pH range of 1-9.The UV absorption spectra of VF show two absorption peaks at 225 nm and 274 nm corresponding to different electronic transitions of the molecule.31-33 In subsequent studies,
wavelength of 225 nm has been selected for quantitative estimation of VF.
The pH of the solution has always played a crucial role in adsorption process.30 The loading of VF in Mt was found to
increase from 1750 g to 2400 g (35 % to 48 %) in the pH range of 1- 6 and then decrease to 1800 g (36 %) in the pH range of 7-9 (Fig. 4).
This could be explained on the basis that at lower pH loading of drug is less due to the competition between the cationic drug and H+ ions present as exchangeable ion in Mt
where as in the slightly acidic medium around pH=6, VF will be positively charged because of the presence of tertiary amino groups in its molecular structure34 therefore
the amount of VF loaded on Mt increases slightly.
Figure 4. VF loading on Mt as a function of pH
Effect of time on loading of VF on Mt
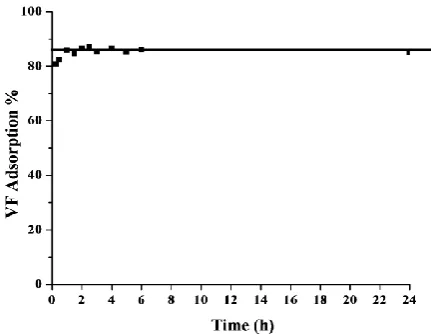
Intercalation of VF in Mt is a rapid process, due to occurrence of ion-exchange reaction between the interlayer Na+ ions and cationic VF molecules at pH= 6 (Fig. 5).
Figure 5. Effect of contact time on loading of VF on Mt.
Initially 4111 g (80 % of 5000 g) of VF was loaded within 0.5 h of interaction time, which increased to 4353 g (87 % 5000 g) in 2.5 h and remained almost constant 4300 g (86 % of 5000 g) up to 6 h and tends to decrease up to 4258 g (85 % of 5000 g) in further 18 h. Therefore, for further experiments in our studies, reaction time was set to 2.5 h in order to have maximum loading.
Effect of initial VF concentration on loading on Mt
The loading of VF in Mt layers is also affected by its initial amount present in the solution.
As the VF amount in the solution increases from 400 g to 18000 g (40 - 720 mg L-1), the amount of VF loaded on
Mt increases from 338 g to 1758 g (84.6 % to 94 %) (Fig. 6). Therefore, the optimal concentration was found to be 1800 g of VF/100 mg of Mt for further studies and characterizations.
Figure 6. Effect of initial VF concentration on loading on Mt
Kinetics of VF Adsorption
In order to optimize the design of an adsorption system of VF on Mt, it is important to establish the most appropriate correlations for the equilibrium data for the system. In this respect two kinetic models including pseudo first order and pseudo-second order models have been applied to determine the adsorption mechanism.35
Pseudo-first-order model
Pseudo-first-order equation can be expressed as below Equation (3): where k1 is the pseudo-first-order rate constant
(min−1), qt is the amount of drug adsorbed (mg g−1) at
different times t, q1 is the maximum adsorption capacity (mg
g−1) for pseudo first- order adsorption. Plots of 1/qt versus
1/t for the adsorption of VF on Mt surface were employed to generate the intercept values of 1/q1 and the slope of k1/q1
(Fig. 7). The values of k1, q1 and the correlation coefficients
are given in Table 1.
(3)
Figure 7. Pseudo first order kinetic model for VF adsorption on Mt surface
Pseudo second order model
The pseudo-second-order kinetic equation can be represented as Equation (4): where k2 is the pseudo-second
order rate constant; q2 is the maximum adsorption capacity
(mg g−1) for the second order adsorption process The plots of t/qt versus t for VF adsorption on Mt are given in Fig. 8.
From the slope and intercept values, q2 and k2 values were
calculated with results given in Table 1.
(4)
Figure 8. Pseudo second order kinetic model for VF adsorption on Mt
Table 1. Kinetic parameters for the adsorption of VF on Mt surface
Pseudo first order Pseudo second order
k1,
min-1 q1,
mg g-1
R12 k2,
g mg min-1 q2
mg g-1 R22
1.132 43.25 0.840 0.0428 43.04 0.999
Adsorption Isotherm for VF on Mt surface
The adsorption isotherm of VF on Mt surface obtained by plotting the amount of VF adsorbed by Mt (qe, mg g-1) vs
equilibrium concentration of VF (Ce, mg L-1) is shown in
Fig. 9.
1
t 1 1
1 k 1 1
q q tq
2
t 2 2 2
1
t t
Figure 9. Adsorption isotherm of VF on Mt surface
The Langmuir (Equation-5) and Freundlich (Equation- 6) adsorption isotherms were applied to evaluate the adsorption data which correspond to homogenous and heterogeneous adsorbent surfaces respectively.30 The
equations can be expressed as follows:
(5)
(6)
where
qe is the equilibrium VF concentration on the Mt
surface (mg g−1),
Ce is the equilibrium VF concentration in solution
(mg L−1),
qm the monolayer adsorption capacity (mg g−1), and KL is the Langmuir adsorption constant (L mg−1).
In case of Freundlich adsorption isotherm,
Kf (mg g−1) and nf are considered as relative
adsorption capacity and adsorption intensity respectively.
The values of qm and KL were computed from the slope
and intercept of the linear plot of Ce/qe versus Ce (Fig. 10)
and are presented in Table 2.
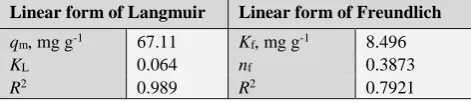
Table 2. Isotherm constant for VF adsorption on Mt surface
Figure 10. Linear form of Langmuir adsorption isotherm for VF on Mt
Figure 11. Linear form of Freundlich adsorption isotherm for VF on Mt
The linear form of Langmuir isotherms seems to produce a better fit in comparison with linear form of Freundlich isotherm (Fig. 11). The essential characteristics of the Langmuir equation can be expressed in terms of a dimensionless separation factor RL as Equation-7:
(7)
The value of RL indicates the shape of the isotherm to be
either unfavorable (RL >1), linear (RL =1), favourable (0< RL
<1) or irreversible (RL =0) thereby indicates the nature of
the favorability adsorption process and its feasibility. The results of RL values were in the range of 0.494-0.023
indicate that the favourable adsorption of VF on Mt.36
According to Freundlich equation, Kf value is 8.496 mg g -1 at 25°C. It can be said that the values of n
f equal to 0.3873
is smaller than 1, reflecting the favourable adsorption. Linear form of Langmuir Linear form of Freundlich
qm, mg g-1 67.11 Kf, mg g-1 8.496 KL 0.064 nf 0.3873 R2 0.989 R2 0.7921
e e
e m L m
1
C C
q q K q
e f f e
lnq lnK n lnC
L
L e
1
1 R
K C
XRD Studies
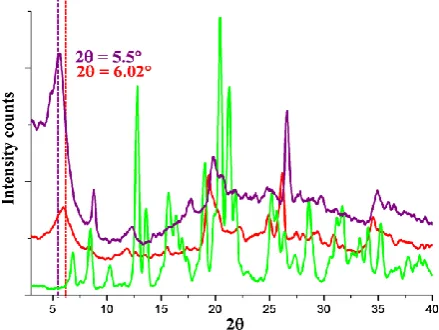
The physical status of pure VF, Mt, Mt-VF complex has been compared with the help of XRD (Fig. 12). Pure VF shows strong diffraction peaks at 2θ = 6.5˚, 8.5˚, 10.3˚, 12.8˚, 13.6˚, 15.6˚, 16.5˚,19.1˚, 20.4˚, 21.2˚, 21.9˚, 25.1˚, 28.7˚, 31.2˚, 31.7˚, 35.3˚ well supported by literature.37
The XRD pattern of pristine Mt shows characteristic diffraction peak at 2θ value 6.4˚ corresponding to 001 plane with d value of 14.2 Å.
In the case of Mt-VF complex an increase in intensity of 001 plane along with the shift in the 2θ value, from 6.02 to 5.5˚, was observed. According to Bragg’s law, shift in 2θ value from higher diffraction angle to lower diffraction angle is indicative of increase in d spacing i.e., from 14.2 Å to 16 Å38-40 which can be related to the successful
intercalation of VF in the Mt layers. Moreover the peaks at 8.5˚, 20.4˚, 21.8˚, 26.3˚ indicates the presence of VF in the synthesized Mt-VF complex.
Subtracting the Mt layer thickness (9.6 Å) from the d spacing (16 Å) of the Mt-VF complex, the Mt layer thickness was estimated to be 6.4 Å.35 This data suggest the
replacement of interlayer hydrated cations with monolayer the VF molecules parallel to the Mt layers is highly possible.41
Figure 12. XRD patterns for Pure VF,Mt, Mt-VF complex.
FTIR Studies
In order to confirm the presence of VF within the interlayer region of the Mt, FTIR spectra were recorded in the region 400-4000 cm-1.
In the FT-IR spectrum of Mt the band at 3436 cm-1 and
3641 cm-1 has been assigned to H-O-H stretching vibrations
from interlayer water and Si-O-H stretching vibrations of the structural OH group. The broadness around 3496-3093 cm-1 of the structural –OH band are mainly due to
contributions of several structural –OH groups occurring in the Mt. The absorption band at 1645 cm-1 corresponds to
H-O-H bending mode of adsorbed water.7,42
Figure 13. FTIR spectra of Pure VF, Mt , Mt-VF complex.
In the FTIR spectrum of the pure VF, appearance of absorption band at 3352 cm-1 corresponds to the stretching
vibrations of hydroxyl group and band at 2941 cm-1
correspond to the stretching vibrations of aromatic CH present in VF.34 However few characteristic bands around
2675-2480 cm-1 have been observed but no vibrational
mode have been assigned in literature as well.7,34
In case of Mt-VF complex the vibrational bands 3436 cm -1 and 3641 cm-1 has been assigned to H-O-H stretching
vibrations from interlayer water and Si-O-H stretching vibrations of the structural OH group but the broadness of this peak decreases as compared to Mt therefore decreasing the number of -OH stretching vibrations contributing to this peak indicating the intercalation of the VF (as confirmed by XRD) into the interlayer region has displaced the water molecules. The presence of functional groups of VF in the Mt-VF complex on the surface of Mt is also suggested by peak about 2941cm-1 characteristic of the aliphatic C–H
symmetric stretch of aromatic group of VF.
TGA Studies
Pristine Mt, pure VF and Mt-VF complex were characterized by TGA to evaluate their thermal behavior.
Pure Mt shows mass loss of 18 % from 30 °C to 140 °C and is attributed to the loss of adsorbed and interlayer water, with an endothermic peak in the DTA curve around 80 °C .Mass loss in the temperature range from 600-750 °C is due to the loss of hydroxyl groups in the aluminosilicate structure and the structure of the Mt layers collapses , also indicated by a broad endothermic peak in DTA curve of Mt at 600 ºC.43-44
Figure 14a. TGA-DTA curves of Montmorillonite
Figure 14b. TGA-DTA curves of Pure VF
Figure 14c. TGA-DTA curves of Mt-VF complex.
In case of Mt- VF complex the single step mass loss of 18 % in the range from 205 °C to 700 °C suggests the decomposition of intercalated VF.
DSC Studies
The physical state and crystallinity of the drug in case of Mt-VF complex have been investigated and compared to pure VF and Mt. Sharp endotherm at 212 C and 250 C has been observed for VF corresponding to the melting and decomposition of the pure compound.45,46
Figure 15. DSC curves of Pure VF, Montmorillonite and Mt-VF complex
Mt shows an exothermic peak around 90 C suggesting the dehydration of adsorbed water from the surface of Mt.
In case of Mt-VF complex a broad endotherm was appeared in the region of 60 °C to 100 °C which might corresponds to dehydration of surface water. In the temperature region of 200 °C to 300 °C, an exotherm might be related to the decomposition of VF within Mt layers was observed. (Fig. 15).
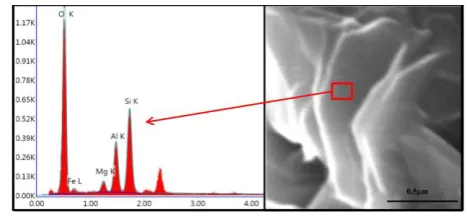
Scanning Electron Microscopy with Energy dispersive X-Ray Analysis
To analyze the surface morphology of Mt-VF complex drug delivery system Scanning Electron Microscopic with Energy dispersive X-Ray Analysis was performed. The surface of Mt has a layered smooth surface whereas the Mt-VF complex has layered but rough surface indicating the presence of VF molecule on the surface.
Figure 16a. SEM image and EDX graph of montmorillonite
High % content of oxygen, silicon and aluminum is observed in case of Mt where as in Mt-VF complex additional peaks of carbon nitrogen and chlorine are present along with oxygen, silicon and aluminum EDX analysis (Figs. 16a and 16b and Table 3). Since, the drug contains chlorine, nitrogen and carbon therefore it can be taken as an evidence for the presence of drug on the Mt-VF complex.
Table 3. Elemental analysis of Mt and Mt-VF complex
Drug Release Profile
VF is well absorbed and extensively metabolized in the liver.47 Therefore it is necessary to study the release profile
of the selected Mt-VF-complex in simulated gastric and intestinal fluid, in comparison with the release profile of pure drug under identical experimental conditions.
In stimulated gastric fluid the pure VF shows a rapid burst (releasing 35 % of the drug) in the initial 0.5 h followed by 100 % release of the drug over a period of 5.5 h. In case of Mt-VF complex a sustained release of VF in the gastric fluid (HCl,pH 1.2) was observed. Within initial 2 h, only 7.3 % of VF was released which approaches to 48 % in 7 hours and 53 % over a period of 10 h (Fig.17). The release in acidic media may be due to cation exchange with H+ ions
from the media, being smaller in size, they can penetrate deep into the Mt layers and results in high ion exchange process (Fig. 17).
Figure 17. Release profile of pure VF and Mt-VF complex in HCl buffer pH 1.2 and PBS pH 7.4
Figure 17a. Zero order kinetic model of Mt-VF complex in simulated gastric fluid
Figure 17b. First order kinetic model of Mt-VF complex in simulated gastric fluid
Figure 17c. Higuchi kinetic model of Mt-VF complex in simulated gastric fluid
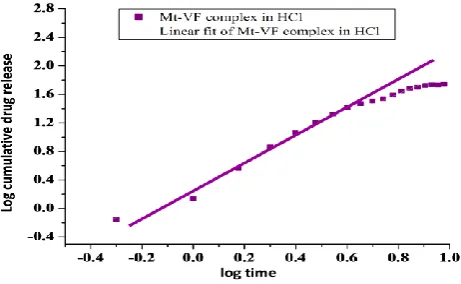
Figure 17d. Korsmeyer-Peppas kinetic model of Mt-VF complex in simulated gastric fluid
Element Mt Mt-VF complex
Weight% Atomic% Weight % Atomic %
Table 4. Release kinetics of Mt-VF complex in simulated gastric fluid (HCl, pH 1.2)
In stimulated intestinal fluid, PBS (pH 7.4) the pure VF shows a rapid burst (releasing 42 % of the drug) in the initial 0.5 h followed by 100 % release of the drug over a period of 3.5 h. In case of Mt-VF complex no release of VF was observed up to 10.5 h. This indicates that VF release was greatly influenced by the pH of the releasing media.35
In vitro drug release data suggest that the synthesized Mt-VF complex are able to extend the release of Mt-VF in gastric fluid (acidic media, pH 1.2) beyond 8 h. As a result more amounts is expected to reach liver for its complete absorption.48
The release data of VF form Mt-VF complex were fitted by zero order (Fig. 17a), first-order kinetics (Fig. 17b), Higuchi (Fig. 17c) and Korsmeyer-Peppas models (Fig. 17d) and the values of release kinetics constants in simulated gastric (HCl, pH 1.2) fluid are summarized in Table 4. In (HCl, pH 1.2) the first order equation gave the best representation of the release data .49
CONCLUSIONS
VF sustained release formulation was prepared successfully using natural clay mineral Mt as a host to retard the drug release. Intercalation of VF in Mt layers was indicated by XRD. The adsorption isotherms of VF on Mt were best fitted by the Langmuir model and the adsorption kinetics followed the pseudo second-order kinetic model. Drug release kinetics of this formulation corresponds best to first order model in gastric media (pH 1.2). In vitro drug release data suggest that the synthesized Mt-VF complex is capable of gradual drug release over a longer period of time in gastric media (pH 1.2) as compared to pure drug thereby increasing the availability of the drug for absorption in liver. Thus the obtained results are proposing a possibility of new formulation suitable as an extended delivery carrier of venlafaxine hydrochloride.
ACKNOWLEDGEMENT
Authors are thankful to the USIC, University of Delhi for providing instrumentation facilities and CSIR for providing financial assistance to one of the authors, Shilpa Jain.
REFERENCES
1Yuan, Q., Shah, J., Hein, S., Misra, R.D.K., Acta Biomater. , 2010, 6, 1140.
2Ricka, J., Tanaka, T., Macromolecules,1984, 17, 2916. 3Hirokawa ,Y., Tanaka, T., J. Chem. Phys., 1984, 81, 6379. 4Sorby, D.L., J.Pharm.Sci.,1965, 54, 677.
5Sorby, D.L., Liu, G., J. Pharm. Sci.,1966, 55, 504.
6Aguzzi,C., Cerezo,P., Viseras,C., Caramella,C., Appl. Clay Sci.,
2007,36, 22.
7Peppas, N.A., Int. J Pharm.,2004, 277, 11.
8Nair, L.S., Laurencin, C.T., Prog Polym Sci., 2007, 32, 762. 9Coviello, T., Matricardi, P., Marianecci, C, Alhaique, F., J.
Control. Releas., 2007,119, 5.
10Wai, K.N., Banker, G.S., J. Pharm. Sci.,1966, 55, 1215. 11Carretero, M. I., Pozo, M., App. Clay Sci., 2009,46, 73.
12Lee, Y.H., Kuo, T.F., Chen, B.Y., Feng, Y.K., Wen, Y.R., Lin,
W. C., Lin, F.H., Biomed. Eng. Appl., Basis Commun.,2005,
17, 72.
13Feng, S.S., Mei, L., Anitha, P., Gan, C.W., Zhou, W., Biomaterials, 2009, 30, 3297.
14Dong, Y., Feng, S.S., Biomaterials, 2005, 26, 6068.
15Chen, Y.M., Zhou, A.N., Liu, B., Liang, J., Appl. Clay Sci., 2010, 49,108.
16Joshi, G.V., Kevadiya, B.D., Patel, H.A., Bajaj, H.C., Jasra, R.V., Int. J. Pharm., 2009, 374, 53.
17Meng, N., Zhou, N.L., Zhang, S. Q., Shen, J., Int. J. Pharm.,
2009, 382, 45.
18Joshi, G.V., Patel, H.A., Bajaj, H.C., Jasra, R.V., Coll. Polym.
Sci., 2009, 287, 1071.
19Joshi, G.V., Kevadiya, B.D., Bajaj, H.C., Micropor. Mesopor. Mater., 2010, 132, 526.
20Chen, B.Y., Lee Y.H., Lin W.C., Lin F.H., Lin K.F., Biomed. Eng. Appl., Basis Commun., 2006, 18, 30.
21Entsuah, R., Chitra, R., Psychopharmacol. Bull., 1997, 33, 671. 22Klamerus, K.J., Maloney, K., Rudolph, R.L., Sisenwine, S.F.,
Jusko, W.J., Chiang, S.T., J. Clin. Pharmacol., 1992, 32, 716.
23Haskins, J.T., Moyer, J.A., Muth, E.A., Sigg, E.B., Eur. J. Pharmacol., 1985,115, 139–146.
24Olver, J.S., Burrows, G.D., Norman, T.R., CNS Drugs, 2001, 15(12), 941.
25Patel, H. A., Shah, S., Shah, D.O., Joshi, P.A., Appl. Clay Sci.,
2011, 51, 126.
26Rx list, the internet drug index,
http://www.rxlist.com/effexor-xr-side-effects-drug-center.htm
27Dash,S., Murthy,P.N., Nath. L., Chowdhury,P., Acta Pol. Pharm.
Drug. Res., 2010, 67, 217.
28Singhvi,G., Singh,M., Int. J. Pharm. Stud. Res., 2011,January- March,77.
29Costa, P., Lobo, J.M.S., Eur. J. Pharm. Sci., 2001, 13,123. 30Raghvendra, R. S.,Int. J. Pharm. Sci. Rev. Res., 2012, 17, 51. 31Lavanya, K., Sunitha, P., Kumar, A., Ramana, K.V., Int. J.
Pharm. Qual. Ass., 2013, l4 ,1.
32Rao, K.S., Jadhav, S., Patil,, P., Dattatraya, B.U., Int. Res. J. Pharm., 2011, 2, 261.
33Patel, B., Patel, J., Banwait, H., Darji, N., Patel, D., Gabhawala,
A., Patel, B., Patel, M., Int. J. Inst. Pharm. Life Sci., 2011, 1.
Release media
Zero order, C=K0t First order, logC=logC0-k1t/2.303 Higuchi, Q=KHt1/2 Korsmeyer-Peppas, Mt/M∞=ktn
R2 K0, h-1 R2 K1, h-1 R2 K
H(-1/2) R2 n Kkp, h-n
34Shah. S., Pal. A., Kaushik, V. K., Devi, S.,J. Appl. Polym. Sci., 2009,112, 2876.
35Seema, Datta, M., Eur. Chem. Bull., 2013,2, 942. 36Alzaydien, A.S., Am. J. Environ. Sci., 2009, 5, 197.
37Aronhime, J., Dolitzky ,B.Z., Nisnevish ,G., Wizel,S., US patents
US20020143211 A1 Oct 3, 2002.
38Das, P.R., Nanda, R.M., Behara, A., Nayak, P.L., Int. Res. J. Biochem. Bioinform., 2011,1,35.
39Olad, A., Advances in Diverse Industrial Applications of
Nanocomposites, Chapter 7, 1st edition ,India: Intech,
2011,113. ISBN: 978-953-307-202-9,
40Zampori, L., Stampino, P.G., Cristiani, C., Cazzola, P., Dotelli,
G., Appl. Clay Sci., 2010, 50, 266.
41Sivalakshmidevi, A., Vyas, K., Rao, S.M., Reddy, G.O., Acta Cryst. Sect. E. 2002, 58, 1072-1074
42Abdeen, R., Salahuddin, N., J. Chem., 2013, 1-9.
43Entsuah, R., Chitra, R., Psychopharmacol. Bull., 1997, 33, 671. 44He, H., Ding ,Z., Zhu, J., Yuan, P., Xi, Y., Yang, D., Frost, R.L.,
Clays Clay Miner., 2005,53, 287.
45Roy, S., Aitipamula, S., Nangia, A. Cryst. Growth Design,2005, 5, 2268.
46Bernardi, L.S., Oliveira, P.R., Murakami, F.S., Silva, M.A.S.,
Borgmann, S.H.M., Cardoso, S.G., J. Therm. Anal. Calorim.,
2009,97, 729.
47http://www.healthcentral.com/druglibrary/408/effexor xr-clinical_pharmacology.html
48Singh, G., Ghosh,B., Kaushalkumar, D., Somsekhar,V., AAPS
PharmSciTech, 2008, 9(3), 791.
49Ajit, I., Senthil, A., Rahul, B., Narayanaswamy, V.B., Int. J.
Pharm., 2012, 3, 226.