Rare HIV-1 transmitted/founder lineages
identified by deep viral sequencing contribute
to rapid shifts in dominant quasispecies
during acute and early infection
Gustavo H. Kijak1,2¤a*, Eric Sanders-Buell1,2, Agnes-Laurence Chenine1,2, Michael A. Eller1,2, Nilu Goonetilleke3, Rasmi Thomas1,2, Sivan Leviyang4, Elizabeth
A. Harbolick1,2, Meera Bose1,2, Phuc Pham1,2, Celina Oropeza1,2, Kultida Poltavee1,2, Anne Marie O’Sullivan1,2, Erik Billings1,2, Melanie Merbah1,2, Margaret C. Costanzo1,2, Joanna
A. Warren3, Bonnie Slike1,2, Hui Li5, Kristina K. Peachman1,2, Will Fischer6, Feng Gao7, Claudia Cicala8, James Arthos8, Leigh A. Eller1,2, Robert J. O’Connell9, Samuel Sinei10,
Lucas Maganga11, Hannah Kibuuka12, Sorachai Nitayaphan9, Mangala Rao1, Mary A. Marovich13, Shelly J. Krebs1,2, Morgane Rolland1,2, Bette T. Korber6, George M. Shaw5,
Nelson L. Michael1, Merlin L. Robb1,2, Sodsai Tovanabutra1,2, Jerome H. Kim1¤b
1 U.S. Military HIV Research Program, Walter Reed Army Institute of Research, Silver Spring, MD, United
States of America, 2 Henry M. Jackson Foundation for the Advancement of Military Medicine, Bethesda, MD, United States of America, 3 School of Medicine, The University of North Carolina at Chapel Hill, Chapel Hill, NC, United States of America, 4 Department of Mathematics and Statistics, Georgetown University, Washington, DC, United States of America, 5 Perelman School of Medicine, University of Pennsylvania, Philadelphia, PA, United States of America, 6 Theoretical Biology, Los Alamos National Laboratory, Los Alamos, NM, United States of America, 7 Duke Human Vaccine Institute, Duke University Medical Center, Durham, NC, United States of America, 8 Laboratory of Immunoregulation National Institute of Allergy and Infectious Diseases, National Institutes of Health, Bethesda, MD, United States of America, 9 Armed Forces Research Institute of Medical Sciences, Bangkok, Thailand, 10 Walter Reed Project, Kericho, Kenya,
11 Mbeya Medical Research Programme, Mbeya, Tanzania, 12 Makerere University-Walter Reed Project,
Kampala, Uganda, 13 Vaccine Research Program, National Institute of Allergy and Infectious Diseases, National Institutes of Health, Rockville, MD, United States of America
¤a Current address: GSK Vaccines, Rockville, MD, United States of America ¤b Current address: International Vaccine Institute, Seoul, South Korea *[email protected]
Abstract
In order to inform the rational design of HIV-1 preventive and cure interventions it is critical to understand the events occurring during acute HIV-1 infection (AHI). Using viral deep sequencing on six participants from the early capture acute infection RV217 cohort, we have studied HIV-1 evolution in plasma collected twice weekly during the first weeks follow-ing the advent of viremia. The analysis of infections established by multiple transmitted/ founder (T/F) viruses revealed novel viral profiles that included: a) the low-level persistence of minor T/F variants, b) the rapid replacement of the major T/F by a minor T/F, and c) an ini-tial expansion of the minor T/F followed by a quick collapse of the same minor T/F to low fre-quency. In most participants, cytotoxic T-lymphocyte (CTL) escape was first detected at the end of peak viremia downslope, proceeded at higher rates than previously measured in HIV-1 infection, and usually occurred through the exploration of multiple mutational path-ways within an epitope. The rapid emergence of CTL escape variants suggests a strong
a1111111111 a1111111111 a1111111111 a1111111111 a1111111111 OPEN ACCESS
Citation: Kijak GH, Sanders-Buell E, Chenine A-L,
Eller MA, Goonetilleke N, Thomas R, et al. (2017) Rare HIV-1 transmitted/founder lineages identified by deep viral sequencing contribute to rapid shifts in dominant quasispecies during acute and early infection. PLoS Pathog 13(7): e1006510.https:// doi.org/10.1371/journal.ppat.1006510
Editor: Daniel C. Douek, Vaccine Research Center,
UNITED STATES
Received: March 2, 2017 Accepted: July 3, 2017 Published: July 31, 2017
Copyright: This is an open access article, free of all
copyright, and may be freely reproduced, distributed, transmitted, modified, built upon, or otherwise used by anyone for any lawful purpose. The work is made available under theCreative Commons CC0public domain dedication.
Data Availability Statement: All nucleotide
and early CTL response. Minor T/F viral strains can contribute to rapid and varied profiles of HIV-1 quasispecies evolution during AHI. Overall, our results demonstrate that early, deep, and frequent sampling is needed to investigate viral/host interaction during AHI, which could help identify prerequisites for prevention and cure of HIV-1 infection.
Author summary
The development of safe, effective, and scalable vaccines and cure strategies to control the HIV-1 pandemic is a major public health concern. The rational design of these preventive and treatment measures requires a profound knowledge of the interaction between HIV-1 and its host during the first weeks that follow viral infection (i.e., acute infection). Here we performed a systematic and in-depth study of individuals whose infection was detected before peak viremia and before the emergence of the first antibody responses. Plasma sa-mples were collected twice weekly during acute infection and we performed next-genera-tion sequencing of the viral swarms. In most participants, we first detected viral escape from the initial adaptive cellular immune responses at the end of peak viremia downslope. Viral escape proceeded at higher rates than previously measured in HIV-1 infection and usually through the exploration of multiple mutational pathways. The analysis of se-quences from infections established by multiple viral lineages revealed dramatic shifts in the frequencies of the viruses that composed the HIV-1 population within each host. These results, using early, deep, and frequent sampling, support rapidly changing viral lin-eages likely in response to both adaptive cellular immunity and possibly other host responses during acute HIV-1 infection.
Introduction
Despite the success of human immunodeficiency virus type 1 (HIV-1) preventive campaigns
[1] and the use of combined antiretroviral therapy (cART) in managing the disease [2], there is
still a great need for safe, effective, and scalable strategies to prevent and cure HIV-1 infections
worldwide [3]. In order to inform the rational design of new interventions it is critical to
understand the events occurring during acute HIV-1 infection (AHI), which play a central
role in determining the course of the disease [4,5].
The pathogenesis of AHI is attended by profound virological and immunological changes:
viral trafficking from the portal of entry to lymphatic tissues [6], extensive viral expansion
fol-lowed by partial contraction [7,8], massive CCR5+ CD4+ T-cell depletion in the
gut-associ-ated lymphoid tissue (GALT) [9,10], activation of innate immunity effectors with increased
cytokine secretion (i.e., “cytokine storm”) [11], and development of the first adaptive immune
responses [12–14]. Early during AHI the latent viral reservoir -the major obstacle for HIV-1
eradication [15,16]- is seeded [17,18], and the initial and irreversible injury to the immune
system occurs [19]. Acute HIV infection has lasting significance, as the peak plasma viral load
(pVL) is correlated with pVL set point [5]–a strong correlate of prognosis [20].
HIV-1 sequences sampled during acute and early HIV-1 infection have been used to study
the viral population bottleneck following transmission [21–27], viral demographic processes
occurring during AHI [28], and early viral adaptation to host immune responses [12,14,29].
Single genome sequencing (SGS) has been an important advance in the field, allowing for the discrimination between infections established by single or multiple transmitted/founder (T/F)
Funding: Supported by the Department of Defense
through cooperative agreements (W81XWH-07-2-0067 and W81XWH-11-0174) with the Henry M. Jackson Foundation for the Advancement of Military Medicine and by the National Institute of Allergy and Infectious Diseases, National Institutes of Health (NIH), through an interagency agreement with the U.S. Army (Y1-AI-2642-17). The funders had no role in study design, data collection and analysis, decision to publish, or preparation of the manuscript.
Competing interests: GHK is currently an
viruses and for subsequent evolution of viral genomes [21,24]. More recently, next-generation
sequencing (NGS) has increased the sampling capacity [27,30,31], allowing identification of
low frequency variants and providing a more precise characterization of early viral dynamics. These molecular techniques applied to simian immunodeficiency virus (SIV)/macaque models
(reviewed in [32]), and to human cases [22–24,28,30,31] consistently showed selection of
viral variants escaping some of the early cytotoxic T-lymphocyte (CTL) responses. However, since sampling in humans is typically temporally sparse and generally begins after peak vire-mia, our understanding of viral dynamics during AHI is still incomplete. Moreover, most of our knowledge derives from infections established by a single T/F virus; little is known about viral evolution in infections established by multiple T/F viruses, which account for 20–60% of new infections [22,23,27,33].
To bridge this gap, early-capture HIV-1 infection cohorts have been developed [5,34].
Among the recent findings from these studies are the inverse correlation between CD8+ T cell
activation and pVL set point [34], and the establishment of pVL set point at viremia nadir
within the first 42 days of detectable viremia [5]. The aim of the present study was to
character-ize the complexity and dynamics of viral quasispecies during AHI. Targeted deep sequencing
(TDS) of HIV-1 [35] was performed on plasma specimens collected twice weekly, with
sam-pling starting prior to peak viremia and extending through nadir. We evaluated 6 participants: one with an infection established by a single T/F virus, and five with infections established by multiple T/F viruses.
The five cases with multiple T/F viruses revealed unique viral profiles, with the minor T/F variants displaying different dynamics for each participant. Rapid shifts in frequencies of T/F variants were observed over the course of 1–3 weeks during AHI, beginning prior to viremia nadir and, in one case, prior to peak viremia. In most participants, variation at CTL epitopes implying escape was first detected at the end of peak viremia downslope, proceeded at higher rates than previously measured in HIV-1 infection, and usually occurred through the explora-tion of multiple mutaexplora-tional pathways. In some participants with multiple T/F viruses, the pro-cesses of CTL escape and outgrowth of minor T/F variants occurred concurrently. These results, combining early, deep, and frequent sampling, allowed us to investigate AHI with unprecedented timing and resolution, and support a dynamic model of AHI with rapidly changing viral lineages, likely in response to both CTL and possibly other host responses.
Results
Study participants
Six participants (3 male and 3 female) from the RV217 AHI cohort were studied. The 6 study participants presented here constitute a subset of the larger RV217 cohort, and were selected for longitudinal analysis based on criteria explained in detail in Materials and Methods. Briefly, participants 20225, 40100, and 40061 had been initially selected for a longitudinal study of
CTL responses [36] and participants 40436, 10463 and 40265 were selected based on
longitudi-nal FL SGS-based alongitudi-nalysis from pre-peak viremia through 6 months post-infection (p.i.), which showed homogeneous viral populations at pre-peak viremia and detected the presence of additional T/F variants at viremia nadir (participants 40436 and 10463) or at 6 months p.i. (participant 40265). All of the selected participants had at least one sample before HIV-1 infec-tion, and had 2 or more HIV ELISA-negative/HIV-1 NAT-reactive samples.
Their socio-demographic characteristics and reported risk factors are shown inTable 1.
of 3.5 days (range: 2–14 days) (Table 2). By employing twice-weekly sampling (Table 3), viro-logical and seroviro-logical markers were followed with very high resolution. The pVL and CD4+
cell counts are shown for each case inFig 1A. Peak viremia (range: 5.79–7.99 log10copies/ml)
occurred 9–18 days from the onset of viremia. Participants from Thailand were infected with CRF01_AE, while participants from Kenya and Uganda were infected with unique recombi-nant forms of subtype A1 with either subtype C (participant 20225) or subtype D (participant 10463).
Table 1. Socio-demographic and risk characteristics of 6 participants from the acute HIV-1 infection cohort RV217.
Participant Sexa Age (years) Riskb Country Year of infection
20225 F 24 Unprotected sex with 3 or more partners Kenya 2010
40100 M 18 Received money or goods for sex Thailand 2010
40061 F 48 Reported sex work
Received money or goods for sex
Thailand 2009
40436 M 29 Reported sex work
Received money or goods for sex
Unprotected sex with known HIV positive partner Unprotected sex with 3 or more partners Reported STI symptom
Thailand 2011
10463 F 24 Reported sex work
Reported STI symptom
Uganda 2011
40265 M 23 Reported sex work
Received money or goods for sex Unprotected sex with 3 or more partners Reported STI symptom
Thailand 2010
a
F: Female; M: male. b
Participants reported their risk for HIV-1 infection through an audio computer-assisted self-interview. STI: Sexually transmitted infection.
https://doi.org/10.1371/journal.ppat.1006510.t001
Table 2. Clinical characteristics of 6 participants from the acute HIV-1 infection cohort RV217.
Participant NAT -conversion windowa
(days)
Peak viremia Nadir viremiac HIV Serology Viral
subtypee
Dayb (log10
copies/ml) (log10 copies/ml) EIA-conversion (day)b Western blot (dayb; resultd)
20225 4 d9 7.99 5.12 d14 d14 (P) A1/C URF
40100 7 d10 8.46 5.71 d10 d10 (N); d17 (I); d24 (P) CRF01_AE
40061 3 d14 5.79 3.55 d18 d18 (I); d21(I); d28 (P) CRF01_AE
40436 2 d18 6.09 4.78 d14 d14 (I); d21(I); d28 (I); d35
(P)
CRF01_AE
10463 14 d13 6.62 4.59 d13 d13 (N); d20 (P) A1/D URF
40265 2 d12 6.49 4.62 d19 d19 (N); d21(I); d28 (P) CRF01_AE
a
NAT: Nucleic acid testing; Conversion window: time from last negative to first positive NAT. b
days since first positive viremia. c
Nadir viremia: lowest plasma viral load after the peak through d42. d
N: negative; I: indeterminate; P: Positive. e
URF: Unique recombinant form.
Viral dynamics during AHI
For all of the studied participants, full-length (FL) SGS-derived sequences sampled at pre-peak
viremia (d2-d7) showed homogeneous quasispecies (Fig 1B). After excluding genomes
con-taining G-to-A hypermutation, sequences followed a star-like phylogeny with computed mean
Hamming distances and estimated times to most recent common ancestors (tMRCA) (S1
Table) in agreement with previous reports of Fiebig stage II subjects [21,24]. Sampling depth of this initial analysis was only 10–12 sequences per subject, giving a statistical likelihood of
only 0.65–0.72 for the detection of minor sequence variants present at 10% frequency [21].
Thus, to obtain a more sensitive and precise estimate of the number of T/F viruses that were responsible for productive clinical infection in these very high-risk subjects, we performed TDS at the earliest AHI samples (i.e., from the first positive NAT through peak viremia). For subject 20225, we confirmed the presence of a single T/F sequence lineage, but for the other five participants, we identified one or more additional sequence lineages whose members were
present in low abundance (0.3–4.3% of sequences) (Fig 1C). The maximum within-subject
diversity in the five subjects infected with multiple lineages ranged 0.7–2.2%. The comparison of within- and between individual HIV-1 genetic distances in East Africa and Thailand sup-ports that these five RV217 participants had acquired their multiple variant infections from
single sexual partners (S1 Fig). The frequency of new HIV-1 infections in the RV217 cohort
established by multiple lineages is the subject of ongoing investigation (seeMaterials and
Methods).
Dynamics of infection established by a single T/F virus
Participant 20225. SGS analysis was consistent with a single T/F at pre-peak viremia (Fig
1B), and TDS analysis showed a concordant result (Fig 1C). TDS-based sequences from AHI
exhibited limited variation while sequences from 6 months p.i. carried numerous variants with
non-synonymous substitutions and in-frame deletions (S2 Fig). This profile was reiterated in
all subgenomic regions tested and is consistent with the model for infections established by a
single T/F virus [24], where pre-peak viremia HIV-1 populations are highly homogeneous.
Infections established by multiple T/F viruses
Participant 40100. At pre-peak viremia, the TDS analysis of multiple loci (i.e., reverse
transcriptase (RT) region ofpol, V5 region inenv, andnef) showed the presence of a minor
variant at 1.8–4.3% frequency (Fig 1C). In each of these loci, the minor variant was
distin-guishable from the contemporaneous SGS consensus (henceforth referred to as the “major
Table 3. Early and frequent sampling during acute HIV-1 infection (AHI) in 6 participants from RV217.
Participant Sequenced AHI samplesa(n) First sequenced sampleb(day) Sampling interval (days)
Median Range
20225 9 5 4 3–5
40100 9 2 3.5 2–5
40061 8 7 4 3–14
40436 8 4 3 3–4
10463 9 7 4 3–7
40265 9 7 5 2–8
a
AHI is defined as the period from the advent of viremia to the early nadir/set-point occurring within 42 days of the advent of viremia (see text for details). b
Days since the first positive viremia.
Fig 1. Viral load dynamics and pre-peak viremia HIV-1 genetic diversity in 6 participants from the RV217 cohort. a) Plasma
variant”) by multiple polymorphisms (S3 Fig). Using sequence-specific primer (SSP)-PCR amplification on the d2 sample we retrieved and reconstructed a nearly FL sequence of the minor variant. The minor variant was related to, but distinct from the d2 SGS-derived major
variant (FL genetic distance: 1.4%;S2 Table), with polymorphisms dispersed throughout the
genome (Fig 1B). The observed diversity between major and minor variants supports the
hypothesis that they had been acquired from the same donor (S1 Fig).
Frequent TDS sampling during the entire AHI period from days 2 to 31 identified the
minor variant at very low frequency (0.5–4.3%) between days 2 and 14 (Fig 2andS3 Fig), and
then progressive increases to a frequency of 27–57% by day 31. Analysis of the emergence of the minor variant was confounded by substantial recombination between sequences evolved from the two T/F lineages: by day 31, 5/11 near FL genomes were either the minor T/F or
recombinant, and by 6 months p.i., all sequences were recombinant (S4 Fig). This observation
is consistent with prior findings [33]. During early AHI, most of the sequence variation
ob-served within the studied loci was due to proportional shifts between the major and minor
var-iants, and only limited variation was accrued throughde novomutations (see CTL escape,
below) or recombination between major and minor variants within a subgenomic region. This observation suggests that outgrowth of minor T/F or recombination between minor and major T/Fs may confer advantages in establishing escape with high viral fitness.
Participant 40061. At pre-peak viremia, TDS analysis of multiple loci (P2-coding region
ingag,vif,vpr, and Gp41-coding region inenv) detected a minor variant at 1.8–3.7% (Fig 1C).
The minor variant rapidly increased in proportion between days 7 and 21, but by day 42 was virtually completely replaced by progeny from the original major variant T/F genome that had
acquired CTL escape mutations (seeFig 2andS5 Fig, and below). The dynamics of the major
and minor variants was consistent and synchronic across all the loci.
Three nearly identical FL SGS-derived sequences of the minor T/F variant were retrieved at
d14 (S6 Fig); they were related to the pre-peak viremia SGS major T/F variant (FL genetic
dis-tance: 1.8%) (S2 Table), suggesting that both T/F viruses had been acquired from a common
donor. The SGS analysis showed a profile concordant with TDS, with a predominance of major or minor T/F at d14 and d21, respectively; no inter-variant recombinants were detected out of 10 FL sequences per time point. Interestingly, the SGS profile at d42 showed only deriv-atives of the pre-peak viremia major T/F, differing from it at 6 positions -three fixed escape
mutations in CTL epitopes (see below), and three additional synonymous mutations (S6 Fig).
Participant 40436. At pre-peak viremia, TDS analysis of multiple loci (i.e., P7-coding
region ofgag, and the C3V4 andgp41regions inenv) detected two minor variants at 1.1–1.4%
(variant #1) and 0.3–0.6% (variant #2) at d21 but not at five previous time points (d4-d18) (Fig
1C). During viremia downslope, both minor variants grew rapidly, replacing>45% of the
major T/F by d28 (Fig 2andS7 Fig). FL SGS-derived sequences of the minor T/F variants #1
and #2 were retrieved at viremia downslope and were highly related to one another and to the
pre-peak viremia SGS consensus (S2 Table), supporting a single donor for the three T/F
vari-ants. At d28, a recombinant between the major T/F and minor variant #1 was also detected by
SGS (S8 Fig).
first date of NAT-positivity. Black-bordered circles depict the time points where HIV-1 sequencing was performed, and asterisks indicate samples obtained during Fiebig stage I/II. The dotted line depicts the lower limit of detection of the plasma viral load assay. b) Highlighter plots depicting the SGS-based analysis. For each SGS sequence, differences from the consensus of the major T/F virus are indicated by colored tic marks: green = A, blue = C, orange = G, red = T, and gray = deletion. c) Using TDS, the low-level presence of minor T/F viruses was detected in 5 participants; the time of first detection and their frequencies are indicated in pie charts (ranges depict measurements in different HIV-1 sub-genomic regions). Sequences of the minor T/F viruses were obtained during AHI either by SGS or by sequence-specific PCR (SSP); highlighter plots show that minor T/F viruses were highly related but distinct from cognate major T/F viruses.
Participant 10463. At pre-peak viremia, the TDS analysis detected a minor variant in the
V3 region inenvand innef(frequency: 0.5–0.6%,), and two minor variants in the V4 region in
env(minor variants V4#1: 0.3%, and V4#2: 0.6%) (Fig 1C). Minor variant V4#1 was linked to
the V3 minor variant, whereas V4#2 was linked to the V3 major variant. The minor variant in
V3 andnefremained detectable through peak viremia but was not detected in 8 subsequent
visits through d69 (Fig 2andS9 Fig). Minor variants V4#1 and V4#2 were detected at low
lev-els through viremia downslope and nadir, respectively. By 6 months p.i., the minor variants
and their derivatives represented ca. 50% of variants in V3 andnef, and had virtually replaced
the major T/F in V4. Using SSP-PCR on the d7 specimen, we retrieved and reconstructed a minor T/F variant, which matched minor variant V4#1; this T/F was highly related to the d7
SGS-based consensus (S2 Table), thus supporting a single donor for the T/F variants.
Participant 40265. At pre-peak viremia, the TDS analysis of multiple loci (P17-coding
region ingag, RNaseH- and Int-coding regions inpol, and the region coding for Gp41 in
env/second exon ofrev) detected a minor variant at 0.9–2.5% (Fig 1C). The minor variant
remained detectable at low levels (1.1–4.5%) through d82 (Fig 2andS10 Fig). By 6 months p.i.,
the minor variant contributed to the viral population (11.9–34.4%) in P17, RNAse and Int, but only marginally in env/rev (1.1%). Using SSP-PCR on the d12 specimen, we retrieved and reconstructed a minor T/F variant, which was highly related to the d7 SGS-based consensus (S2 Table), thus supporting a single donor for the T/F variants.
CTL escape
Participant 20225. In participant 20225, CTL responses against ten epitopes were
detectedex vivoat d52/d94 (S3 Table), but genetic variation during AHI was evidenced only in
two epitopes: Pol SP10 and Rev VL9 (mean epitope entropy: 0.46 and 0.65, respectively). Escape at these two epitopes evolved through an array of mutants, each containing a different single non-synonymous substitution within the epitope, with limited genetic variation in the neighboring areas. This is consistent with CTL escape through “epitope shattering”, which
describes evolution in epitopes that "during viral escape. . .exhibit multiple, highly variable,
low-frequency escape mutations. . .before coalescing on a single escape pathway" [37]. In Pol
SP10, no variation>0.5% was seen between d5 and d17. Immediately after the peak-viremia
downslope (d20) 25% of the wild type (WT) had been replaced by 12 different variants (Fig
3A), and by d36 the WT had been virtually replaced by 17 escape variants. Compared to Pol
SP10, the first evidence of CTL escape at epitope Rev VL9 was observed slightly earlier (d17), and developed much faster, with 12.4% and 82.2% of the WT being replaced by d17 and d20,
respectively (Fig 3B). In both epitopes, emergence of CTL escape coincided with a small,
tran-sient increase in viremia. The dynamics of escape showed different patterns before and after this minor rebound of viremia, with a shift in the dominance of escape variants that displaced the WT (e.g., initially SP10_02 and VL9_07, and later SP10_05 and VL9_11).
Participant 40100. In participant 40100, CTL responses against four epitopes were
detectedex vivoat d17/d94 (S3 Table), but genetic variation during AHI was present only in
Env LV9, in the Gp41-coding region (mean epitope entropy: 0.54). Despite differences between major and minor T/F variants (see above), both variants had identical nucleotide
sequences encoding for Gp41 (S11 Fig). Escape at this epitope evolved through epitope
shatter-ing. The first evidence of escape at Env LV9 was detected immediately after the downslope of
Fig 2. T/F virus dynamics during AHI in participants with infections established by multiple T/F viruses. a) The frequency of major and minor T/F lineages, and b) their contribution to the total viral load (gray
area) are shown. For clarity, different variants within a T/F lineage were combined.
peak viremia (frequency: 0.8%, at d17) (Fig 3C), and by d21 45% of WT variant had been replaced by 16 different escape variants. CTL-escape mutations were observed in the context of both T/F lineages, indicating convergent evolution. Interestingly, the replacement of WT by escape mutants occurred while the pVL remained virtually unchanged, and no shift in
domi-nance among escape variants was observed. Interferon (IFN)-γELISpot was performed at
d17 to test reactivity to different Env LV9 epitope variants (LV9_02, LV9_03, LV9_05, and LV9_11), and evidenced a decreased reactivity of those variants compared to the WT peptide (S12 Fig).
Participant 40061. In participant 40061, CTL responses against 9 epitopes were
detect-ableex vivoat d53/d90 (S3 Table), but genetic variation during AHI occurred only in four of those epitopes: Vif QY9, Vpr NY9, Vpr WL9, and Gag SM9 (mean epitope entropy: 0.31, 0.62, 0.17, and 0.81, respectively).
In epitope Gag SM9, the sequences of major and minor T/F variants differed by one residue and genetic variation occurred in two phases. During viral upslope peak, and viremia down-slope (d7- d21), the frequency of the Gag SM9 epitope variants SM9_01, associated with the
major T/F (S5 Fig), was replaced by SM9_02, within the minor T/F, with no additional
muta-tions emerging within the epitope or other sites in the TDS region (Fig 3D). During viremia
downslope (d25),de novoCTL escape was found in Gag SM9 through epitope shattering. By
d42, the population was dominated by one of the new escape mutants in the context of the
major T/F (SM9_04). Inex vivointracellular cytokine staining at d14, low-level CTL responses
were detected only against the variant SM9_01 (S13 Fig). At d25, Gag-specific responses to
variants SM9_01 and SM9_02 were observed. Responses to variant SM9_04 were below detec-tion at both time points.
In epitope Vpr NY9, the sequences of major and minor T/F variants differed by one resi-due, and the frequency of those epitope variants tracked strictly with the respective T/F
line-ages (see above), with no additional mutations emerging within the epitope (S5 Fig).
In epitopes Vif QY9 and Vpr WL9, major and minor T/F variants presented identical epitope sequences, and escape emerged in both epitopes with similar timing, pattern, and dynamics; in the major and minor T/F variants the same non-synonymous mutation emerged simultaneously, immediately after the downslope of peak viremia (d25), but subsequently
increased only in the context of the major T/F, which dominated the population by d42 (S5
Fig). Notably, a transient increase in viremia was concurrent with the fixation of the major T/F
variant carrying the threede novoCTL escape mutations at d42.
Participant 40436. Ex vivofunctional data about CTL responses were not available for participant 40436, and the comparison of pre-peak viremia and nadir SGS-derived sequences did not reveal any potential epitopes undergoing CTL escape.
Participant 10463. Ex vivofunctional data about CTL responses were not available for participant 10463, but the comparison of pre-peak viremia and nadir SGS-derived showed a
profile consistent withde novoCTL escape innef. Several lines of evidence support the
associa-tion of genetic variaassocia-tion in this area to escape from a CTL response: 1) while genetic variaassocia-tion
was accumulating in the putative epitope, node novogenetic variation was detected at
equiva-lent levels in neighboring positions; 2) the pattern and dynamics of genetic variation detected through TDS was highly consistent with epitope shattering; and 3) the emerging variants were
Fig 3. Escape from CTL responses to epitopes a) Pol SP10 (participant 20225), b) Rev VL9 (participant 20225), c) Env LV9
(participant 40100), d) Gag SM9 (participant 40061), e) putative epitope Nef DQ11 (participant 10463), f) putative epitope in Rev (codons 49–66) (participant 40265), and g) putative epitope in Env (codons 765–782) (participant 40265). In all of these epitopes, evolution of CTL escape happened through epitope shattering. The frequency of each variant and the contribution of main variants to the plasma viral load (gray area) are depicted.
concentrated in an area where HLA-B45:01-restricted Nef EQ11 CTL epitope had been
previ-ously reported [38] and this HLA allele was carried by participant 10463. In participant 10463,
the denomination of the putative epitope would be DQ11 (mean epitope entropy: 0.24). Based
on TDS, two T/F variants were detectable innef, but due to the low-level circulation of the
minor T/F variant during AHI (seeFig 2), only mutations in the context of the major T/F can
be described. In the putative Nef DQ11 epitope, emergence of escape was first observed at
peak viremia (d13) with two variants, at 0.5 and 1.1% (Fig 3E). Escape proceeded rapidly, with
12 variants replacing 95% of the WT by d23. Between d13 and d41 there was a change in the dominance of the escape variants. Six months p.i., a single epitope variant became fixed in the population, and occurred in the context of major and minor T/F viruses.
Participant 40265. In participant 40265, CTL responses against seven epitopes were
detectedex vivoat d41 (S3 Table), but genetic variation during AHI was present only in Env
(codons 765–782), and in Rev (codons 49–66) (the coordinates represent the location of the peptides reactive in IFN-Y ELISpot experiments, as the minimal epitopes have not been
mapped). In the putative Rev epitope, variants were first detected at pre-peak viremia (S14
Fig), in a context consistent with to-A hypermutation (i.e., excess of APOBEC-mediated
G-to-A changes compared to other transitions [39], occurring in the GpG and GpA dinucleotide
contexts [40,41]), which was also notable in the other subgenomic regions (Fig 1andS10 Fig).
Rapid escape through epitope shattering started at the end of viremia downslope (d26), and by d41>80% of the WT had been replaced by 10 different mutants (Fig 3F). Viral escape at the putative Env epitope started at the same time as in Rev, proceeded at a slower rate, and was
ongoing by d41 (Fig 3G). TDS reads captured the linkage between variants at the Env epitope,
at the Rev epitope, and signatures of the major and minor T/F lineages (S14 Fig), indicating
that the initial escape variants likely had emerged independently in each locus, in the context of the major T/F lineage, and later recombined.
Estimated rates of CTL escape. Escape rates measure the selective advantage of escape
mutations relative to the wild type and, under certain modeling assumptions, provide an
esti-mate of CTL kill rates [42–44]. For the epitopes described above, the escape rates averaged
over the different mutant variants are shown inTable 4. In some cases, CTL escape was
Table 4. Estimated escape rates from early CTL responses during acute HIV infection.
Participant Epitope Period Escape ratea(d-1)
20225 Pol SP10 d20-d24 0.54
20225 Rev VL9 d17-d20 >0.88
40100 Env LV9 d17-d21 >0.87
d21-d24 0.21
d17-d29 >0.53
40061 Gag SM9b d7-d11 0.15
d18-d21 0.66
d7-d21 0.42
10463 Nef DQ11 d13-d16 1.12
d23-d27 0.05
d13-d27 0.52
40265 Revc d26-d33 0.28
aIn the current analysis, we grouped all mutants together, so that the escape rate represented an average over different mutant variants.
breplacement of variant SM9_01 by SM9_02.
captured by multiple time points, and the analysis of different intervals indicate that the rates were not constant.
Cognate T/F viruses can differ in their biological properties
In vitroreplication capacity. In order to assess differences in biological properties among
cognate T/F viruses, full-length infectious molecular clones (FLIMCs) representing the 40100 major and minor T/F viruses were constructed, each expressing distinguishable reporter
genes. Inin vitrocompetition assays in primary PBMCs and in the human T-lymphoblastoid
cell line A3R5, 40100 minor T/F consistently showed a higher replication capacity than the
40100 major T/F (Fig 4A).
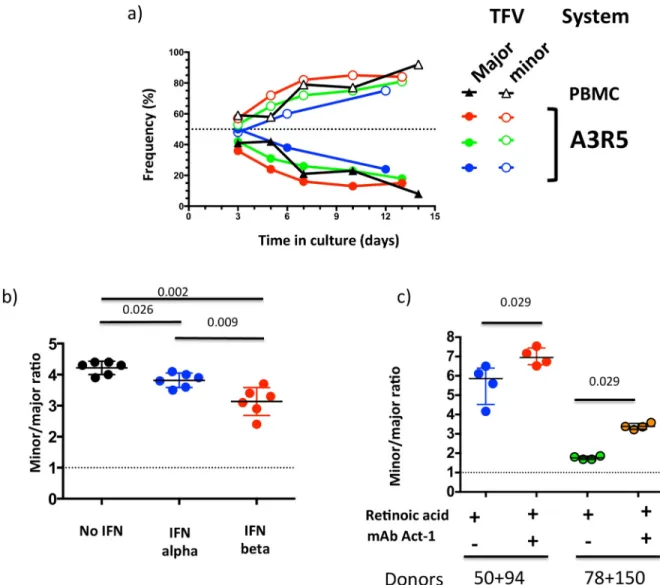
Fig 4. 40100 major and minor T/F viruses present distinct phenotypes in in vitro competition assays. a) The replication
capacity of FLIMCs from 40100 major and minor T/F viruses was compared. Lines represent the proportion of infected cells that carried each T/F virus. Colors code for each experiment, which were conducted on PBMCs or the A3R5 cell line, as indicated. b) Ratio of cells infected with minor vs. major T/F virus after 6-day culture in PBMCs in control conditions (black), and in the presence of IFN alpha (blue) or IFN beta (red). c) Ratio of cells infected with minor vs. major T/F virus after 6-day culture in RA-treated PBMCs in the absence (blue, green) or presence (red, orange) ofα4β7-blocking mAb Act-1. Data for two different PBMC donor pools, 50+94 and 78+150, are shown. In all the experiments, the initial inoculum was a 1:1 mixture of the two viruses (dotted lines). Whiskers represent interquartile intervals.
Sensitivity to type I IFNs. During AHI, around the time of peak viremia, there is a
tran-sient increase of type I IFNs [11], cytokines with recognized antiviral effects [45]. HIV-1
strains can differ in their sensitivity to type I IFNs, and viruses from AHI can present a higher
resistance to type I IFNs than cognate viruses isolated during chronic infection [46]. When
FLIMCs from 40100 major and minor T/F viruses were cultured in the presence of IFN-αor
IFN-β, both T/F variants showed a decrease of the viral replication. In competition assays in PBMCs, the 40100 minor T/F virus showed a significantly higher sensitivity to both type I
IFNs than the major T/F variant; this higher sensitivity was more marked for IFN-β(Fig 4B).
Dependence onα4β7 integrin. A major early step in AHI pathogenesis involves HIV-1
trafficking to and infection of the GALT. The GALT represents the largest pool of cells
suscep-tible to HIV-1 infection in the body and is rapidly depleted around peak viremia [9,10,47].
Viral trafficking from the portal of entry to the GALT can be mediated by the binding of
HIV-1 GpHIV-120 to theα4β7 integrin expressed on CCR5+ CD4+ T-cells [48]. The dependence of
40100 major and minor T/F viruses onα4β7 was assessed inin vitrocompetition assays in
reti-noic acid-treated PBMCs in the absence or presence of Act-1, anα4β7-blocking monoclonal
antibody (mAb).In vitrotreatment of PBMCs with retinoic acid confers CD4+ lymphocytes a
GALT-like phenotype, including the high expression of activeα4β7. In experiments using
PBMCs from different donors, blocking ofα4β7 led to a significant increase in minor-T/F
fre-quency, indicating that integrin-expressing cells are better targets for the major T/F (Fig 4C).
Discussion
In the current study we have described HIV-1 evolution from pre-peak viremia through vire-mia nadir with unparalleled resolution. We identified different profiles of viral evolution
dur-ing AHI, as summarized inFig 5. Early acute infection in cases with multiple T/F had variable
outcomes with respect to the timing and rates of outgrowth of minor variants, as well as diver-sification. Early CTL escape was more frequently observed during the downslope of peak vire-mia, but started as early as a few days within peak viremia.
Building on AHI research conducted by multiple groups for over two decades, here we
have combined recent improvements in HIV-1 cohort development [5,34] and technologies
[35] to render a more refined picture of early viral dynamics during AHI. The design of the
RV217 protocol with frequent NAT screening among high-risk participants followed by fre-quent sampling after diagnosis were key to some novel observations: 1) the characterization of viral evolution starting prior to peak viremia; 2) the clear definition of peak viremia and the profiling of fast viral dynamics in the quasispecies milieu during a narrow but decisive period during incipient HIV-1 infection; 3) the detection of low-frequency, minor HIV-1 lineages and the precise estimation of variant frequencies; and 4) the use of FLIMCs of cognate T/Fs permitted the analysis of ex vivo viral replication capacity in different host environments. The current analysis focuses on male and female study subjects, from East Africa and Thailand, infected with non-B subtypes, representing single and multiple T/F infections, and provides novel information in host/viral settings where knowledge about AHI is thus far limited. In aggregate, the abovementioned points demonstrate that, compared to previous studies, the current work presents substantial differences in both viral and host contexts, which synergisti-cally provide a significant advancement of the field.
Viral dynamics in infections established by multiple T/F viruses
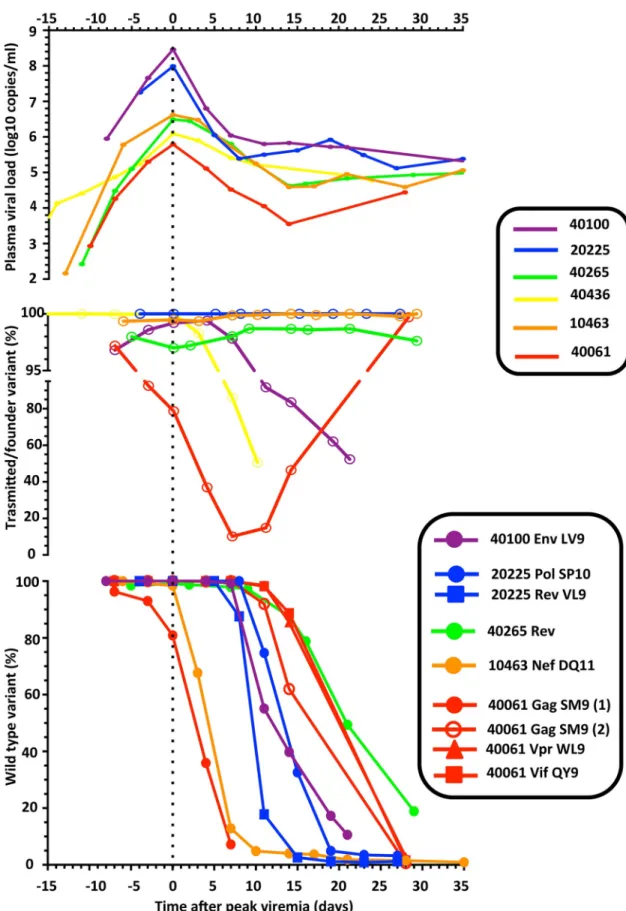
Fig 5. Summary of viral dynamics during AHI. For the 6 participants considered in the current study, we compare the
one human case [49] and in the SIV/macaque model [50], but limited information is available about viral evolution during acute infection. The current work represents the first in-depth report of the evolution of minor T/F viruses during AHI with frequent sampling before and after peak viremia to document changes prior to establishing viral load set point.
What are the mechanisms responsible for the initial imbalance between major and minor T/F viruses? The low frequency of minor T/F viruses at pre-peak/peak viremia observed here could represent a combination of selective and stochastic processes occurring during the eclipse phase. Recent experiments in the SIV/macaque model using mixtures of phenotypically identical FLIMCs distinguishable by molecular barcodes showed that some of these infections could be established by multiple T/F viruses with the minor variant present at pre-peak viremia at 4–6%
[50]. Potential mechanisms could involve: 1) different rates of expansion of the initial infectious
foci at the portal of entry, limited either by local availability of target cells or by partially effective inhibitory innate immune mechanisms, 2) initial infection of a target cell that became quiescent
for some days and later reactivated, or 3) viral sequestration in dendritic cells [51]. In the current
work, the genetic distance among cognate T/F viruses could translate to marked phenotypic dif-ferences; thus, it is possible that the major T/F viruses may have presented advantages regarding early selective mechanisms compared to cognate minor T/F viruses.
What are the mechanisms responsible for the shifts in major and minor T/F viruses observed during AHI? Why do these shifts occur at different timing and rates in different indi-viduals? It is possible that the diverse viral profiles observed here may reflect the interplay
between viral and host factors.In vitro, the major 40100 T/F virus presented a lower sensitivity
to type I IFNs, a higher dependence onα4β7 integrin, and a lower replication capacity
com-pared to the cognate minor T/F virus. It is well established that the levels of type I IFNs [11,
52] and the availability of target cells expressingα4β7 integrin [9,10,47] show dramatic
changes in the host over the first weeks of HIV-1 infection. Thus, a possible interpretation of the results of participant 40100 is that, among other mechanisms, the major T/F had a selective advantage over the minor T/F virus in the early host environment -where type I IFNs levels
were high andα4β7-expressing target cells were abundant- while the minor T/F had a selective
advantage in the post-peak viremia host environment, where type I IFNs levels were lower and target cells in the GALT had been depleted. According to this model, as profound changes occur within the host environment during AHI, the relative benefit accompanied by a particu-lar viral phenotypic trait may erode or even become a detriment.
The abovementioned interpretation derives from ex vivo experiments performed on
cog-nate T/F viruses from a single participant. Thus, it is important to note that thein vivoviral
dynamics in the other studied participants may be due to mechanisms other than IFN sensitiv-ity and integrin dependence, especially considering: 1) the diverssensitiv-ity in profiles, and 2) the pos-sibility that each pair of cognate T/F viruses may differ in other sets of biological properties. Moreover, it is possible that even small differences between hosts and between infecting viral swarms may act in synergy to result in marked different inter-individual profiles of viral dynamics during AHI. For instance, in 40061, major and minor T/F viruses differed in the sequence within epitope Gag SM9, which opens the possibility that the early replacement of major T/F by the minor T/F could be associated with CTL responses. The kinetics of
replace-ment of the major T/F show a profile consistent with other CTL escapes (Fig 5, lower panel),
and the early presence ofex vivoresponses towards the major but not the minor T/F sequence
the curves were aligned based on day of peak viremia. For epitope Gag SM9 in participant 40061, the initial replacement of the major T/F by the minor T/F sequence is indicated separately from the later escape that proceeded through epitope shattering (1 and 2, respectively). For participant 40265, the CTL epitope in Rev has not been mapped.
would support this hypothesis. However, the low level of the measured response could also indicate that the observed dynamics was only marginally impacted by CTLs, and could be due to other phenotypic differences between cognate 40061 T/F viruses, as indicated for 40100. The biological characterization of cognate T/F viruses from other participants is in progress.
Importantly, many of the changes in the host environment occurring during AHI take
place at a time or anatomical location that are logistically hard to systematically sample [47,
53]. Consequently, in infections established by multiple T/F viruses, the combination of the
study of viral dynamics and the biological characterization of cognate T/F viruses may help reveal important host phenomena that are not apparent in infections established by single T/F viruses. The use of IMCs from infections established by multiple T/F viruses could be applied inex vivoand animal models to test alternative hypotheses for selective pressures contributing to the variation reported here.
In the cases of participants 40061, 40100 and 40436, the analyzed time points allowed us to study the dynamics of the outgrowth of the minor T/F lineage with great detail. However, in the cases of participants 10463 and 40265, the outgrowth of the minor T/F occurred during a period that was not sampled. Nevertheless, the latter two cases remain important as they illus-trate: a) that minor T/F viruses can persist at low levels during AHI, and b) that minor T/F lin-eages can represent a source of genetic material that can accelerate the viral genetic
divergence, with the potential to allow for more rapid viral escape from immune effectors.
Timing and dynamics of CTL escape
In most study participants, the emergence of HIV-1 CTL escape in plasma was first detected during the downslope of peak viremia. In 10463, viral evolution consistent with CTL escape was first detected around peak viremia, a timing consistent with non-human primate (NHP)
models [53,54], recent results confirming pre-peak viremia T cell response in HIV-1/humans
[34,36], and HIV-1 phylogenetic analysis of diversity post-peak viremia [28,30]. In all cases,
CTL escape proceeded rapidly. In several CTL escapes, WT frequency fell from>90% to
<50% within one week. The fast rate of replacement of WT by escape mutants supports strong
selective pressure exerted by the CTLs [43,55]. The rates of CTL escape we measured are high
relative to previous escape rates measured in HIV-1/humans: we find rates>0.8 d-1while
pre-vious rate estimates are<0.5 d-1[12,28,30,31,56]. However, the escape rates we measured
are in the same range as escape rates found in acute infection for NHP models [43].
Further-more, recent results characterizing T cell response in AHI suggest the strongest CTL-mediated
selective pressure may occur during the downslope of peak viremia [34,36], a period we
cap-ture through multiple time points within each individual but that previous studies have missed
or captured with a single time point [12,28–31,56,57].
The use of TDS provided evidence of epitope shattering [37] as a major mechanism of
escape from early CTL responses during AHI, highlighting the genetic plasticity of the virus and indicating the development of a diverse viral genetic pool during the first weeks following viral transmission. Interestingly, while in some participants CTL escape proceeded as the pVL remained virtually unchanged (e.g., 40100), in other cases we noticed a transient and modest increase of pVL, coinciding with a change in dominance of escape variants (e.g., 20225). Among the possible causes for this are: a) differences in fitness between WT and escape
vari-ants, and among escape variants [58], and b) the emergence of new CTL clonotypes with
broader variant recognition [59]. The underlying mechanism linking pVL dynamics with CTL
escape and the change in escape dominance warrant further study.
note that viral escape was detected in some but not all of the initially targeted epitopes. This
phenomenon has been previously described and studied by several groups (e.g., [29,58,60]),
and is likely influenced by host (e.g., genetic background, magnitude/quality of CTL response) and viral factors (e.g., genetic barrier to escape, viral fitness, capacity of targeted protein accommodate sequence change).
Implications of fast viral dynamics during AHI
The study of multiplicity of infection has potential epidemiological [33] and clinical [61]
impli-cations. A recent in-depth analysis of HIV-1 superinfection during chronic infection suggests that minor viral variants may play an important role in the development of breadth of humoral
adaptive immune responses [62]. It will be important to explore if the low-level circulation of
minor T/F variants from the onset of the infection could also affect the later development of breadth of humoral immune responses.
Study limitations
The current study has several limitations, including the number of study participants, the examination of viral variation in subgenomic regions, and the sampling of viral quasispecies in the plasma compartment only, in lieu of genital or gastrointestinal tract sampling. As
previ-ously recognized [30,31], the intensive technical approach followed in the current paper can
only be used in a small number of study participants. Thus, it is possible that other individuals infected with multiple T/F viruses might present additional profiles of viral evolution, includ-ing the persistence of minor T/F lineages at low-level beyond 6 months p.i. Moreover, the
par-ticipants analyzed in the current paper came from a high-risk cohort study [5], and were
intentionally selected to represent infections established by a) a single T/F virus or b) multiple T/F viruses where the minor variants circulated at low levels during pre-peak/peak viremia. The frequency of new infections with the latter profile is presently unknown and is the focus of ongoing investigation in the RV217 and other AHI cohorts. The current results support the need to revisit previous estimates of multiplicity of infection, by using more sensitive tech-niques, which may help improve current models of HIV-1 transmission and AHI.
The majority of the data from the current paper was acquired using TDS, a validated NGS technique that provides deep sampling of the viral quasispecies while preserving linkage
among polymorphisms [35] that is required for the definition of haplotypes representing the
different T/F variants. However, in TDS, the size of the targeted subgenomic regions is con-strained by the reading length of current, accurate, and established NGS technologies (~400 bp). While we studied multiple subgenomic regions per participant, TDS did not provide link-age among them. Generally, at the early time points examined by TDS in each participant, there was a high concordance in the frequencies of the T/F variants among the different regions. Overall, these data support that in these participants the frequency of inter-variant recombinants was relatively low during the early time points. The study of recombination between major and minor T/F viruses was further assessed by FL SGS, which preserves linkage across the entire viral genome, and the results were in agreement with TDS. However, due to the limited sampling depth of SGS, we cannot rule out the presence of recombinants arising between different T/F within a participant. Also, a new protocol for next-generation sequenc-ing, the “primer-ID”, has been recently introduced in the field, which controls for “unrecog-nized sequence resampling” and “differential amplification” that “can skew allele frequency”
[63], thus providing higher sampling accuracy. The TDS protocol applied in the current work
did not incorporate primer-ID, and thus we cannot rule out resampling. Nevertheless, high
concordant frequencies of major/minor T/F lineages in contemporary genotyping of different subgenomic regions (e.g., participant 40061) support the current TDS results. As new sequenc-ing technologies with longer readsequenc-ing length, deep, and accurate samplsequenc-ing become available, it will be important to further explore these cases.
The current study revealed early and rapid replacement between major vs. minor T/F viruses and wild type vs. CTL escape variants during AHI. Due to the frequent nature of sam-ple collection, the examined compartment was peripheral blood plasma. Thus, it is possible that local viral replication of different viral variants at mucosal sites and lymphoid tissues -each containing different frequencies and densities of target and effector cells- may follow
dif-ferent dynamics than the ones measured in plasma [53]. The systematic sampling of additional
body compartments during AHI will be necessary to address these questions. In HIV-1 infec-tion, the “eclipse phase” (i.e., the period between the time of the infection of the first cell in
body to the moment when the virus is detectable in blood plasma) lasts 7–21 days [4,64].
Thus, with currently available methods, it is not possible to rule out that the presence of multi-ple T/F lineages in plasma at Fiebig stages I/II may not be derived from multimulti-ple exposures from a common source during the eclipse phase (i.e., rapid superinfection). However, several lines of evidence strongly support that it is possible for a single risk event to result in the
trans-mission of multiple T/F lineages: a) the reported viral diversity in donor fluids (e.g.,[65]), b)
the documentation in the literature of at least 82 cases of HIV-1 infections established by mul-tiple T/Fs in heterosexuals, men who have sex with men, and intra-venous drug users (see
metadata analysis in [27] based on [21,23,27–29,33,66–68]), and c) the data from the SIV/
macaque models [69].
Conclusion
In conclusion, the current data show that HIV-1 populations can present rapid and dramatic changes before the establishment of the viral nadir. Understanding the dynamic interplay between host innate and adaptive responses and viral phenotype during AHI may be critical to the identification of the prerequisites for prevention and cure of HIV-1 infection.
Materials and methods
Ethics statement
Study RV217/WRAIR#1373: All subjects were adults and all provided written consent. For subjects that were unable to read, the consent document was read to them with an impartial witness present; the volunteer, the witness and the study staff obtaining consent signed the affi-davit with a signature or mark. All procedures and documents were reviewed and approved by local and US Army IRBs.
Study RV229/WRAIR#1386: All individuals participating in this study were adults and pro-vided written informed consent.
All studies were reviewed and approved by the human subject ethics and safety committees in each country as well as by the Walter Reed Army Institute of Research (Silver Spring, MD, USA), in compliance with all relevant federal guidelines and institutional policies.
Population under study
The current analysis focuses on six participants from the early capture AHI infection cohort
RV217, which has been described in detail elsewhere [5,36]. Briefly, the multi-center
Kampala, Uganda; Mbeya Medical Research Center, Mbeya, Tanzania; and Armed Forces Research Institute of Medical Sciences, Bangkok, Thailand. During the initial surveillance phase (phase Ia), HIV-uninfected participants were evaluated twice weekly with NAT (Aptima HIV-1 RNA Qualitative test, Hologic Inc., San Diego, CA) on a small blood volume sample collected via finger-stick. NAT was performed within 24–48 hours of sample collection, and participants with reactive results were recalled to initiate the next phase of the study (phase Ib),
which included the twice-weekly sampling of larger blood volumes for one month (Table 3).
Upon HIV-1 confirmation by standard serological methods, HIV acute cases were offered par-ticipation in long-term follow up phase. All HIV-1 positive participants were referred to care providers for management of the infection, based on national guidelines. Treatment was gen-erally made available at no cost through host nation care and treatment programs.
The cases presented in the current manuscript represent a selected subset drawn from a group of n = 40 RV217 participants for which pre-peak, immediate post-peak, and 6 months p.i. SGS sequences were available (all of which are part of the n = 50 RV217 participants
included in the principal analysis by [5]). To date, cross-sectional analysis of ~10 full-length
SGS from pre-peak viremia per participant (or pairs of half-length SGS equivalents) showed that 9/40 participants had evidence of multiple T/Fs. In the current manuscript we have pre-sented evidence that 5 individuals that had a homogeneous viral profile by SGS at pre-peak viremia had multiple T/Fs by NGS. The remainder cases are the focus of ongoing analysis.
pVL was measured using the Abbott Real-Time HIV-1 Assay (m2000 RealTime System, Abbott Laboratories, Abbott Park, IL), with a lower limit of detection of 40 copies/ml. Periph-eral blood CD4+ cell counts were determined by flow cytometry on FACSCalibur by BD Mul-titest (Becton Dickinson, Franklin Lakes, NJ). The day of first positive viremia is defined as day zero (d0) and the nadir viremia is defined as the lowest viral load after the peak viremia through d42. In the current paper, AHI is defined as the period from the advent of viremia to
the early nadir/set-point occurring within 42 days of the advent of viremia [5]. Early AHI
refers to the interval from the first positive NAT through peak viremia, while late AHI refers to the period from peak viremia to early nadir/set point. The staging system employed
through-out the current paper was as described by Fiebig et al. [70]. None of the participants included
in the present paper initiated antiretroviral treatment within the timeframe of the current analysis.
Single genome sequencing
Viral RNA (vRNA) was extracted from plasma using the QIAamp Viral RNA Mini Kit (QIA-GEN,Valencia, CA). Near FL or half-length HIV-1 genomes were amplified and sequenced
through SGS, as published [24,71].
For the six studied participants, 10–12 FL amplicons were sequenced at pre-peak viremia, and 7–11 (median: 10) FL or FL-equivalent amplicons (i.e., pairs of 5’- and 3’-half genomes) were sequenced at nadir and at 6 months p.i. Due to low pVL, the 6 months p.i. SGS sequences from participant 40061 were obtained from PBMC-derived proviral DNA. For two partici-pants, SGS-derived FL amplicons were also obtained for d14, d21, and d24 (participant 40100), and for d14 and d21 samples (participant 40061). Sequences were deposited in the GenBank under accession numbers KY580473—KY580727.
Targeted deep sequencing
For each participant, subgenomic areas of interest were selected for TDS based on the
compar-ison of SGS-derived sequences from pre-peak viremia, nadir, and 6 months p.i (S15 Fig). In
regions were constrained in size to fit within the reading length of the NGS platform (i.e., <400 bp). When multiple candidate regions were available, we selected those areas that encompassed both, differences between T/Fs and CTL epitopes.
Reverse transcription and amplification primers were tailored for each participant (S4
Table), and exploited sites of high conservation among SGS-derived sequences from different time points.
TDS was performed as previously described [35]. Briefly, using the protocol mentioned in
the SGS section (see above), vRNA was extracted from plasma and cDNA was generated through reverse transcription with SuperScript III First Strand Synthesis System (Invitrogen, ThermoFisher Scientific, Carlsbad, CA). cDNA was titrated (see below) and 2,000 copies were distributed into separate sets of tubes (Titanium Taq kit, Clontech, Mountain View, CA) for nested PCR to avoid saturation. PCR products were visualized by electrophoresis on a 1.5% agarose gel. Amplicons were separated using electrophoresis on a 2.0% agarose gel stained with crystal violet and were purified with the NucleoSpin Extract II kit (Machery-Nagel,
Du¨ren, Germany). Ion Xpress barcodes and adapters (Life Technologies, ThermoFisher
Scien-tific, Carlsbad, CA) were ligated to purified amplicons using the Ion Plus Fragment Library Kit (Life Technologies, ThermoFisher Scientific) according to the manufacturer’s instructions, fol-lowed by quantification using a 2100 Bioanalyzer (DNA 1000 kit, Agilent Technologies, Sun-nyvale, CA). Emulsion PCR (ePCR) and enrichment were carried out on OneTouch/ES or IonChef instruments with the Ion One-Touch Template or Ion PGM Hi-Q Chef kits, respec-tively (Life Technologies, ThermoFisher Scientific). Sequencing was carried out on PGM instruments using Ion 316v2 BC chips with the Ion PGM Hi-Q sequencing kit (LifeTechnolo-gies, ThermoFisher Scientific).
cDNA used for TDS was titrated by endpoint dilution [35,72] followed by nested PCR in
the same conditions that are used for library preparation. Reactions were run in quadruplicate and were visualized by electrophoresis on a 1.5% agarose gel.
Quality assurance and quality control
Technical strategies were adopted to preclude contamination across samples from the same participant, other participants, or laboratory strains. vRNA extraction was performed in bio-safety hoods with laminar flow, which had been decontaminated with RNase AWAY (Invitro-gen, ThermoFisher Scientific, Carlsbad, CA), CONFLIKT (Decon Labs, King of Prussia, PA),
copper-bis-(phenanthroline)-sulfate/H202solution (i.e., “CoPA solution”) and UV light. Each
Sequence-specific primer (SSP)-PCR
SSP-PCR was used to retrieve the sequences of the virtually FL genomes of minor T/F variants from participants 40100 (d2), 10463 (d7), and 40265 (d12) using plasma samples at early AHI. Using the information from available SGS-derived FL sequences and from TDS, primers that were specific for the minor T/F variants were designed. SSP-primers were then utilized to amplify 5–6 overlapping fragments (size range: 1,000–5,000 bp) with high fidelity Taq poly-merase (Expand High Fidelity PCR System, Roche Applied Sciences, Indianapolis, IN). When needed to fill gaps in the genomes, new SSP primers were designed based on the SSP-PCR-derived amplicons, in a new iteration. Finally, contigs were generated in Sequencher (version 5.3, Gene Codes, Anne Arbor, MI) and were compared to cognate SGS-derived FL sequences.
Sequence analysis
SGS-derived FL sequences from pre-peak viremia were studied with the Poisson-Fitter v2 tool (http://www.hiv.lanl.gov/content/sequence/POISSON_FITTER/pfitter.html) to assess the Hamming distance, to estimate the tMRCA using a Poisson model, and to test for star
phylog-eny [73], with mutation rate set at 2.16e-05and with removal of sequences that presented Fisher
exact p-values<0.1 in the built-in hypermutation test.
Alignments of SGS-derived FL sequences were generated using Geneious 3 (http://www.
geneious.com) [74], with manual editing. The Highlighter for Nucleotide Sequences v2.2.3
online tool (http://www.hiv.lanl.gov/content/sequence/HIGHLIGHT/highlighter_top.html)
[21] was used to generate highlighter plots and to determine the mosaic structure of
recombi-nants between cognate major and minor T/F variants.
The genetic distance between cognate major and minor T/F viruses was computed as the
nucleotide or amino acid p-distance in MEGA6.06 [75] (www.megasoftware.net). All
refer-ences to HIV-1 codon are based on the HXB2 coordinate system [76].
In order to calculate the epitope entropy, published amino acid HIV-1 sequences for each
epitope were downloaded from the Los Alamos HIV-1 Database using QuickAlign (http://
www.hiv.lanl.gov/content/sequence/QUICK_ALIGNv2/QuickAlign.html) and were filter for the corresponding subtype/clade (CRF01_AE for 40100 Env LV9, 40061 Gag SM9, 40061 Vif QY9, 40061 Vpr NY9, and 40061 Vpr WL9; subtype A1 for 10463 Nef EQ11, 20225 Pol SP10, and 20225 Rev VL9). Then, the Shannon entropy for each position and their means were
com-puted using Entropy (http://www.hiv.lanl.gov/content/sequence/ENTROPY/entropy_one.
html) as previously described [29].
Next-generation sequencing data analysis
Fastq files were exported from the PGM using Torrent Suite 4.4 software (LifeTechnologies, ThermoFisher Scientific). Quality control was performed using FastQC (courtesy of Dr. Simon Andrews, Babraham Institute, Cambridge, UK). Fastq files were imported into CLC Genomics Workbench version 7.0.3 (Aarhus, Denmark) to remove sequencing adapters and
trim sequences based on quality, as previously described [35], followed by barcode-based
demultiplexing. Alignment to reference was performed using tmap version 3.2.2 (by Nils
Homer, distributed throughhttps://github.com/iontorrent/TMAP) using the following
parameters: command = map2; match score = 1; mismatch penalty = 3; gap open penalty = 5; gap extension penalty = 2; and soft-clip only the right portion of the read. For each alignment, the corresponding major T/F sequence was used as a reference. Quality control of Sequence
Alignment/Map (SAM) alignments was performed using Samstat version 1.08 [77]. Nautilus
position and to determine the frequency of haplotypes. Alignments were also visualized using Tablet [79].
Based on previous assay validation [35]: 1) alignments were required to present a minimum
coverage of 50,000 reads per position to be admissible for analysis; 2) polymorphisms had to be supported by bi-directional sequencing; and 3) the lower limit of quantification for single nucleotide substitutions was set to 0.5% (though complex variants, distinguishable by multiple polymorphisms, were evidenced with a lower detection limit, under the assumption of sequencing error being independent at each position).
The reproducibility of TDS was assessed though three independent technical replicates of a
highly diverse sample from participant 20225 (i.e., d20revregion) (S16 Fig). High correlation
was observed among replicates (R2= 0.882–0.972; Spearman’sρ: 0.956–0.970), comparable
with previous reports on NGS of HIV-1 primary samples [80].
Next-generation sequencing data has been deposited in the Sequence Read Archive (SRA), National Center for Biotechnology Information, under BioProject PRJNA371358 (BioSamples: 6297991, 6298007–6298208).
Full-length infectious molecular clones (FLIMCs)
FLIMCs corresponding to 40100 major and minor T/F viruses were constructed based on the
corresponding sequences, as previously described [81]. Fluorescent reporter genes, eGFP and
mCherry [82], with distinct excitation/emission spectra were used for discrimination in
co-infection experiments (see below). Viral stocks were produced and titrated as previously
reported [81]. FLIMCs from 40100 major and minor T/F viruses utilized CCR5 but not
CXCR4 based on the GHOST coreceptor assay.
In vitro replication capacity
PBMC expansion and activation. Cryopreserved PBMC from four HIV-seronegative
donors, that had been obtained via leukapheresis in the setting of study RV229/WRAIR#1386, were rapidly thawed and washed in complete RPMI 1640 culture media containing 15% FBS, 1% Penicillin/Streptomycin and 1% L-Glutamine. The cells of two donors were combined together (to obtain two sets of two donors each: 50+94 and 78+150), expanded and stimulated
with culture media containing 0.3μg/ml of Anti-Human CD3/8 Bi-specific Monoclonal
anti-body (NIH AIDS Reagent Program) and 50U/ml of IL-2 (Roche Life Science, Indianapolis, IN). 72 hours after stimulation, a volume (equal to the original volume) of fresh culture media with IL-2 (50U/ml) was added for additional 24h. The cells were then washed, resuspended in culture media with IL-2 (20U/ml) and rested for 24h.
Kinetic of infection in PBMCs. Cells were plated in a 48-well plate at 2x 10⁶/well, setting up one well for each time point. Viruses were rapidly thawed and mixed together at major: minor T/F virus ratios of 1:1 at a multiplicity of infection (MOI) of 0.032 TCID50/cell (i.e.,
0.016 TCID50/cell for each variant). The inoculum was added to the cells as well as 2μg/ml of
polybrene (Sigma Aldrich, St Louis, MO). The media was changed at 3, 5, 7, 10 and 14 days p. i., and cells were harvested for infection assessment.
Kinetic of infection in A3R5 cells. A3R5 cells [83,84] (courtesy of Dr. Robert McLinden, obtained through the NIH AIDS Reagent Program, Division of AIDS, NIAID, NIH) were
plated in a 48-well plate at 1 x 10⁶/well in R15 containing 1mg/ml of G418 Geneticin (Life
Technologies, Thermo Fisher). Viruses were rapidly thawed and mixed together at major: minor ratios of 1:1 at a MOI of 0.016 TCID50/cell. The infection was done in presence of
20μg/ml of DEAE-Dextran (Sigma Aldrich). At 3, 5, 7, 10, and 13 days p.i., the media was