Astronomy & Astrophysicsmanuscript no. n-isotopes c ESO 2018
November 16, 2018
Nitrogen isotope fractionation in protoplanetary disks
Ruud Visser
1, Simon Bruderer
2, Paolo Cazzoletti
2, Stefano Facchini
2, Alan N. Heays
3, and Ewine F. van Dishoeck
4,21 European Southern Observatory, Karl-Schwarzschild-Straße 2, 85748, Garching, Germany e-mail:[email protected]
2 Max-Planck-Institut f¨ur extraterrestrische Physik, Giessenbachstraße 1, 85748 Garching, Germany e-mail:[email protected], [email protected], [email protected] 3 Observatoire de Paris, LERMA, UMR 8112 du CNRS, 92195 Meudon, France
e-mail:[email protected]
4 Leiden Observatory, Leiden University, P.O. Box 9513, 2300 RA Leiden, The Netherlands e-mail:[email protected]
Draft version November 16, 2018
ABSTRACT
Aims.The two stable isotopes of nitrogen,14N and15N, exhibit a range of abundance ratios both inside and outside the solar system.
The elemental ratio in the solar neighborhood is 440. Recent ALMA observations showed HCN/HC15N ratios from 83 to 156 in six T Tauri and Herbig disks and a CN/C15N ratio of 323±30 in one T Tauri star. We aim to determine the dominant mechanism responsible for these enhancements of15N: low-temperature exchange reactions or isotope-selective photodissociation of N2.
Methods. Using the thermochemical code DALI, we model the nitrogen isotope chemistry in circumstellar disks with a 2D
ax-isymmetric geometry. Our chemical network is the first to include both fractionation mechanisms for nitrogen. The model produces abundance profiles and isotope ratios for several key N-bearing species. We study how these isotope ratios depend on various disk parameters.
Results.The formation of CN and HCN is closely coupled to the vibrational excitation of H2in the UV-irradiated surface layers of the disk. Isotope fractionation is completely dominated by isotope-selective photodissociation of N2. The column density ratio of HCN over HC15N in the disk’s inner 100 au does not depend strongly on the disk mass, the flaring angle or the stellar spectrum, but it is sensitive to the grain size distribution. For larger grains, self-shielding of N2becomes more important relative to dust extinction, leading to stronger isotope fractionation. Between disk radii of∼50 and 200 au, the models predict HCN/HC15N and CN/C15N abun-dance ratios consistent with observations of disks and comets. The HCN/HC15N and CN/C15N column density ratios in the models are a factor of 2–3 higher than those inferred from the ALMA observations.
Key words.protoplanetary disks – methods: numerical – astrochemistry – radiative transfer
1. Introduction
Nitrogen has two stable isotopes,14N and15N, whose abundance ratio spans a wide range of values in the solar system: 50–280 in meteorites, 120–300 in interplanetary dust particles,∼150 in comets, 272 on Earth and 440 in the solar wind (Busemann et al., 2006; Floss et al., 2006; Manfroid et al., 2009; Marty et al., 2011; Mumma & Charnley, 2011; F¨uri & Marty, 2015). The solar wind value is representative of the gas out of which the solar system formed, so there must have been one or more mechanisms that acted to enhance15N relative to14N on Earth and in the other solid bodies.
Nitrogen isotope fractionation is also observed outside the solar system, from diffuse clouds to prestellar cores and cir-cumstellar disks (Lucas & Liszt, 1998; Wampfler et al., 2014; Zeng et al., 2017; Guzm´an et al., 2017; Hily-Blant et al., 2017). The lowest and highest14N/15N ratio are a factor of 40 apart, clearly indicating various degrees of fractionation towards dif-ferent sources. These observations were made in HCN, HNC, CN, NH3and N2H+, which are all trace species of nitrogen. The bulk reservoir likely consists of atomic N and N2, of which the isotopic composition remains unknown.
Two fractionation mechanisms have been proposed to ex-plain the 14N/15N ratios inside and outside the solar system: low-temperature isotope exchange reactions (Terzieva & Herbst,
2000; Roueff et al., 2015; Wirstr¨om & Charnley, 2018) and isotope-selective photodissociation of N2 (Liang et al., 2007; Heays et al., 2014). The low-temperature pathway is based on the difference in zero-point vibrational energies, such that heavier isotopologs are energetically favored over lighter iso-topologs. This mechanism is well known for hydrogen and deu-terium, leading e.g. to HDO/H2O and DCO+/HCO+abundance
ratios of up to a few orders of magnitude higher than the elemen-tal D/H ratio (Ceccarelli et al., 2014). The isotope-selective dis-sociation pathway, also called self-shielding, arises from a small shift in frequencies for the absorption lines through which14N
2 and14N15N are photodissociated. This shift allows photodisso-ciation of 14N15N to continue when the lines of14N
2 are sat-urated, causing an enhancement of atomic 15N over 14N. The same mechanism, acting in CO, has been suggested as an ex-planation for the oxygen isotope ratios in meteorites (Lyons & Young, 2005).
Chemical models of nitrogen isotope fractionation have been published for dense clouds and prestellar cores (Terzieva & Herbst, 2000; Rodgers & Charnley, 2004, 2008a,b; Wirstr¨om et al., 2012; Roueffet al., 2015; Wirstr¨om & Charnley, 2018), in all cases featuring low-temperature exchange reactions as the only fractionation mechanism. These models are generally successful at reproducing the fractionation observed in NH3 and HCN, but have trouble reproducing some of the data on
N2H+. Using estimated N2 self-shielding functions and an in-complete chemical network, Lyons et al. (2009) obtained an HC14N/HC15N ratio of∼350 in a simplified circumstellar disk model. With new shielding functions and a larger network, Heays et al. (2014) saw HC14N/HC15N ratios down to 50 in mod-els of a single vertical cut through a disk. The observed range of HC14N/HC15N column density ratios is 83±32 to 156±71 in a sample of six T Tauri and Herbig disks (Guzm´an et al., 2017). For C14N/C15N, there is a single measurement of 323±20 in a T Tauri disk (Hily-Blant et al., 2017).
We present here the first nitrogen isotope fractionation mod-els for circumstellar disks with a 2D axisymmetric geometry, including both low-temperature exchange reactions and self-shielding of N2. We employ the thermochemical code DALI (Dust and Lines; Bruderer et al., 2012; Bruderer, 2013) in a setup similar to that used by Miotello et al. (2014) to study the isotopologs of CO. Section 2 contains a full description of the physical framework and the chemical network. Abundance pro-files and isotope ratios for a fiducial disk model are presented in Section 3. We pay particular attention to the three cyanides HCN, HNC and CN because of the aforementioned recent ob-servations of 14N/15N ratios in HCN and CN (Guzm´an et al., 2017; Hily-Blant et al., 2017). Section 4 discusses the dominant fractionation mechanism, the match with observations, and the effects of changing various disk parameters. We summarize the main conclusions in Section 5.
2. Model
We simulate the nitrogen isotope chemistry in a set of protoplan-etary disk models with the thermochemical code DALI (Dust and Lines; Bruderer et al., 2012; Bruderer, 2013). Given a two-dimensional, axisymmetric density profile, DALI uses a Monte Carlo technique to compute the radiation field and dust temper-ature throughout the disk. The gas tempertemper-ature is solved by it-erating over the heating/cooling balance and the chemical abun-dances. DALI approximates the excitation of the main coolants through an escape probability approach, taking into account both collisions and radiative effects. Once the gas temperature and abundance calculations are completed, a raytracer synthesizes continuum and line observations at arbitrary distances and incli-nations. The accuracy of DALI has been verified against bench-mark problems and observations (Bruderer et al., 2012, 2014; Bruderer, 2013; Fedele et al., 2013).
Our methods are generally the same as those developed by Miotello et al. (2014) for CO and its isotopologs, except the focus has shifted to N-bearing species. The following subsec-tions summarize the physical framework and describe the re-vised chemical network.
2.1. Physical framework
The purpose of this work is to present a general exploration of the nitrogen isotope chemistry in protoplanetary disks, without focusing on any one particular source. Isotope effects depend primarily on the gas temperature and the UV flux, so we adopt a small grid of parameterized models to cover a range of values for both quantities (Tables 1 and 2).
The disk models have a power-law surface density (Σ∝R−γ) with an exponential taper beyondRc = 60 au (Andrews et al., 2011). The gas densities follow a vertical Gaussian profile with a scale height angleh =hc(R/Rc)ψ, whereψvaries from 0.1 to 0.3 to cover a range of flaring angles. The dust consists of popu-lations of small grains (0.005–1 µm) and large grains (1-1000
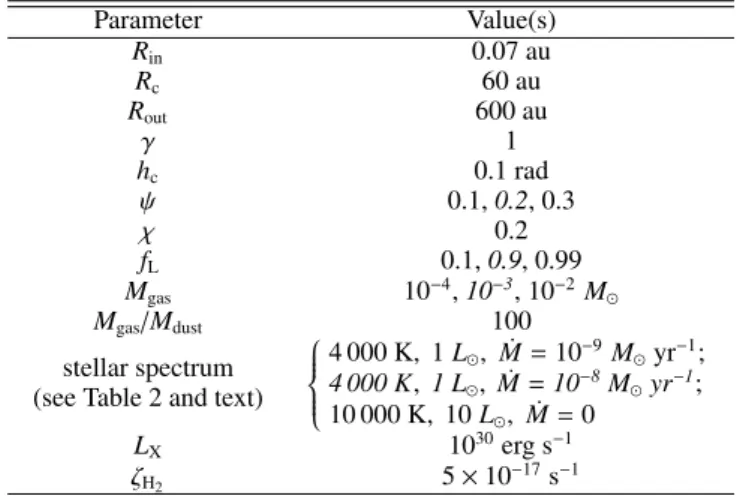
Table 1.Summary of model parameters.
Parameter Value(s)
Rin 0.07 au
Rc 60 au
Rout 600 au
γ 1
hc 0.1 rad
ψ 0.1,0.2, 0.3
χ 0.2
fL 0.1,0.9, 0.99
Mgas 10−4,10−3, 10−2M
Mgas/Mdust 100
stellar spectrum (see Table 2 and text)
4 000 K, 1L, M˙ =10−9Myr−1; 4 000 K, 1 L, M˙ =10−8Myr−1;
10 000 K, 10L, M˙ =0 LX 1030erg s−1
ζH2 5×10
−17s−1
Notes.Values in italics are used in the fiducial model.
Table 2.Luminosities integrated over various wavelength ranges for the model spectra.
Type M˙ L∗ Lacc L6−13.6 eV L912−1000 Å (Myr−1) (L) (L) (L) (L)
Herbig 0 10 0 7.7(−1) 2.2(−3) T Tauri 1(−8) 1.0 2.3(−1) 1.8(−2) 5.0(−5) T Tauri 1(−9) 1.0 2.3(−2) 1.8(−3) 5.0(−6) T Tauri 1(−10) 1.0 2.3(−3) 2.0(−4) 5.0(−7) T Tauri 0 1.0 0 2.7(−5) 1.8(−12)
Notes.The notationa(−b) meansa×10−b.
µm; D’Alessio et al., 2006). The small grains have the same scale heighthas the gas, while the large grains have settled to a reduced scale height of χh withχ = 0.2. We explore diff er-ent grain size distributions by varying the mass fraction of large grains (fL) from 10% to 99%. The global gas-to-dust mass ratio is constant at 100. Within the grid of models, the total disk mass varies between 10−4, 10−3 and 10−2 M. All other parameters are set to the same values as in Miotello et al. (2014), including a cosmic ray ionization rate of 5×10⁻¹⁷s−1per H2, a stellar X-ray luminosity of 1030erg s−1, and an interstellar UV flux typical for the solar neighborhood (Habing, 1968).
The stellar spectra considered in our models consist of a blackbody spectrum of a given temperature and luminosity: 4000 K and 1Lfor a T Tauri star and 10 000 K and 10Lfor a Herbig Ae/Be star (the same as in Miotello et al., 2014). The T Tauri spectra include an optional UV excess due to accretion. For a given accretion rate ˙M, we convert all gravitational poten-tial energy into 10 000 K blackbody radiation emitted uniformly over the stellar surface. The accretion luminosity is
Lacc=GM∗ ˙ M
R∗ . (1)
The median accretion rate for T Tauri stars of 1 Myr old is 10−8 Myr−1 (Hartmann et al., 1998). SettingM∗ =1 MandR∗ = 1.5R, the accretion luminosity is 0.23Lintegrated across all possible wavelengths or 0.018Lin the far-UV range from 6 to 13.6 eV.
10−1 100 101 102 103
λ(µm) 1012
1013 1014 1015 1016 1017 1018 1019 1020
Lν
(er
g
s
−
1Hz
−
1)
T Tauri (no excess) T Tauri (10−10M
yr−1excess) T Tauri (10−9M
yr−1excess) T Tauri (10−8M
yr−1excess)
Herbig Ae/Be
Fig. 1.Stellar spectra used in our model. The gray band marks the wavelength range of 912 to 1000 Å for the photodissociation of N2.
between 912 and 1000 Å, the wavelength range critical for the photodissociation and self-shielding of N2(Li et al., 2013; Heays et al., 2014). Table 2 lists the luminosities integrated over various wavelength ranges.
2.2. Chemical network
2.2.1. Reduced network for C/N/O chemistry
For their exploration of the CO isotopolog chemistry, Miotello et al. (2014) extended the reaction network of Bruderer et al. (2012) to include 13C, 17O and 18O. The Bruderer et al. net-work itself is a reduced version of the UMIST Database for Astrochemistry (UDfA; Woodall et al., 2007; McElroy et al., 2013), optimized to yield accurate abundances for CO and re-lated species with a minimum of computational effort. However, it lacks several species and reactions crucial to the chemistry of HCN, HNC and CN (see review by Loison et al., 2014).
Our model combines the reaction networks of Bruderer et al. (2012) and Loison et al. (2014) into a new reduced network for the C/N/O chemistry throughout a protoplanetary disk. Cross-checks against the full UMIST database at a dozen sets of physical conditions (representative of different physical regimes within the disk) confirmed that our network contains all reac-tions that affect the abundances of HCN, HNC and CN by more than a few per cent. Any effects smaller than this margin are lost in the overall model uncertainties.
The network contains both gas-phase and grain-surface pro-cesses, as described in Appendix A.3.1 of Bruderer et al. (2012). The gas-phase part consists of standard neutral-neutral and ion-molecule chemistry; reactions with vibrationally excited H2; charge exchange and H transfer with polycyclic aromatic hydro-carbons; photodissociation and photoionization; and reactions induced by X-rays and cosmic rays. All neutral molecules can freeze out, and desorption back into the gas phase can occur ther-mally or non-therther-mally via UV photons and cosmic rays. Grain-surface chemistry is limited to H2formation, hydrogenation of CN to HCN, and step-wise hydrogenation of atomic C, N and O to CH4, NH3and H2O (Bruderer et al., 2012). We adopt des-orption energies from the Kinetic Database for Astrochemistry (KIDA; Wakelam et al., 2012), including 1600 K for CN, 2050 K for HCN and HNC, and 5500 K for NH3.
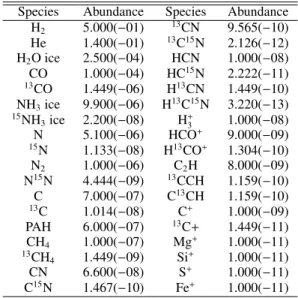
Table 3.Initial abundances relative to the total number of hydro-gen atoms.
Species Abundance Species Abundance H2 5.000(−01) 13CN 9.565(−10) He 1.400(−01) 13C15N 2.126(−12) H2O ice 2.500(−04) HCN 1.000(−08) CO 1.000(−04) HC15N 2.222(−11) 13CO 1.449(−06) H13CN 1.449(−10) NH3ice 9.900(−06) H13C15N 3.220(−13) 15NH
3ice 2.200(−08) H+3 1.000(−08) N 5.100(−06) HCO+ 9.000(−09) 15N 1.133(−08) H13CO+ 1.304(−10)
N2 1.000(−06) C2H 8.000(−09) N15N 4.444(−09) 13CCH 1.159(−10) C 7.000(−07) C13CH 1.159(−10) 13C 1.014(−08) C+ 1.000(−09)
PAH 6.000(−07) 13C+ 1.449(−11) CH4 1.000(−07) Mg+ 1.000(−11) 13CH4 1.449(−09) Si+ 1.000(−11)
CN 6.600(−08) S+ 1.000(−11) C15N 1.467(−10) Fe+ 1.000(−11)
The interaction of cosmic rays or X-rays with H2generates a local UV field even in parts of the disk that are shielded from stellar and interstellar UV radiation. The UDfA rate equation for the CR– and X-ray–induced photodissociation of CO is a fit to a set of tabulated values from Gredel et al. (1987). These authors reported faster rates for higher temperatures, but the new calcu-lations from Heays et al. (2014) show no dependence on temper-ature. The 1987 calculations appear not to have accounted for H2 shielding, or at least not for the effect of the gas temperature on the H2shielding.
The temperature-independent rate coefficientkfor this pro-cess can be expressed as the product of the total ionization rate
ζ(sum of cosmic ray and X-ray contributions) and the photodis-sociation efficiencyP. To account for self-shielding, we fit a sig-moid function to the tabulated values of Heays et al. and some additional values for typical interstellar grain properties:
P= 56.14
1+51100 [x(CO)]0.792 +4.3, (2)
wherex(CO)≡n(CO)/ngasis the CO abundance relative to the total number density of gas. The photodissociation efficiency varies smoothly from 5 at a CO abundance of a few 10−4 to 60 at abundances below 10−8. Grain growth can increasePby up to a factor of 2 (Heays et al., 2014).
Our network includes vibrationally excited H2in a two-level approximation, where H∗
2 denotes a pseudo-level with an en-ergy of 30 163 K (London, 1978). This enen-ergy can be used to overcome activation barriers as detailed in Appendix A.3.1 of Bruderer et al. (2012). An important example for the cyanide chemistry is the reaction between N and H2, whose barrier of 12 650 K (Davidson & Hanson, 1990) would otherwise be insur-mountable in the bulk of the disk. In our model, FUV pumping of H2to H∗
2in the disk’s surface layers enables the reaction with N, and the product NH enters directly into the cyanide chem-istry by reacting with C or C+to form CN or CN+ (Appendix
C). Appendix A describes the treatment of H∗
2.2.2. Addition of15N and13C
Observationally, the14N/15N ratio is often obtained from the op-tically thin emission of H13CN and HC15N. Analyzing the nitro-gen isotope chemistry therefore requires the addition of both15N and13C to the network. The oxygen isotopes are not necessary. We extended the reduced C/N/O network according to standard procedure (e.g., Le Bourlot et al., 1993; R¨ollig & Ossenkopf, 2013). This involves single substitutions of either14N by15N or 12C by13C, or substitution of both14N and12C, but not double substitutions of the same atom. For example, N2H+expands into 14N2H+,14N15NH+and15N14NH+. Our species of primary
inter-est, HCN, becomes H12C14N, H12C15N, H13C14N and H13C15N. Table B.1 in Appendix B lists the full set of species in the net-work.
The reactions from the C/N/O network are expanded to in-clude all possible isotope substitutions, under the condition that functional groups are preserved (Woods & Willacy, 2009). For example, the proton-transfer reaction HC15N+N2H+can only
produce HC15NH+ +N2, not HCNH++N15N. If the reaction mechanism is unknown, then we follow the guidelines from R¨ollig & Ossenkopf (2013): minimize the number of bonds bro-ken and formed; favor transfer of H or H+over heavier atoms;
and favor destruction of the weaker of two possible bonds. In the absence of experimental data, the rate constants for all iso-topolog reactions are set to be the same as for the original reac-tion. In cases where multiple product channels are allowed, all channels are assigned an equal probability (R¨ollig & Ossenkopf, 2013).
2.2.3. Isotope-exchange reactions
At temperatures below∼20 K, isotope-exchange reactions tend to enhance the abundances of heavier isotopologs over their lighter counterparts. The most common astrophysical example is the exothermic reaction between13C+and CO to form C+and
13CO (Watson et al., 1976). Its forward rate at low temperatures is faster than that of the return reaction, leading to carbon isotope fractionation in CO. Similar reactions can affect the14N/15N ra-tio in HCN and other species.
Roueff et al. (2015) reviewed a set of 19 possible carbon and nitrogen isotope-exchange reactions, of which eleven were deemed to be viable in astrophysical environments: numbers 1, 2, 3, 4, 5, 12, 14, 15, 16, 17 and 19 in their Table 1. Our chemical network includes these eleven reactions, with the rates and bar-riers provided by Roueffet al. Although these rates appear to be the best currently available, they may have been underestimated for some reactions (Wirstr¨om & Charnley, 2018).
2.2.4. Isotope-selective photodissociation
Another mechanism to alter isotopolog ratios is isotope-selective photodissocation. CO and N2 can dissociate only through ab-sorption into a discrete set of narrow far-UV lines (Visser et al., 2009; Li et al., 2013). These lines become saturated for CO and N2column densities of&1014cm−2, at which point self-shielding sets in: molecules deep inside a disk or cloud are shielded from dissociating radiation by molecules near the surface.
The rarer isotopologs13CO and N15N absorb photons at dif-ferent frequencies than the primary species, and these photons are less strongly shielded. At any depth into a disk or cloud, 13CO and N15N therefore dissociate faster than12CO and14N2. Through additional reactions, this affects the 14N/15N ratio in the cyanides (Sect. 3.3.1). Our network includes the CO and N2
shielding functions from Visser et al. (2009) and Heays et al. (2014).1From the available excitation temperatures and Doppler widths, the best choices are 20 K and 0.30 km s−1 for CO and 30 K and 0.13 km s−1for N2. These data files include the effects of shielding by H and H2, though our models show that mutual shielding is not important for nitrogen isotope fractionation in disks.
For a given point in the disk, DALI computes the shielding functions both radially towards the star and vertically towards the disk surface. The photodissociation rate is set by the direc-tion that provides the smaller amount of shielding. The same 1+1D approximation was used by Miotello et al. (2014).
3. Results
We present the key characteristics of the nitrogen isotope chem-istry for a fiducial disk model of 10−3Mwith 90% large grains and a scale height angle exponent ofψ =0.2. The disk is illu-minated by a T Tauri stellar spectrum with a UV excess for an accretion rate of 10−8Myr−1, providing an FUV luminosity of 0.018L between 6 and 13.6 eV. The elemental isotope ratios are 440 for14N/15N and 69 for12C/13C. Section 4.2 discusses how the chemistry depends on various model parameters.
3.1. Physical characteristics
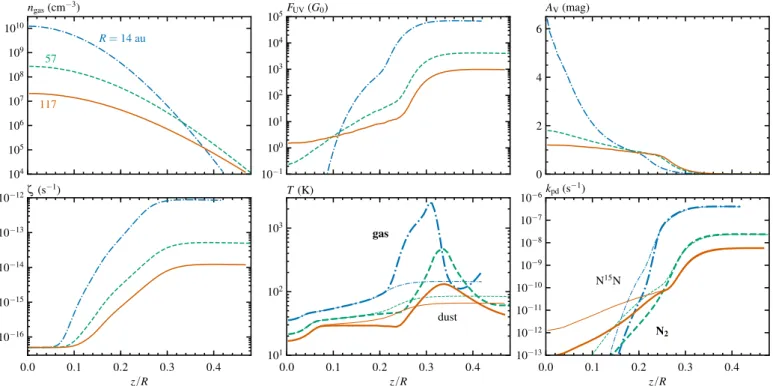
Figure 2 shows the two-dimensional profiles of the gas density, UV flux, visual extinction, ionization rate, dust temperature and gas temperature. Vertical cuts are plotted in Fig. 3 for three radii, corresponding to the abundance maximum of HCN in the surface layers (R=14 au), the abundance maximum of CN (57 au) and the strongest N isotope fractionation in HCN (117 au).
The UV flux in both figures is plotted in units of the mean interstellar radiation field (G0; Habing, 1968) and includes ef-fects of geometrical dilution and dust attenuation, as computed through the full 2D continuum radiative transfer. Due to scat-tered stellar light, the midplane UV flux reaches the equivalent of the interstellar field (G0 = 1) at a radius of 95 au. The ex-tinction profile is the result of comparing the actual intensity at each point in the disk to the intensity expected based only on geometrical dilution of the stellar radiation (Visser et al., 2011). Ionization is controlled by X-rays out to 0.3 au along the midplane, after which the X-ray ionization rate drops below the cosmic ray contribution of 5×10⁻¹⁷s−1. The midplane dust tem-perature decreases to 100 K at 1 au and 20 K at 70 au, marking the approximate locations of the H2O and CO snowlines.
The bottom right panel of Fig. 3 shows the photodissocia-tion rates of N15N (thinner lines) and N2 (thicker lines). Self-shielding of N2is important belowz/R≈0.25 (whereAV≈0.5) and results in an order-of-magnitude reduction in the photodis-sociation rate relative to N15N. The overall decrease of the pho-todissociation rates from the disk surface down to the midplane is due to extinction by dust. Shielding of N2and N15N by H or H2is negligible.
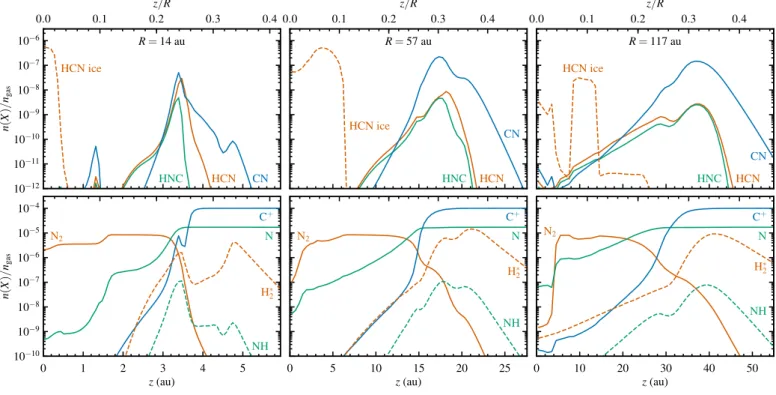
3.2. Cyanide abundances and morphologies
The abundance profiles for N2, N, HCN, HCN ice, HNC and CN at 1 Myr in the fiducial model are plotted in Fig. 4 and the cor-responding vertical cuts appear in Fig. 5. Across the entire disk, the dominant forms of nitrogen are N2(47%), NH3ice (30%), N (8%), N2ice (7%) and NO ice (6%). HCN ice accounts for 1%
0.0 0.1 0.2 0.3 0.4 0.5
z
/
R
ngas(cm−3) FUV(G0) AV(mag)
0.1 1 10 100
R(au)
0.0 0.1 0.2 0.3 0.4 0.5
z
/
R
ζ(s−1)
0.1 1 10 100
R(au)
Tdust(K)
0.1 1 10 100
R(au)
Tgas(K)
104 106 108 1010 1012
10−17 10−15 10−13 10−11 10−9 10−7
10−4 10−2 100 102 104
10 20 50 100 200 500
0 1 2 3 4 5
10 30 100 300 1000 3000
Fig. 2.Gas density, UV flux, visual extinction, ionization rate (sum of X-ray and cosmic ray contributions), dust temperature and gas temperature for a 10−3 Mdisk with 90% large grains,χ =0.2 andψ =0.2, illuminated by a T Tauri stellar spectrum with a UV excess for 10−8Myr−1. TheF
UVplot accounts for extinction. All panels are truncated at the 104cm−3density contour.
104 105 106 107 108 109 1010
ngas(cm−3)
R=14 au 57
117
10−1 100 101 102 103 104 105FUV(G0)
0 2 4 6
AV(mag)
0.0 0.1 0.2 0.3 0.4
z/R
10−16 10−15 10−14 10−13 10−12ζ(s−1)
0.0 0.1 0.2 0.3 0.4
z/R
101 102 103
T(K)
dust gas
0.0 0.1 0.2 0.3 0.4
z/R
10−13 10−12 10−11 10−10 10−9 10−8 10−7 10−6kpd(s−1)
N15N
N2
Fig. 3.Vertical cuts corresponding to Fig. 2. The bottom center panel shows the dust temperatures as thinner lines and gas temper-atures as thicker lines. The bottom right panel shows the photodissociation rate of N15N as thinner lines and that of N2as thicker lines.
of all nitrogen and gas-phase HCN for only 0.08%. At the in-ner edge, however, HCN is the second-most abundant N-bearing species (30% forR<0.2 au).
The cyanide morphologies from Fig. 4 are qualitatively sim-ilar to those seen in other models (e.g., Aikawa et al., 2002; Markwick et al., 2002; Jonkheid et al., 2007; Ag´undez et al., 2008; Woods & Willacy, 2009; Walsh et al., 2010; Fogel et al.,
0.0 0.1 0.2 0.3 0.4 0.5
z
/
R
N2 HCN HNC
0.1 1 10 100
R(au)
0.0 0.1 0.2 0.3 0.4 0.5
z
/
R
N
0.1 1 10 100
R(au)
HCN ice
0.1 1 10 100
R(au)
CN
10−12 10−11 10−10 10−9 10−8 10−7 10−6 10−5 10−4
Fig. 4.Abundances at 1 Myr of several N-bearing molecules for the same model as in Fig. 2. Values are relative tongas≈2n(H2)+ n(H). Contours are drawn at intervals of a factor of 10 from 10−11up to 10−5.
10−12 10−11 10−10 10−9 10−8 10−7 10−6
n
(
X
)
/
ngas
R=14 au
HCN
HNC CN
HCN ice
R=57 au
HCN HNC
CN HCN ice
R=117 au
HCN HNC
CN HCN ice
0 1 2 3 4 5
z(au)
10−10 10−9 10−8 10−7 10−6 10−5 10−4
n
(
X
)
/
ngas
N2 N
C+
H∗
2
NH
0 5 10 15 20 25
z(au)
N2 N
C+
H∗
2
NH
0 10 20 30 40 50
z(au)
N2 N
C+
H∗
2
NH 0.0 0.1 0.2 0.3 0.4
z/R
0.0 0.1 0.2 0.3 0.4
z/R
0.0 0.1 0.2 0.3 0.4
z/R
Fig. 5.Vertical cuts corresponding to Fig. 4.
2011; Graninger et al., 2015; Guzm´an et al., 2015, 2017; Teague et al., 2016; Hily-Blant et al., 2017; van Terwisga et al., subm.). Aside from the high-abundance inner region, HCN shows a secondary maximum of 3×10⁻⁸ in a thin layer along the disk surface. Near the midplane, HCN is absent fromR=0.4 to 130 au. HCN ice is abundant (up to 1×10⁻⁶) outside 8 au. HNC follows the same pattern as HCN, but the HNC abundance is systematically lower by about an order of magnitude. For com-parison, observations of one T Tauri disk and one Herbig disk
Appendix C offers a complete breakdown of the various re-actions that govern the formation and destruction of HCN, HNC and CN. The remainder of the current section describes the key physical and chemical aspects of the cyanide morphologies from Figs. 4 and 5.
Inner Disk– HCN is abundant in the inner 0.2 au, fueled by the combination of high temperatures (up to 1300 K) and high ionization rates (up to a few 10−11 s−1; Fig. 2). HCN is formed through all possible pathways starting from NH3, N and N2 (Reactions C.1–C.13). The conversion rate of HNC+H→ HCN+H (Reaction C.20) decreases with temperature, so the HNC abundance increases from the inner rim to 0.2 au. The CN abundance is low in this region, because CN+H2→HCN+H (Reaction C.18) drives all CN to HCN.
Midplane– The midplane temperature drops below 230 K at 0.2 au, disabling the gas-phase formation of water through O+
H2→OH and OH+H2→H2O. Outside 0.2 au, the abundance of atomic O is high enough to drain the entire cyanide reservoir on a timescale of a few thousand years through CN+O→CO
+N (Reaction C.23). The snowlines of HCN and HNC lie at 8 au and that of CN at 16 au. At larger radii, any cyanides formed in the gas freeze onto the dust and are safe from destruction by atomic O. Gas-phase cyanides remain absent along the midplane until 130 au, at which point UV-driven chemistry takes over.
Surface – Photodissociation and photoionization rule the surface layers of the disk. The UV field dissociates N2and CO, and it pumps H2 into a vibrationally excited state. This H∗2 re-acts with N to NH, which rere-acts further with C or C+to produce
HCN, HNC and CN (Reactions C.3–C.5). Most of the surface is warm enough to overcome the barrier of 960 K on CN+H2 → HCN+H (Reaction C.18), so formation of HCN from CN and H2 is faster than photodissociation of HCN to CN and H. The two dominant cyanide loss channels are photodissociation of CN and the reaction of CN with O.
Outer Disk– Photodissociation and photoionization remain important at intermediate altitudes and in the outer disk, but the UV flux is lower and the gas is colder than in the surface lay-ers. The lower abundance of H∗
2slows down production of CN from N and NH (Reactions C.3–C.5). Production of HCN slows down even more because of the barrier on CN+H2→HCN+ H (Reaction C.18).
To highlight the importance of vibrationally excited H2 for the cyanide abundances, consider the vertical cuts in Fig. 5. At each radius, CN, HCN, HNC all peak in a narrow band of al-titudes near z/R of 0.2 to 0.3. When the abundances are high enough, a shoulder or secondary peak appears at z/R of 0.3 to 0.4. NH and H∗
2 have the same dual-peaked profiles as the cyanides. In contrast, the abundances of N and C+follow an
en-tirely different pattern.
Based on the similar vertical abundance profiles, the chem-istry of H∗
2, NH and the cyanides is closely linked. This conclu-sion is also evident when plotting the abundances as a function of radius at constant zor z/Rthrough the CN maximum (not shown). The abundance profile of H∗
2 represents a balance be-tween excitation due to UV pumping and deexcitation due to spontaneous decay and collisions with ground-state H or H2. At altitudes above the CN maximum, photodissociation of H2 pro-vides an additional loss channel for H∗
2.
3.3. Isotope ratios
3.3.1.14N/15N
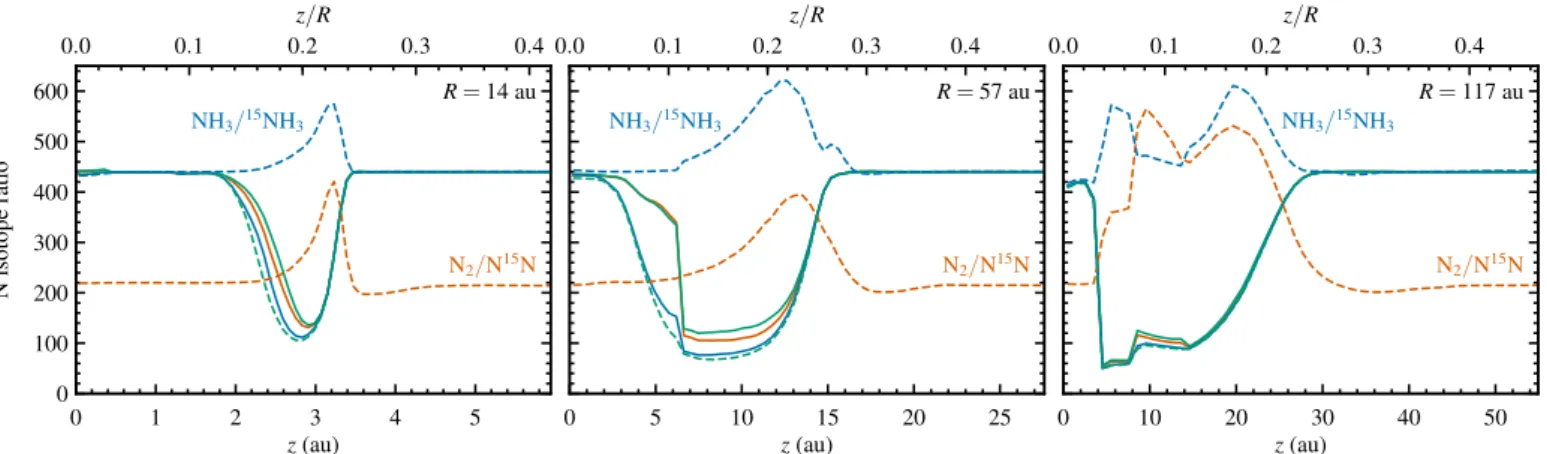
Figure 6 shows the nitrogen isotope ratios for N2, N, HCN, HNC, CN and NH3in the fiducial disk model. Vertical cuts at 14, 57 and 117 au appear in Fig. 7. All six species undergo isotope frac-tionation in a region extending from near the disk surface down to the midplane at 100–200 au.
Molecular nitrogen is depleted in 15N, reaching a peak N2/N15N ratio of 750 at a radius of 150 au. This value is 3.4 times higher than the primordial N2/N15N ratio ratio of 220. Fractionation in N2is fully driven by isotope-selective photodis-sociation, which lowers the photodissociation rate of N2 by an order of magnitude compared to N15N (Fig. 3, bottom right). The relative importance of isotope-selective photodissociation and low-temperature isotope exchange reactions is discussed in more detail in Sect. 4.1.
The isotope-selective photodissociation of N2leads to strong fractionation in atomic N in the bottom left panel of Fig. 6. The N/15N ratio reaches a minimum of 48 at R = 82 au, 9.2 times lower than the initial ratio of 440. Formation of CN, HCN and HNC generally begins with atomic N (Appendix C), so the level of fractionation in the three cyanides closely follows that of N/15N (Fig. 7).
Lastly, ammonia shows both15N enhancement and deple-tion. The enhancement is strongest at the midplane around 170 au, with an NH3/15NH3 ratio down to 94. Depletion of15N is seen in a layer fromz/R=0.10 at the inner edge toz/R=0.22 at 40 au and curving down toz/R=0.06 near 150 au. The high-est NH3/15NH3ratio in the model is 800, corresponding to15N depletion by a factor of 1.8.
The dual behavior of the NH3/15NH3 ratio is due to diff er-ent sources of the nitrogen atom in ammonia. Throughout the disk, NH3 is formed by successive hydrogenation of NH+ and dissociative recombination of the resulting NH+
4. The difference lies in the origin of NH+. In the region of reduced NH3/15NH3 (i.e.,15N enhancement), the primary formation pathway of NH+
is photoionization of NH. In turn, NH arises from atomic N and vibrationally excited H2via N+H∗
2→NH+H (Reaction C.3). Hence, the isotope fractionation in NH3 follows that of atomic N. In the other region, where ammonia is depleted in15N, NH+
is formed in two steps: N2reacts with He+to N and N+, and the latter reacts with H2 to NH+. Since NH3 is ultimately formed
from N2in these two regions, the NH3/15NH3ratio follows the N2/N15N ratio.
3.3.2.12C/13C
The low-Jrotational lines of HCN are optically thick in most cir-cumstellar disks. The14N/15N ratio is therefore usually derived from H13CN and HC15N, assuming a12C/13C ratio of 70 (Hily-Blant et al., 2013; Wampfler et al., 2014; Guzm´an et al., 2015, 2017). Our model includes13C in order to test if the assumption of a constant HCN/H13CN ratio is correct.
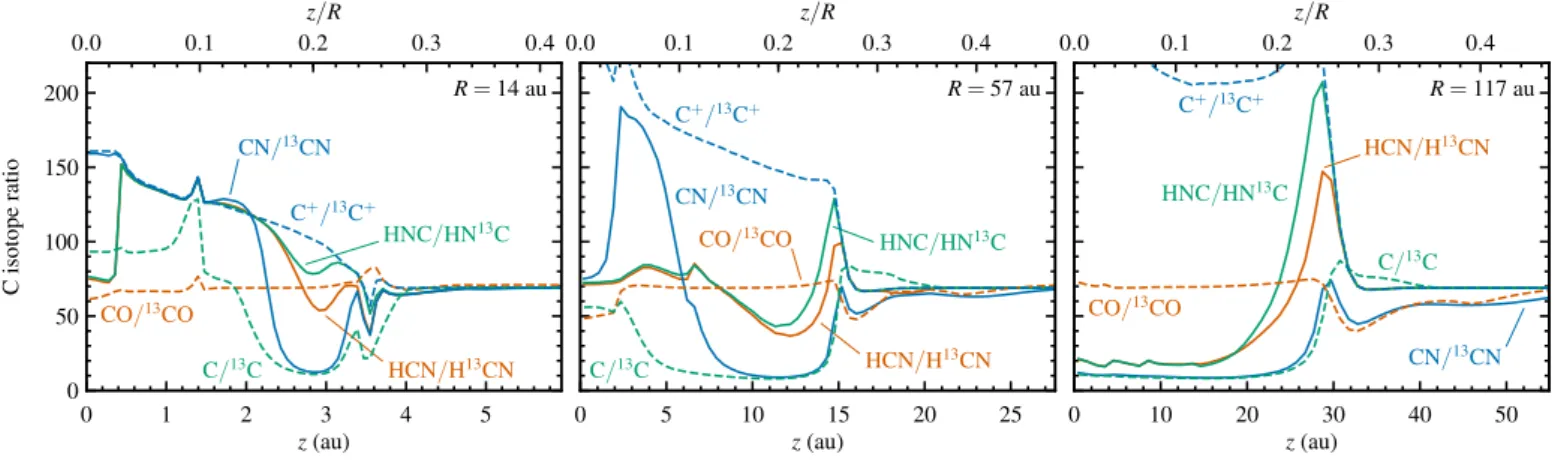
Figure 8 shows the carbon isotope ratios for CO, C, C+,
0.0 0.1 0.2 0.3 0.4 0.5
z
/
R
N2/N15N HCN
/HC15N HNC/H15NC
0.1 1 10 100
R(au)
0.0 0.1 0.2 0.3 0.4 0.5
z
/
R
N/15N
0.1 1 10 100
R(au)
NH3/15NH3
0.1 1 10 100
R(au)
CN/C15N
0 100 200 300 400 500 600
Fig. 6.Nitrogen isotope ratios of several molecules at 1 Myr for the same model as in Fig. 2. The elemental14N/15N ratio is 440. Contours are drawn at ratios of 100, 200, 300, 400 and 500.
0 1 2 3 4 5
z(au)
0 100 200 300 400 500 600
N
isotope
ratio
R=14 au
N2/N15N NH3/15NH3
0 5 10 15 20 25
z(au)
R=57 au
N2/N15N NH3/15NH3
0 10 20 30 40 50
z(au)
R=117 au
N2/N15N NH3/15NH3
0.0 0.1 0.2 0.3 0.4
z/R
0.0 0.1 0.2 0.3 0.4
z/R
0.0 0.1 0.2 0.3 0.4
z/R
Fig. 7.Vertical cuts corresponding to Fig. 6. The profiles for N2/N15N and NH3/15NH3are labeled. From top to bottom, the remaining profiles are for HNC/H15NC (solid green), HCN/HC15N (solid orange), CN/C15N (solid blue) and N/15N (dashed green).
Carbon fractionation is largely controlled by CO, the most abundant carbon species. At the outer edge of the disk, the column density of CO is insufficient to provide self-shielding against the interstellar radiation field or the scattered stellar UV light. Because the gas is cold (<30 K), the isotope exchange re-action13C+ + CO C+ + 13CO + 35 K is faster in the forward direction than backwards. This leads to an enhancement in13CO, visible as CO/13CO ratios down to 12 in the top left panel of Fig. 8.
Moving in from the outer edge,12CO becomes self-shielded once it builds up a column density of∼1014cm−2. From here on in,13CO photodissociates faster than12CO. The gas temperature increases at the same time (from∼20 to∼30 K), reducing the effect of the low-temperature exchange process. The net result is an extended region with a minor increase in the CO/13CO ratio of up to 80 and a smaller spot near the midplane at 220 au with CO/13CO up to 170. The region of modest13CO depletion runs fromz/R=0.04 atR=220 au up and in toz/R=0.26 at 100
au, and continues all along the disk surface toz/R =0.1 at the inner edge.
The fractionation pattern for atomic C is opposite to that of CO, not only spatially, but also in magnitude. The region of strong13CO enhancement at the outer edge corresponds to mod-erate depletion (up to 40%) in atomic13C, while the extended region of modest13CO depletion shows strong enhancement of 13C (up to a factor of 9). In all cases, photodissociation of CO and13CO is the major source of C and13C. The outer edge of the disk is where C and C+take over from CO as the dominant
carbon carriers, so even a large change in the CO/13CO ratio has little effect on the isotope ratio of the much more abundant atomic species. The reverse effect is seen away from the outer edge, where most carbon is locked up in CO: a small change in the photodissociation rates of CO and13CO gets amplified into a large difference in the C/13C abundance ratio.
frac-0.0 0.1 0.2 0.3 0.4 0.5
z
/
R
CO/13CO HCN/H13CN HNC/HN13C
0.1 1 10 100
R(au)
0.0 0.1 0.2 0.3 0.4 0.5
z
/
R
C/13C
0.1 1 10 100
R(au)
C+/13C+
0.1 1 10 100
R(au)
CN/13CN
0 50 100 150 200
Fig. 8.Carbon isotope ratios of several molecules at 1 Myr for the same model as in Fig. 2. The elemental 12C/13C ratio is 69. Contours are drawn at ratios of 50, 100 and 150.
0 1 2 3 4 5
z(au)
0 50 100 150 200
C
isotope
ratio
R=14 au
HCN/H13CN HNC/HN13C CN/13CN
CO/13CO
C/13C
C+/13C+
0 5 10 15 20 25
z(au)
R=57 au
HCN/H13CN HNC/HN13C CN/13CN
CO/13CO
C/13C
C+/13C+
0 10 20 30 40 50
z(au)
R=117 au
HCN/H13CN HNC/HN13C
CN/13CN CO/13CO
C/13C C+/13C+
0.0 0.1 0.2 0.3 0.4
z/R
0.0 0.1 0.2 0.3 0.4
z/R
0.0 0.1 0.2 0.3 0.4
z/R
Fig. 9.Vertical cuts corresponding to Fig. 8.
tionation of CO. The bulk of the disk has an elevated C+/13C+
ra-tio (up to 920) and that rara-tio generally increases with decreasing gas temperature. The responsible mechanism is the aforemen-tioned reaction of13C+with CO. Even though13C+is formed
from a reservoir of enhanced13C, the exchange with CO has a larger effect and causes strong depletion of13C+. However, there
is one region with13C+enhancement: a thin layer along the disk
surface, fromR=0.1 to 10 au. This is at the CO/C/C+transition,
where the gas temperatures of a few 100 K are too high for the low-temperature exchange mechanism to still be active. Instead, the13C/13C+ratio is set by the isotope-selective
photodissocia-tion of CO.
At the outer edge of the disk (R > 200 au), CN is closely linked to and follows the fractionation of CO. Photodissociation and ionization convert CO to C+, which rapidly reacts with
NH. The product CN+ then undergoes charge exchange with
H to form CN. The CO–CN loop is closed by the reaction be-tween CN and O to form CO and N. HCN and HNC are about four orders of magnitude less abundant than CN and are not
closely linked to it. Instead, HCN and HNC are mostly formed by the dissociative recombination of HCNH+, which in turn
arises from C+ reacting with NH3. The ratios of HCN/H13CN and HNC/H13NC in this part of the disk follow C+/13C+, i.e.,
no fractionation at the very outer edge and13C depletion around R=200–300 au.
Moving in to around 100 au, all three cyanide species show 13C enhancements of up to a factor of 6. Due to the lower abun-dance of C+, formation of CN is now dominated by the
reac-tion of C with NH or NO. Neutral-neutral chemistry also con-trols the abundance HCN, in particular through the reaction of CH with NO. Charge exchange reactions through the intermedi-ate HCNH+allow both CN and HCN to be converted to HNC.
CH is formed from C and H∗
2, so the carbon fractionation in all three cyanides follows the fractionation of atomic C. The same coupling between C and the cyanides is also seen in the surface layers.
0 50 100 150 200 250 300 350 400
R(au)
0 50 100 150 200 250
N
(XCN)/
N
(X
13CN)
HCN/H13CN
HNC/HN13C
CN/13CN
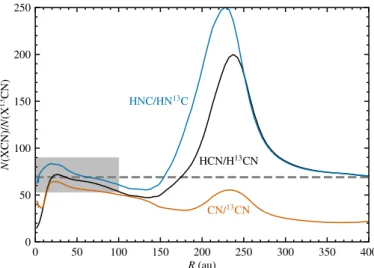
Fig. 10. Column density ratios of12C/13C in HCN, HNC and CN at 1 Myr as a function of radius in the fiducial disk model. The dashed gray line marks the elemental12C/13C ratio of 69. The shaded region indicates the 30% uncertainty assumed by Guzm´an et al. (2017), whose observations probed material out to 100 au.
ofN(HCN) overN(H13CN) as a function of radius, ranging from a global minimum of 15 at 1 au and a local minimum of 47 at 130 au to a maximum of 200 at 240 au. The observations of Guzm´an et al. (2017) probed H13CN and HC15N out to radii of 100 au with a beam size of about 60 au. Under these conditions, Fig. 10 essentially shows a constant12C/13C ratio in HCN. The variations in the inner 100 au are smaller than the uncertainty of 30% assumed by Guzm´an et al. to convert H13CN column densities to HCN column densities. If future observations probe gas out to larger radii, the assumption of a constant12C/13C ratio will need to be reevaluated.
4. Discussion
4.1. Dominant isotope fractionation mechanism and comparison with observations
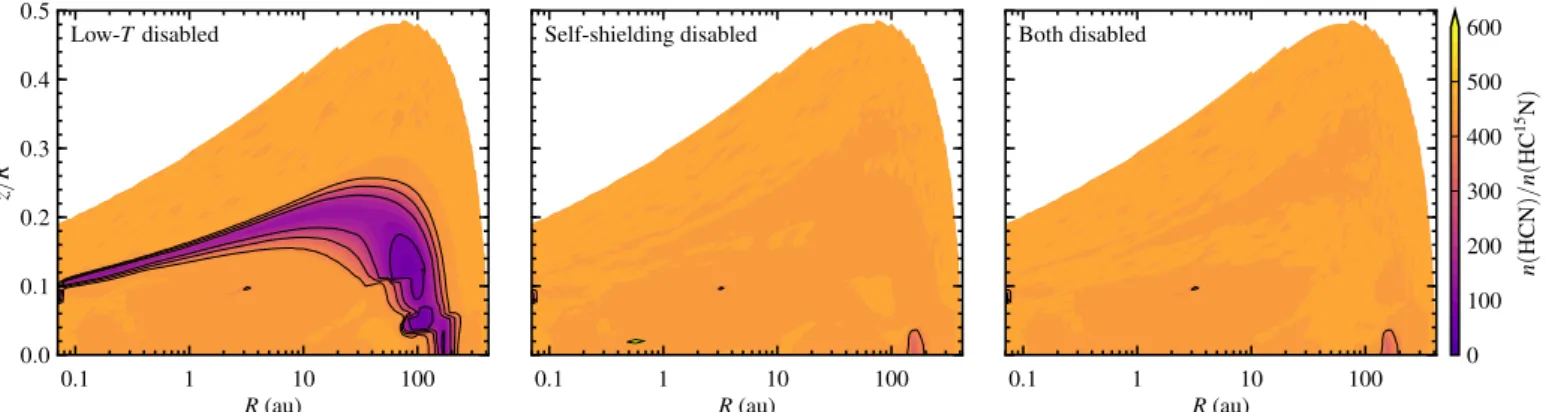
We reran the fiducial model with either the low-temperature iso-tope exchange reactions turned offor with the self-shielding of N2turned off, and once more with both mechanisms turned off. The left and center panels of Fig. 11 show the effects of en-abling only one fractionation mechanisms at a time. Starting from the original ratios, with both mechanisms switched on (Fig. 6, top center), the ratios do not change when the low-temperature exchange reactions are disabled (Fig. 11, left). The ratios do change substantially when self-shielding is turned off(Fig. 11, middle), indicating that self-shielding of N2is the dominant frac-tionation mechanism in our models.
Another way to demonstrate the importance of self-shielding over low-T fractionation is to plot column density ratios (Fig. 12). The curves for “both mechanisms off” and “self-shielding off, low-T on” fall on top of each other, as do the curves for “both on” and “self-shielding on, low-Toff”. Hence, the column density ratios are completely unaffected by whether or not the low-temperature pathways are active.
As noted by Wirstr¨om & Charnley (2018), the reaction rates for some of the low-T exchange reactions may have been un-derestimated by Roueffet al. (2015). Given that the bulk of the disk is warmer than 20 K, it appears that our conclusion
regard-ing the dominant fractionation mechanism is robust even against order-of-magnitude variations in the exchange rates.
The HCN/HC15N abundance and column density ratios at a chemical age of 1 Myr do not depend on the initial ratios. Our fiducial model starts withn(HCN)/n(HC15N)=440. We ran test models starting with ratios of 300 and 150, while keeping the el-emental 14N/15N ratio at 440. In the absence of self-shielding, both models end up with the upper column density ratio profiles from Fig. 12. With self-shielding turned on, the column den-sity ratios match the lower curves. Hence, inheritance alone is not sufficient to explain the isotopolog ratios observed in disks. Instead, the observations require active fractionation powered by self-shielding of N2.
With self-shielding active, the fiducial model produces abun-dance ratios from 55 to 440 for both HCN/HC15N and CN/C15N. Fractionation is strongest at radii from 50 to 200 au and altitudes from 40 au down to the midplane. No nitrogen isotope fraction-ation is seen at the midplane inside of 100 au, where comets and other solid bodies would be formed. Nonetheless, solar sys-tem comets show strong and uniform fractionation in both HCN and CN (average14N/15N ratios of 140–150; Jehin et al., 2009; Bockel´ee-Morvan et al., 2015; Hily-Blant et al., 2017). A com-bination of radial and vertical mixing can bring highly fraction-ated material into the comet-forming zone. Such mixing is also part of the theory of how isotope-selective photodissociation of CO resulted in the oxygen isotope ratios observed in meteorites (Lyons & Young, 2005).
The HCN/HC15N column density ratio in the fiducial model varies between 270 and 440 in the inner 250 au. The lowest val-ues appear between 100 and 200 au. The H13CN and HC15N observations of six disks by Guzm´an et al. (2017) probed gas at radii up to 100 au. The inferred HCN/HC15N ratios range from 83±32 to 156±71 and are shown in Fig. 12 as shaded gray regions. Ignoring the uncertainties, the average ratio from the observed sample is a factor of 2 lower than the lowest column densities in the model and a factor of 3 lower than the average model ratio inside 100 au. Including uncertainties, the models and observations agree to better than a factor of 2.
With model HCN/HC15N abundance ratios down to 55, the discrepancy in column density ratios is not due to insufficient levels of fractionation as such. Rather, the regions with strong fractionation do not coincide with the regions that contribute most to the column densities of HCN and HC15N. Various trial runs have shown that the HCN morphology is sensitive to the treatment of vibrationally excited H2. The current single-level approximation (Appendix A) may not be appropriate for the cyanide chemistry, and a more detailed multi-level approach could be considered in the future. Furthermore, a proper com-parison between observations and models requires full radia-tive transfer and excitation to compare actual line intensities. Guzm´an et al. (2017) assumed local thermodynamic equilib-rium, a single excitation temperature of 15 K and optically thin emission. These assumptions remain to be validated in future studies.
0.1 1 10 100
R(au)
0.0 0.1 0.2 0.3 0.4 0.5
z
/
R
Low-Tdisabled
0.1 1 10 100
R(au)
Self-shielding disabled
0.1 1 10 100
R(au)
Both disabled
n
(
HCN
)
/
n
(
HC
15N
)
0 100 200 300 400 500 600
Fig. 11.Abundance ratios of HCN over HC15N at 1 Myr in the fiducial disk model for three variations of the chemical network: with low-temperature isotope exchange reactions disabled (left), with self-shielding of N2 disabled (center), or with both fractionation mechanisms disabled (right). The ratios obtained with both mechanisms active are shown in the top center panel of Fig. 6. Contours are drawn at ratios of 100, 200, 300, 400 and 500.
0 50 100 150 200 250 300 350 400
R(au)
0 100 200 300 400 500
N
(HCN)/
N
(HC
15N) both on
self-shielding on, low-Toff
both off
self-shielding off, low-Ton
observations
Fig. 12.Column density ratio of HCN/HC15N at 1 Myr as a func-tion of radius in the fiducial disk model for four variafunc-tions of the chemical network: low-temperature exchange reactions on or offand self-shielding of N2 on or off. The dashed gray line marks the elemental 14N/15N ratio of 440. The dark and light gray shaded regions indicate the range of observed ratios and uncertainties from Guzm´an et al. (2017), probing material out to 100 au.
4.2. Effect of disk parameters
The results presented so far were for one particular disk model, with a gas mass of 10−3M, 90% large grains and a scale height angle exponent ofψ=0.2 (Sect. 2.1). The stellar radiation field was that of a 4000 K blackbody (representing a T Tauri star) with a UV excess for an accretion rate of 10−8 Myr−1. The current subsection discusses how changing these parameters affects the fractionation of the nitrogen isotopes. All models herein include self-shielding of N2and low-temperature isotope exchange reac-tions.
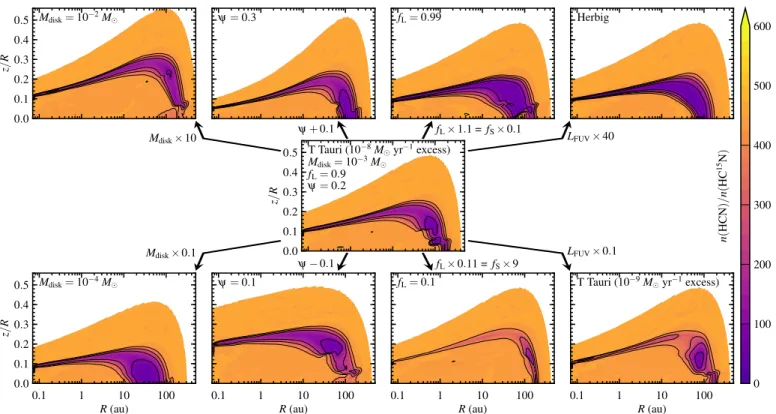
Figure 13 shows how the HCN/HC15N abundance ratios change when modifying one parameter at a time: disk mass, flar-ing angle, grain size distribution or stellar spectrum. Figure 14 shows the corresponding column density ratios. Despite obvious differences in both figures, the key point here is how little the column density ratios in the inner 100 au change across all model variations. The largest effect is seen when changing the grain
size distribution, but even then the model ratios change by less than 50%. The lack of variation in the model HCN/HC15N col-umn density ratios echoes the narrow range of values observed by Guzm´an et al. (2017) in a sample of six disks with different characteristics, although the observed ratios are about a factor of 2 lower than the model ratios.
Increasing the disk mass (while keeping all other parameters constant) leads to higher densities at every point in the disk, and thus also to larger optical depths. Both formation and fractiona-tion of HCN are governed by the UV field; the former through vibrational excitation of H2, the latter through self-shielding of N2. As excitation of H2moves up to higher altitudes, so does the layer with high cyanide abundances. Likewise, as N2 becomes self-shielded at greater z/R, the region of strong isotope frac-tionation also moves up. The net result is no significant change in the column density ratios of HCN/HC15N in the inner 100 au (Fig. 14, first panel).
Increasing the scale height angle exponent leads to a more strongly flared disk, where the outer parts intercept more stellar radiation than in a flatter disk. The layer with high HCN abun-dances and the layer with strong fractionation both move down in the inner disk and remain at the same altitude in the outer disk. The effects onN(HCN)/N(HC15N) in the inner 100 au are again small (Fig. 14, second panel).
Bigger changes in the column density ratios are seen when changing the grain size distribution, as already noted by Heays et al. (2014). Decreasing the fraction of large grains from 90% to 10% leads to an increase in grain surface area per unit gas density. Hence, for the same column density of gas, the UV flux is attenuated more strongly by the dust. This reduces the im-portance of self-shielding, resulting in lower levels of isotope fractionation (Fig. 13, bottom row, third panel). The model with fL=0.1 therefore has a higher HCN/HC15N column density ra-tio than the fiducial model with fL =0.9 (Fig. 14, third panel). Likewise, an increase in fLfrom 0.9 to 0.99 results in somewhat smaller column density ratios.
con-0.0 0.1 0.2 0.3 0.4 0.5
z
/
R
Mdisk=10−2M ψ=0.3 fL=0.99 Herbig
0.0 0.1
0.2 0.3 0.4 0.5
z
/
R
T Tauri (10−8M
yr−1excess)
Mdisk=10−3M
fL=0.9
ψ=0.2
0.1 1 10 100
R(au)
0.0 0.1 0.2 0.3 0.4 0.5
z
/
R
Mdisk=10−4M
0.1 1 10 100
R(au)
ψ=0.1
0.1 1 10 100
R(au)
fL=0.1
0.1 1 10 100
R(au)
T Tauri (10−9M
yr−1excess)
0 100 200 300 400 500 600
Mdisk×10 ψ+0.1 fL×1.1 =fS×0.1 LFUV×40
Mdisk×0.1
ψ−0.1 fL×0.11 =fS×9
LFUV×0.1
n
(
HCN
)
/
n
(
HC
15N
)
Fig. 13.Abundance ratios of HCN over HC15N at 1 Myr for several sets of model parameters. The central panel is for the fiducial model from Sect. 3 and is the same as the top center panel in Fig. 6. The other panels show the result of changing one parameter at a time, as indicated with the labels on the arrows and within the panels. Contours are drawn at ratios of 100, 200, 300, 400 and 500.
0 100 200 300
R(au)
0 100 200 300 400 500
N
(HCN)/
N
(HC
15N)
ψ=0.2,fL=0.9, TT:10−8
Mdisk=10−4M
10−3 10−2
obs.
0 100 200 300
R(au)
Mdisk=10−3M,fL=0.9, TT:10−8 ψ=0.1
0.2 0.3
obs.
0 100 200 300 400
R(au)
Mdisk=10−3M,ψ=0.2, TT:10−8
fL=0.1
0.9 0.99
obs.
0 100 200 300
R(au)
Mdisk=10−3M,ψ=0.2,fL=0.9
TT:10−9 TT:10−8 Herbig
obs.
Fig. 14.Column density ratios of HCN over HC15N at 1 Myr as a function of radius for a range of model parameters: disk mass (Mdisk), flaring angle power law (ψ), large grain fraction (fL) and stellar spectrum. The dashed gray line marks the elemental 14N/15N ratio of 440. The dark and light gray shaded regions indicate the range of observed HCN/HC15N ratios and uncertainties from Guzm´an et al. (2017), probing material out to 100 au. The abbreviation “TT:10−8” means a T Tauri stellar spectrum with a UV excess for an accretion rate of 10−8 Myr−1.
sistent with the similar ratios observed in T Tauri and Herbig stars by Guzm´an et al. (2017). The external radiation field has an equally small effect on the column density ratios, even when increased to 100 times the normal value for the solar neighbor-hood.
5. Conclusions
The formation of CN and HCN is powered by the endother-mic reaction between vibrationally excited H2and atomic N. H2 is excited primarily through UV pumping in the irradiated sur-face layers and outer parts of the disk. Hence, these are the re-gions where the cyanides are most abundant.
Nitrogen isotope fractionation is fully dominated by isotope-selective photodissociation of N2. The low-temperature exchange reactions do not contribute at all. The lowest HCN/HC15N abundance ratio in our fiducial model is 55, rep-resenting15N enhancement by a factor of 8 relative to the ele-mental14N/15N ratio of 440. The HCN/HC15N column density ratio shows a minimum of 270 and a mean of 340 in the inner 100 au. Taking uncertainties into account, these ratios are consis-tent with ALMA observations to within a factor of two (Guzm´an et al., 2017).
Because of optical depth issues, the14N/15N ratio in HCN is usually derived from observations of H13CN and HC15N. By also including 13C in our models, we tested to what extent the standard assumption of a constant HCN/H13CN ratio is justified. In the inner 100 au, probed by recent observations, the column density ratio of HCN to H13CN varies by less than 20% when averaged over typical beam sizes. The assumption of a constant HCN/H13CN ratio is currently justified, but needs to be reevalu-ated if future observations probe gas at larger radii.
The observable level of fractionation in HCN is largely in-sensitive to variations in the disk mass, the flaring angle or the stellar radiation field, but it does depend on the grain size dis-tribution. Larger grains have a smaller surface area per unit gas volume than do smaller grains. Grain growth therefore allows for more self-shielding of N2relative to extinction by dust and thus produces stronger levels of nitrogen isotope fractionation.
An important remaining challenge is to explain the discrep-ancy between the HCN/HC15N column density ratios in the models and those inferred from observations. Given the crucial role of vibrationally excited H2in the chemistry of HCN, HNC and CN, the current single-level approximation (Appendix A) may not be good enough. Future work could explore a more ac-curate multi-level treatment.
Acknowledgements. We thank the entire DALI team for fruitful discussions.
Astrochemistry in Leiden is supported by the European Union A-ERC grant 291141 CHEMPLAN, by the Netherlands Research School for Astronomy (NOVA) and by a Royal Netherlands Academy of Arts and Sciences (KNAW) professor prize. All figures in this paper were made with the Python package matplotlib(Hunter, 2007).
References
Ag´undez, M., Cernicharo, J., & Goicoechea, J. R. 2008, A&A, 483, 831 Ag´undez, M., Goicoechea, J. R., Cernicharo, J., Faure, A., & Roueff, E. 2010,
ApJ, 713, 662
Ahn, T., Adamovich, I., & Lempert, W. R. 2007, Chem. Phys., 335, 55 Aikawa, Y., van Zadelhoff, G. J., van Dishoeck, E. F., & Herbst, E. 2002, A&A,
386, 622
Andrews, S. M., Wilner, D. J., Espaillat, C., et al. 2011, ApJ, 732, 42
Baulch, D. L., Bowman, C. T., Cobos, C. J., et al. 2005, J. Phys. Chem. Ref. Data, 34, 757
Bockel´ee-Morvan, D., Calmonte, U., Charnley, S., et al. 2015, Space Sci. Rev., 197, 47
Bruderer, S. 2013, A&A, 559, A46
Bruderer, S., van der Marel, N., van Dishoeck, E. F., & van Kempen, T. A. 2014, A&A, 562, A26
Bruderer, S., van Dishoeck, E. F., Doty, S. D., & Herczeg, G. J. 2012, A&A, 541, A91
Busemann, H., Young, A. F., O’D. Alexander, C. M., et al. 2006, Science, 312, 727
Carr, J. S. & Najita, J. R. 2008, Science, 319, 1504
Cazzoletti, P., van Dishoeck, E. F., Visser, R., Facchini, S., & Bruderer, S. 2018, A&A, 609, A93
Ceccarelli, C., Caselli, P., Bockel´ee-Morvan, D., et al. 2014, Protostars and Planets VI, 859
Cleeves, L. I., Bergin, E. A., Bethell, T. J., et al. 2011, ApJ, 743, L2
Cleeves, L. I., Bergin, E. A., Qi, C., Adams, F. C., & ¨Oberg, K. I. 2015, ApJ, 799, 204
D’Alessio, P., Calvet, N., Hartmann, L., Franco-Hern´andez, R., & Serv´ın, H. 2006, ApJ, 638, 314
Davidson, D. F. & Hanson, R. K. 1990, Int. J. Chem. Kinet., 22, 843 Dutrey, A., Guilloteau, S., & Guelin, M. 1997, A&A, 317, L55 Fedele, D., Bruderer, S., van Dishoeck, E. F., et al. 2013, ApJ, 776, L3 Floss, C., Stadermann, F. J., Bradley, J. P., et al. 2006,
Geochim. Cosmochim. Acta, 70, 2371
Flower, D. R. & Roueff, E. 1998, J. Phys. B At. Mol. Opt., 31, 2935
Fogel, J. K. J., Bethell, T. J., Bergin, E. A., Calvet, N., & Semenov, D. 2011, ApJ, 726, 29
Fonseca dos Santos, S., Balakrishnan, N., Forrey, R. C., & Stancil, P. C. 2013, J. Chem. Phys., 138, 104302
F¨uri, E. & Marty, B. 2015, Nat. Geosci., 8, 515
Gibb, E. L., Van Brunt, K. A., Brittain, S. D., & Rettig, T. W. 2007, ApJ, 660, 1572
Graninger, D., ¨Oberg, K. I., Qi, C., & Kastner, J. 2015, ApJ, 807, L15 Gredel, R., Lepp, S., & Dalgarno, A. 1987, ApJ, 323, L137
Guzm´an, V. V., ¨Oberg, K. I., Huang, J., Loomis, R., & Qi, C. 2017, ApJ, 836, 30 Guzm´an, V. V., ¨Oberg, K. I., Loomis, R., & Qi, C. 2015, ApJ, 814, 53 Habing, H. J. 1968, Bull. Astron. Inst. Netherlands, 19, 421
Hartmann, L., Calvet, N., Gullbring, E., & D’Alessio, P. 1998, ApJ, 495, 385 Heays, A. N., Visser, R., Gredel, R., et al. 2014, A&A, 562, A61
Hily-Blant, P., Bonal, L., Faure, A., & Quirico, E. 2013, Icarus, 223, 582 Hily-Blant, P., Magalhaes, V., Kastner, J., et al. 2017, A&A, 603, L6 Hunter, J. D. 2007, Comput. Sci. Eng., 9, 90
Jehin, E., Manfroid, J., Hutsem´ekers, D., Arpigny, C., & Zucconi, J.-M. 2009, Earth Moon and Planets, 105, 167
Jonkheid, B., Dullemond, C. P., Hogerheijde, M. R., & van Dishoeck, E. F. 2007, A&A, 463, 203
Lahuis, F., van Dishoeck, E. F., Boogert, A. C. A., et al. 2006, ApJ, 636, L145 Le Bourlot, J., Pineau des Forˆets, G., & Flower, D. R. 1999, MNRAS, 305, 802 Le Bourlot, J., Pineau des Forˆets, G., Roueff, E., & Flower, D. R. 1993, A&A,
267, 233
Le Teuff, Y. H., Millar, T. J., & Markwick, A. J. 2000, A&AS, 146, 157 Li, X., Heays, A. N., Visser, R., et al. 2013, A&A, 555, A14
Liang, M.-C., Heays, A. N., Lewis, B. R., Gibson, S. T., & Yung, Y. L. 2007, ApJ, 664, L115
Lique, F. 2015, MNRAS, 453, 810
Loison, J.-C., Wakelam, V., & Hickson, K. M. 2014, MNRAS, 443, 398 London, R. 1978, ApJ, 225, 405
Lucas, R. & Liszt, H. 1998, A&A, 337, 246
Lyons, J. R., Bergin, E. A., Ciesla, F. J., et al. 2009, Geochim. Cosmochim. Acta, 73, 4998
Lyons, J. R. & Young, E. D. 2005, Nature, 435, 317
Mandell, A. M., Bast, J., van Dishoeck, E. F., et al. 2012, ApJ, 747, 92 Manfroid, J., Jehin, E., Hutsem´ekers, D., et al. 2009, A&A, 503, 613 Markwick, A. J., Ilgner, M., Millar, T. J., & Henning, T. 2002, A&A, 385, 632 Marty, B., Chaussidon, M., Wiens, R. C., Jurewicz, A. J. G., & Burnett, D. S.
2011, Science, 332, 1533
McElroy, D., Walsh, C., Markwick, A. J., et al. 2013, A&A, 550, A36 Miotello, A., Bruderer, S., & van Dishoeck, E. F. 2014, A&A, 572, A96 Mumma, M. J. & Charnley, S. B. 2011, ARA&A, 49, 471
Podio, L., Kamp, I., Codella, C., et al. 2014, ApJ, 783, L26 Rodgers, S. D. & Charnley, S. B. 2004, MNRAS, 352, 600 Rodgers, S. D. & Charnley, S. B. 2008a, ApJ, 689, 1448 Rodgers, S. D. & Charnley, S. B. 2008b, MNRAS, 385, L48 R¨ollig, M. & Ossenkopf, V. 2013, A&A, 550, A56
Roueff, E., Loison, J. C., & Hickson, K. M. 2015, A&A, 576, A99
Salter, D. M., Hogerheijde, M. R., van der Burg, R. F. J., Kristensen, L. E., & Brinch, C. 2011, A&A, 536, A80
Salyk, C., Pontoppidan, K. M., Blake, G. A., et al. 2008, ApJ, 676, L49 Salyk, C., Pontoppidan, K. M., Blake, G. A., Najita, J. R., & Carr, J. S. 2011,
ApJ, 731, 130
Semenov, D. & Wiebe, D. 2011, ApJS, 196, 25 Stecher, T. P. & Williams, D. A. 1972, ApJ, 177, L141
Sternberg, A., Le Petit, F., Roueff, E., & Le Bourlot, J. 2014, ApJ, 790, 10 Talbi, D., Ellinger, Y., & Herbst, E. 1996, A&A, 314, 688
Teague, R., Guilloteau, S., Semenov, D., et al. 2016, A&A, 592, A49 Terzieva, R. & Herbst, E. 2000, MNRAS, 317, 563
Thi, W.-F., van Zadelhoff, G.-J., & van Dishoeck, E. F. 2004, A&A, 425, 955 Tielens, A. G. G. M. & Hollenbach, D. 1985, ApJ, 291, 722
van Terwisga et al. subm., A&A
Visser, R., van Dishoeck, E. F., & Black, J. H. 2009, A&A, 503, 323 Wakelam, V., Herbst, E., Loison, J.-C., et al. 2012, ApJS, 199, 21 Walsh, C., Millar, T. J., & Nomura, H. 2010, ApJ, 722, 1607
Wampfler, S. F., Jørgensen, J. K., Bizzarro, M., & Bisschop, S. E. 2014, A&A, 572, A24
Watson, W. D., Anicich, V. G., & Huntress, Jr., W. T. 1976, ApJ, 205, L165 Wirstr¨om, E. S. & Charnley, S. B. 2018, MNRAS, 474, 3720
Wirstr¨om, E. S., Charnley, S. B., Cordiner, M. A., & Milam, S. N. 2012, ApJ, 757, L11
Woodall, J., Ag´undez, M., Markwick-Kemper, A. J., & Millar, T. J. 2007, A&A, 466, 1197
Woods, P. M. & Willacy, K. 2009, ApJ, 693, 1360
Zeng, S., Jim´enez-Serra, I., Cosentino, G., et al. 2017, A&A, 603, A22
Appendix A: Vibrationally excited H2
A.1. Introduction
In the disk’s surface layers, the stellar UV field can pump molec-ular hydrogen into a range of vibrationally excited states. The excess vibrational energy is available to overcome reaction bar-riers (Stecher & Williams, 1972; Tielens & Hollenbach, 1985; Ag´undez et al., 2010; Bruderer et al., 2012). This process is par-ticularly important in our models for the endothermic reaction between N and H2(Reaction C.3). The product NH reacts with C or C+in one of the key routes to forming the C–N bond.
Following Tielens & Hollenbach (1985), DALI treats vibra-tionally excited H2 as a single chemical species. This H∗2has a weighted average energy of 30 163 K, corresponding to a vibra-tional pseudo-level ofv∗=6 (London, 1978). The abundance of H∗
2is set by UV pumping, spontaneous decay and collisions with H and H2. The UV pumping rate is 8 times the H2 photodissoci-ation rate (Sternberg et al., 2014) and the spontaneous decay rate is 2×10⁻⁷ s−1(London, 1978). Our current model differs from earlier DALI publications in the adopted collision rates.
DALI originally used the collision rates from Eq. A14 of Tielens & Hollenbach (1985), which represented fits to a small set of computational and experimental data from the 1960s and 70s. Given the importance of H∗
2 for the cyanide abundances, we implemented new collision rates based on more recent and more extensive computational studies. Approximations remain necessary, as described below, because specific rates into or out of thev=6 level are not available in the literature.
A.2. Collisions between H2and H
Lique (2015) computed state-to-state rovibrational rates for col-lisions between H2 and atomic H. The rates are tabulated for gas temperatures from 100 to 5000 K and for H2 states from v,J =0,0 to 3,8. Ortho-para conversion is possible through re-active collisions. The 3,8 level has an energy of 22 000 K above the ground state, so extrapolation to thev∗ =6 pseudo-level at 30 000 K is feasible.
For use in DALI, we need the overall collisional cooling or deexcitation rate from v = 6 to 0, averaged over an unknown population of initial rotational states. In order to extrapolate from Lique’s rates, first we compute the overall cooling rates from every upper level to the 0,0 or 0,1 ground state. The fastest way for an excited H2molecule to cool down to the ground state is usually through a cascade of multiple∆v,∆Jtransitions.
For example, thev,J=0,4 level can either undergo a single
∆J=−4 collision or two∆J=−2 collisions. At 300 K, the rate coefficients from Lique (2015) arek0402 =6.0×10⁻¹⁴ cm3 s−1 for 0,4 → 0,2 andk0200 = 9.1×10⁻¹⁴ cm3 s−1 for 0,2 → 0,0. The rate coefficient for the two∆J=−2 collisions together then
0 5000 10000 15000 20000 25000 30000 Eup/k(K)
10−14
10−13
10−12
q
(H2
–H)
(cm
3s
−
1)
v=0
v=1
v=2
v=3
v∗=6
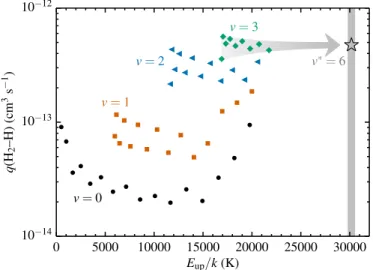
Fig. A.1.Cooling or deexcitation rate coefficients for H2 collid-ing with H at a gas temperature of 300 K. Plotted are the overall rates from a givenv,Jupper level to the 0,0 or 0,1 ground state, based on the fastest possible rovibrational cascade (see text). The rates are grouped by vibrational level:v,J =0,0 to 0,17 (black circles), 1,0 to 1,14 (orange squares), 2,0 to 2,11 (blue triangles) and 3,0 to 3,8 (green diamonds). The original state-to-state rates are from Lique (2015). The gray star marks the adopted rate for ourv∗ = 6 pseudo-level; as indicated by the arrow, this is the average from thev=3 rates.
becomes (k−1
0402 +k−10200)−1 = 3.6×10⁻¹⁴ cm3 s−1. The single
∆J=−4 collision has a rate coefficient of only 2.9×10⁻¹⁵cm3 s−1, so the dominant deexcitation mechanism for the 0,4 level is through a mini-cascade of two∆J=−2 collisions.
We repeat this analysis to find the fastest deexcitation cas-cade for each v,J level in Lique’s dataset. The corresponding rate coefficients at 300 K are plotted in Fig. A.1 as a function of upper-level energy. The rates are grouped by vibrational level: v,J = 0,0 to 0,17 (black circles), 1,0 to 1,14 (orange squares), 2,0 to 2,11 (blue triangles) and 3,0 to 3,8 (green diamonds).
The cooling rates increase fromv = 0 to 3. However, the difference between the v = 2 and 3 rates is only 60% at 300 K and disappears altogether at higher temperatures. Thev= 3 rates therefore appear to be a good proxy for the v = 6 rates. Furthermore, there is little dependence on Jwithin the v = 3 sets. At a given temperature, we thus take the average of the v=3 rates as the H2–H collisional deexcitation rate for thev=6 pseudo-level. These rates are plotted versus temperature in Fig. A.2 and the 300 K rate is marked with a star in Fig. A.1. For use in DALI, we fit the temperature dependence of the rates to the formula from Le Bourlot et al. (1999):
log q
cm3s−1 =a+ b t +
c
t2 , (A.1)
wheret =1+T/(1000 K). The fitted coefficients for the H2–H collisions area=−11.06,b=0.0555 andc=−2.390.
A.3. Collisions between H2and H2