Prevalence of Drug-Resistant Minority
Variants in Untreated HIV-1–Infected
Individuals With and Those Without
Transmitted Drug Resistance Detected
by Sanger Sequencing
Dana S. Clutter,1,a Shuntai Zhou,7,a Vici Varghese,1 Soo-Yon Rhee,1 Benjamin A. Pinsky,1,2 W. Jeffrey Fessel,4 Daniel B. Klein,5 Ean Spielvogel,7 Susan P. Holmes,3 Leo B. Hurley,6 Michael J. Silverberg,6 Ronald Swanstrom,7 and Robert W. Shafer1
1Division of Infectious Diseases and Geographic Medicine and 2Department of Pathology, Stanford University School of Medicine, and 3Department of Statistics, Stanford University, Stanford, 4Department of Internal Medicine, San Francisco Medical Center, Kaiser Permanente Northern California, San Francisco, 5Department of Infectious Diseases, San Leandro Medical Center, Kaiser Permanente Northern California, San Leandro, and 6Division of Research, Kaiser Permanente Northern California, Oakland, California; 7Department of Biochemistry and Biophysics, University of North Carolina–Chapel Hill
Minority variant human immunodeficiency virus type 1 (HIV-1) nonnucleoside reverse transcriptase inhibitor (NNRTI) resistance mutations are associated with an increased risk of virological failure during treatment with NNRTI-containing regimens. To determine whether individuals to whom variants with isolated NNRTI-associated drug resistance were trans-mitted are at increased risk of virological failure during treat-ment with a non-NNRTI–containing regimen, we identified minority variant resistance mutations in 33 individuals with isolated NNRTI-associated transmitted drug resistance and 49 matched controls. We found similar proportions of overall and nucleoside reverse transcriptase inhibitor–associated minority variant resistance mutations in both groups, suggesting that isolated NNRTI-associated transmitted drug resistance may not be a risk factor for virological failure during treatment with a non-NNRTI–containing regimen.
Keywords. HIV-1; drug resistance; minority variant; next-generation sequencing; antiretroviral therapy.
Standard genotypic resistance testing using Sanger sequencing is recommended upon diagnosis of human immunodeficiency virus type 1 (HIV-1) infection to identify individuals to whom drug-resistant HIV-1 was transmitted. Sanger sequencing typ-ically detects drug resistance mutations (DRMs) present in at least 20%–30% of circulating plasma viruses [1]. However,
DRMs present below this threshold, commonly referred to as “minority variant DRMs,” have been shown to increase the risk of virological failure during an initial nonnucleoside reverse transcriptase inhibitor (NNRTI)–containing regimen [2].
The prevalence of transmitted drug resistance (TDR) in the United States ranges from 10% to 20%, with NNRTIs being the most commonly affected drug class [3, 4]. Nucleoside reverse transcriptase inhibitor (NRTI)–associated and NNRTI-associated DRMs emerge commonly in patients with virological failure during an NNRTI-containing regimen. However, in the absence of selective antiretroviral pressure, transmitted NRTI-associated DRMs decay more rapidly than transmitted NNRTI-associated DRMs [5]. Therefore, we investigated whether individuals with NNRTI-associated TDR detected by Sanger sequencing are more likely than those without TDR detected by Sanger sequencing to harbor minority variant DRMs that would increase their risk of virological failure even during a non-NNRTI–containing regimen.
To determine whether TDR is associated with an increased prevalence of minority variant DRMs, we performed Illumina next-generation sequencing of a portion of the reverse tran-scriptase coding region from plasma samples collected before antiretroviral therapy from individuals with isolated NNRTI-associated TDR and individuals without TDR. For accurate identification and quantification of minority variants, we used the Primer ID method, which corrects for polymerase chain reaction (PCR) bias and for PCR and sequencing errors and reveals the sampling depth of the viral population [6].
METHODS
Study Population
The study population included HIV-1–infected, antiretroviral-na-ive individuals in the Kaiser Permanente Medical Care Program– Northern California (KPNC) undergoing Sanger sequencing at Stanford Health Care Diagnostic Virology Laboratory between April 2004 and September 2012. The TDR prevalence in this pop-ulation during the study period was 12.5%. The TDR group com-prised 33 individuals with isolated NNRTI-associated TDR, defined as having variants with ≥1 NNRTI-associated surveillance DRM but no NRTI-associated or protease inhibitor–associated surveil-lance DRMs detected by Sanger sequencing [7]. The control group comprised 49 antiretroviral-naive individuals without any TDR by Sanger sequencing who were matched to the TDR group for HIV-1 RNA level, CD4+ T-cell count, sampling year, and antiretroviral regimen where possible. Additional inclusion criteria were a viral load of >10 000 copies/mL and an available cryopreserved sample for analysis by next-generation sequencing. The Stanford University and KPNC institutional review boards approved this study. Received 17 May 2017; editorial decision 13 July 2017; accepted 17 July 2017; published
online July 25, 2017.
Presented in part: IDWeek 2016, New Orleans, Louisiana, 29 October 2016. aD. S. C. and S. Z. contributed equally to this report.
Correspondence: D. S. Clutter, MD, MS, Division of Infectious Diseases and Geographic Medicine, Stanford University School of Medicine, 300 Pasteur Dr, Rm L-134, Stanford, CA 94304 ([email protected]).
DOI: 10.1093/infdis/jix338 XX
Sanger Sequencing
RNA extracted from plasma was reverse transcribed to com-plementary DNA, using SuperScript One-Step reverse tran-scription PCR with Platinum Taq (ThermoFisher Scientific, Waltham MA). AmpliTaq DNA polymerase was used for nested PCR analysis. Bidirectional sequencing encompassing protease and the first 250 codons of reverse transcriptase was performed using Big Dye Terminator Cycle Sequencing with electro-phoretic resolution of products on an ABI 3730 sequencer (ThermoFisher Scientific). The GenBank accession numbers for the Sanger sequences are in the Supplementary Materials.
Primer ID Illumina Next-Generation Sequencing
Primer ID Illumina/MiSeq sequencing was performed using a pre-viously published protocol [6]. RNA was extracted from plasma, using the QIAamp viral RNA mini kit (Qiagen, Germantown, MD). Barcoded primers (Primer IDs) and Superscript III First Strand Synthesis System (Invitrogen, Carlsbad, CA) were used to generate complementary DNA (primer sequences are in the Supplementary Materials). The complementary DNA was puri-fied to remove the unincorporated Primer ID oligos and then used as a template in 2 rounds of PCR, with MiSeq-indexed primers incorporated in the second round of PCR. Sequencing libraries were purified, quantified, and pooled for sequencing by Illumina MiSeq 300-base paired-end platform. The Illumina bcl2fastq pipeline (v.1.8.4) was used to for initial processing of sequence data. The Primer ID consensus pipeline was then used to create template consensus sequences for each starting viral RNA genome by pooling reads with identical Primer IDs, with the number of unique Primer IDs in a run defining the sam-pling depth of the viral RNA population [6] (available at: https:// github.com/SwanstromLab/PID). The HXB2 numbering for the sequenced regions was 2648–3257 (reverse transcriptase codons 35–235). To distinguish mutations present in the viral RNA from the low rate of residual error, a Poisson threshold set at 10 times the frequency of the residual error was determined for each sam-ple. Additionally, all template consensus sequences containing stop codons were excluded [6].
Statistical Analysis
We defined minority variant mutations as amino acid differ-ences from the consensus B sequence that were detected by next-generation sequencing but not Sanger sequencing. We compared the prevalence and frequencies of minority variant DRMs between the TDR and control groups, using the Fisher exact test and Wilcoxon rank sum test, respectively. We defined potential APOBEC-associated DRMs as DRMs that could result from G→A substitutions within the canonical APOBEC3F
(GA→AA) or APOBEC3G (GG→AG) dinucleotide
con-texts: D67N, E138K, M184I, G190S/E, and M230I [8]. Human APOBEC3F/G enzymes are retroviral restriction factors that generate de novo viral mutations in a characteristic sequence context to impair viral fitness.
We performed 2 analyses of clinical outcomes: (1) we com-pared the proportions of individuals with virological failure between the TDR and control groups, and (2) we compared the proportions of individuals with virological failure between indi-viduals with and those without minority variant DRMs confer-ring reduced susceptibility to any antiretroviral in the regimen they received. Reduced susceptibility to an antiretroviral was defined as intermediate or high-level resistance according to the Stanford HIV Drug Resistance Database interpretation system (version 8.2) [9]. Virological failure was defined as a confirmed HIV RNA level of >75 copies/mL at week 48. The Fisher exact test was used for both comparisons.
RESULTS
Characteristics of the TDR and Control Groups
Overall, 90% of study individuals were male, 55% were white, and the median age was 42 years. The median CD4+ T-cell count was 339 cells/mm3, and the median viral load was 4.8 log copies/ mL. Fifty percent and 35% of patients initiated a regimen con-taining raltegravir or boosted atazanavir, respectively. Eighty-eight percent of regimens included the NRTIs emtricitabine and tenofovir. The median year of pretherapy Sanger sequencing was 2010. Demographic and clinical characteristics were sim-ilar between the TDR and control groups, with the exception that more control individuals initiated a regimen not containing raltegravir or boosted atazanavir (Supplementary Table 1).
Primer ID Illumina Sampling Depth
The median number of template consensus sequences was 619 overall (interquartile range [IQR], 257–1462). It was higher in the control group (1045; IQR, 394–1663) than in the TDR group (445; IQR, 169–960; P = .03, by the Wilcoxon rank sum test). The median lower limit of detection of a minority vari-ant with 95% confidence for a sample was 0.5% overall (IQR, .2%–1.2%), 0.7% in the TDR group (IQR, .3%–1.8%), and 0.3% in the control group (IQR, .2%–.8%; P = .03, by the Wilcoxon rank sum test). The lowest limit of detection was 0.04% in the TDR group and 0.03% in the control group.
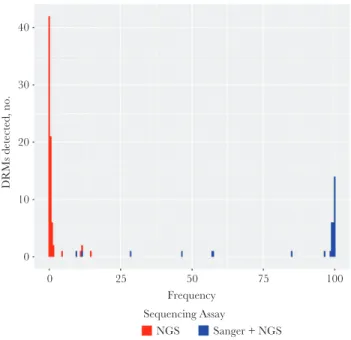
Distribution of Drug Resistance Mutations
by both sequencing methods. Among the 75 minority variant DRMs, 48 occurred at frequencies of 0.1%–0.3%, whereas 27 occurred at frequencies of 0.4%–14%.
Comparison of Minority Variants in the TDR and Control Groups
There was no difference in the proportion of individuals in the TDR (19 of 33 [58%]) and control (30 of 49 [61%]) groups with minority variant DRMs (P = .82; Table 1). NRTI-associated minority variant DRMs were present in 39% of individuals overall, including 10 (30%) in the TDR group and 22 (45%) in
the control group (P = .25). NNRTI-associated minority vari-ant DRMs were present in 37% of individuals overall, including 11 (33%) in the TDR group and 19 (39%) in the control group (P = .65). Combined NRTI-associated plus NNRTI-associated minority variant DRMs were present in 16% of individuals overall, including 2 (6%) in the TDR group and 11 (22%) in the control group (P = .06). There was no difference in the median frequency of minority variant DRMs observed in the TDR and control groups (0.2% in both groups; P = .82).
Of the 75 minority variant DRMs, 24 (32%) were potential APOBEC-associated DRMs, including G190E in 16 individuals, M184I in 5 individuals, and D67N in 3 individuals. There was no difference in the proportions of potential APOBEC-associated minority variant DRMs between the TDR and control groups.
Virological Outcome
There was no difference in the proportions of individuals with virological failure between the TDR and control groups (2 of 33 vs 5 of 49; P = .70). Poor medication adherence was documented in 4 of 7 individuals with virological failure. Two individuals in the control group and none in the TDR group underwent repeat Sanger sequencing. The DRM M184V was detected during viro-logical failure in one of the control individuals who lacked base-line minority variant DRMs.
Two of 33 individuals in the TDR group and 8 of 49 in the control group had minority variant DRMs associated with intermediate or high-level resistance to ≥1 antiretroviral in their treatment regimen (P = .30). One of the 8 patients in Table 1. Minority Variant Drug Resistance Mutations (DRMs) in the
Control Group and the Group With Transmitted Drug Resistance (TDR)
Variable Control Group (n = 49) TDR Group (n = 33) Pa
Minority variant DRM pattern, patients, no. (%)
Any 30 (61) 19 (58) .82
NRTI only 22 (45) 10 (30) .25
NNRTI only 19 (39) 11 (33) .65
NNRTI and NRTI 11 (22) 2 (6) .06
Minority variant DRMs, median frequency, % (number of occurrences)
Any 0.2 (48) 0.2 (27) .82
NRTI
Overall 0.2 (25) 0.2 (16) .29
M41L 0 0.3 (1)
K65R 0 0.2 (1)
D67Nb 0.2 (3) 0
K70E 0 0.1 (1)
K70R 0 0.1 (1)
V75M 0.1 (1) 0
M184Ib 0.4 (5) 0
M184V 0.1 (1) 0.6 (1)
L210W 11.4 (1) 0
T215I 0.2 (2) 0.5 (2)
T215S 0.2 (3) 0
K219E 1.1 (1) 0.1 (4)
K219N 0.7 (1) 0
K219Q 0.8 (1) 0
K219R 0.2 (6) 0.4 (5)
NNRTI
Overall 0.2 (23) 0.5 (11) .10
K101E 0.2 (3) 5.7 (2)
K103N 4.4 (1) 0.3 (1)
K103S 0 0.9 (4)
Y181C 0.2 (3) 0.1 (1)
Y181V 0.2 (1) 0
Y188H 0.1 (1) 0
G190Eb 0.2 (13) 1.2 (3)
P225H 1.5 (1) 0
Frequency is calculated as the percentage of an individual’s virus population that bears a specific DRM.
Abbreviations: NNRTI, nonnucleoside reverse transcriptase inhibitor; NRTI, nucleoside reverse transcriptase inhibitor.
aComparisons of the proportions of patients with a particular minority variant DRM pattern
between the control and TDR groups were made using the Fisher exact test. Comparisons of the DRM frequencies among those individuals with a particular DRM in the control and TDR groups were made using the Wilcoxon rank sum test.
bMutations that could potentially arise from APOBEC-mediated G→A editing [8].
40
30
20
DRMs detected, no.
10
0
0 25 50
Sequencing Assay Frequency
NGS Sanger + NGS
75 100
the control group with a pretherapy minority variant DRM (M184I at a frequency of 0.1%) developed virological fail-ure during treatment with a boosted atazanavir-based reg-imen. Repeat resistance testing was not performed, and the individual achieved resuppression following substitution of lopinavir for atazanavir.
DISCUSSION
We used Primer ID Illumina next-generation sequencing to quantify the number of minority variant DRMs in 33 antiret-roviral-naive individuals with isolated NNRTI-associated TDR detected by Sanger sequencing and 49 matched con-trols without TDR. The overall proportion of individuals with minority variant DRMs was 60%. This proportion is higher than that reported in previous next-generation sequenc-ing studies, which have reported detectsequenc-ing minority variant DRMs in 20%–35% of antiretroviral-naive individuals [10]. Previous next-generation sequencing studies, however, gen-erally ignored minority variant DRMs detected at levels of <1.0% because of the high probability that, in the absence of a method such as Primer ID, variants detected at a lower fre-quency include errors introduced during PCR amplification and sequencing [11].
The minority variant DRMs we observed likely represent a combination of transmitted DRMs that faded to levels no lon-ger detectable by Sanlon-ger sequencing and de novo mutations resulting from HIV-1 reverse transcriptase misincorporation or APOBEC-mediated editing. Indeed, most of the DRMs in this study had a frequency either close to 100% or close to 0%. This bimodal distribution is consistent with 2 sources of DRMs. The finding that nearly one third of the minority variant DRMs were potential APOBEC-associated DRMs suggests that many of these were de novo mutations. In particular, G190E, which was present in 16 individuals, is rarely detected by Sanger sequenc-ing and is extremely unfit [12].
Previous noncomparative studies have shown that indi-viduals with TDR detected by Sanger sequencing may have additional minority variant DRMs [13, 14]. In this study, however, we found that individuals with TDR were not more likely than those without TDR to have additional minority variant DRMs. A potential explanation for the similar preva-lence of minority variant DRMs among those with and those without NNRTI-associated TDR is that minority variant DRMs resulting from de novo mutation are likely to be evenly distributed among individuals with and those without TDR, potentially obscuring differences arising from the fading of transmitted DRMs.
The absence of an excess of minority variant DRMs among individuals with isolated NNRTI-associated TDR may help explain previous reports that antiretroviral-naive individ-uals with isolated NNRTI-associated TDR who receive a
non-NNRTI-containing regimen achieve similar rates of viro-logical suppression as compared to individuals without TDR [15]. However, our study was underpowered to assess the clini-cal significance of minority variant DRMs because only 10 indi-viduals had minority variant DRMs associated with reduced susceptibility to any of the antiretrovirals in their regimen.
Supplementary Data
Supplementary materials are available at The Journal of Infectious
Diseases online. Consisting of data provided by the authors to
benefit the reader, the posted materials are not copyedited and are the sole responsibility of the authors, so questions or com-ments should be addressed to the corresponding author.
Notes
Financial support. This work was supported by the National Institutes of Health (grants KL2 TR 001083 and UL1 TR 001085 [to D. S. C.] and R01 AI068581 [to S.-Y. R., S. P. H., V. V., and R. W. S.], and R56 AI44667 [to R. S.]), the UNC Center for AIDS Research of the National Institutes of Health (grant AI50410), and the UNC Lineberger Comprehensive Cancer Center of the National Institutes of Health (grant P30 CA 16068).
Potential conflicts of interest. D. S. C. has received research funding through the Bristol-Myers Squibb Virology Fellows Research Program. R. S. is a coinventor of Primer ID and will receive royalties from Cellular Research related to the patent/licensing of the technology. R. W. S. is a consultant for Abbott Diagnostics, ViiV Healthcare, and Qiagen Molecular Diagnostics and has received research funding from Gilead Sciences, Bristol-Myers Squibb, Merck, and Vela Diagnostics. W. J. F. and D. B. K. are employed by The Permanente Medical Group. M. J. S. has received research grants from Pfizer and Merck. All other authors report no potential conflicts of interest. All authors have submitted the ICMJE Form for Disclosure of Potential Conflicts of Interest. Conflicts that the editors consider relevant to the content of the manuscript have been disclosed.
References
1. Leitner T, Halapi E, Scarlatti G, et al. Analysis of hetero-geneous viral populations by direct DNA sequencing. Biotechniques 1993; 15:120–7.
2. Li JZ, Paredes R, Ribaudo HJ, et al. Low-frequency HIV-1 drug resistance mutations and risk of NNRTI-based antiret-roviral treatment failure: a systematic review and pooled analysis. JAMA 2011; 305:1327–35.
4. Buchacz K, Young B, Palella FJ Jr, et al. Trends in use of genotypic resistance testing and frequency of major drug resistance among antiretroviral-naive persons in the HIV Outpatient Study, 1999–2011. J Antimicrob Chemother 2015; 70:2337–46.
5. Jain V, Sucupira MC, Bacchetti P, et al. Differential per-sistence of transmitted HIV-1 drug resistance mutation classes. J Infect Dis 2011; 203:1174–81.
6. Zhou S, Jones C, Mieczkowski P, Swanstrom R. Primer ID validates template sampling depth and greatly reduces the error rate of next-generation sequencing of HIV-1 genomic RNA populations. J Virol 2015; 89:8540–55.
7. Bennett DE, Camacho RJ, Otelea D, et al. Drug resistance mutations for surveillance of transmitted HIV-1 drug-resis-tance: 2009 update. PLoS One 2009; 4:e4724.
8. Rhee SY, Sankaran K, Varghese V, et al. HIV-1 Protease, Reverse Transcriptase, and Integrase Variation. J Virol 2016; 90:6058–70.
9. Tang MW, Liu TF, Shafer RW. The HIVdb system for HIV-1 genotypic resistance interpretation. Intervirology 2012; 55:98–101.
10. Simen BB, Simons JF, Hullsiek KH, et al.; Terry Beirn Community Programs for Clinical Research on AIDS. Low-abundance drug-resistant viral variants in chronically HIV-infected, antiretroviral treatment-naive patients sig-nificantly impact treatment outcomes. J Infect Dis 2009; 199:693–701.
11. Thys K, Verhasselt P, Reumers J, Verbist BM, Maes B, Aerssens J. Performance assessment of the Illumina mas-sively parallel sequencing platform for deep sequencing analysis of viral minority variants. J Virol Methods 2015; 221:29–38.
12. Huang W, Gamarnik A, Limoli K, Petropoulos CJ, Whitcomb JM. Amino acid substitutions at position 190 of human immunodeficiency virus type 1 reverse transcrip-tase increase susceptibility to delavirdine and impair virus replication. J Virol 2003; 77:1512–23.
13. Dauwe K, Staelens D, Vancoillie L, Mortier V, Verhofstede C. Deep sequencing of HIV-1 RNA and DNA in newly diagnosed patients with baseline drug resistance showed no indications for hidden resistance and is biased by strong interference of hypermutation. J Clin Microbiol 2016; 54:1605–15.
14. Toni TA, Asahchop EL, Moisi D, et al. Detection of human immunodeficiency virus (HIV) type 1 M184V and K103N minority variants in patients with primary HIV infection. Antimicrob Agents Chemother 2009; 53:1670–2.