VICE PRESIDENTIAL
CANDIDATES IN THE
AMERICAN PRESIDENTIAL
ELECTIONS: STRATEGIES FOR
SELECTION AND EFFECTS
Marco Morini,Padova University, Italy.
Abstract
American vice presidential candidates are chosen for several reasons. Some of these rationales are easy to be recognized, while others belong to the cockles of the heart of the presidential candidates. Social scientists and journalists agree about the fac-tors that are more essential: the vice presidential (VP) nominee’s capacity of balanc-ing the ideological and personal characteristics of the presidential candidate and the “native son” effect, namely the guarantee that the VP nominee would carry his/her own state. These strategies are often combined and they work at different electoral levels: the first one has usually a national or macro-regional significance while the second is crucial in the battleground states. This research is divided into two sec-tions: the first one investigates the “balancing the ticket” strategy, offering an over-view of about one century of presidential races. The second aims to verify the VP nominee’s effect in his/her home state. The results will confirm that there have been several running mates who have been selected in order to “balance the ticket” but also that the vice president nominee’s effect in the home states has been quite poor.
Keywords: American Politics; American Political History; American Presidential Campaigns; Political Strategies and Party Politics.
Introduction
An accepted wisdom is that vice presidential candidates are of minor impor-tance to most voters. Perhaps as a result there have not been much research aimed at the reasons and the effect of vice presidential nominee selection (Ad-kinson 1982, 331; Wattenberg 1995) and most of them tried to measure a “na-tional effect” (Wattenberg and Grofman 1993, 175; Grofman and Kline 2010). Particularly, Grofman and Kline study examined voters’ specific preferences for both President and Vice President and found that about 11% of the popula-tion on average has “conflicted” preferences — where a voter prefers the pres-idential candidate of one party but also likes the vice prespres-idential nominee of the other party. Using this data, they estimate the degree to which a vice presi-dential candidate alone might determine the electoral result. The two schol-ars note that these patterns of “conflicted” voting behaviour have decreased over time: only 6.9 per cent and 6.8 per cent of the electorate had conflicted prefer-ences in 2004 and 2008, likely the outcome of “increasing partisan polarization.” Grofman and Kline found out that the direct effect of a vice presidential candi-date is generally less than 1 per cent in terms of getting voters to cross party lines:
And, in order to better approach this field of study, we also should not forget that pop-ular culture sees voters taking the president and the vice president as a “package deal.”
Only in 1972 was more than 1 per cent of the final vote af-fected by conflicted vice presidential and presidential pref-erences; on average, over the 1968-2008 period, the net im-pact of conflicted presidential and vice presidential choices is only slightly less than 0.6% of the votes shifted (p. 1).
Grofman and Kline also pointed out that there were two relevant caveats to their findings:
It is interesting to note that Palin’s choice revived academic interest around the fig-ure of the Vice Presidential nominees. Ulbig (2010) focused her research on what extent do vice presidential candidates affect individual-level vote choice for pres-ident. She found out that when vice presidential candidates draw media interest, feelings about them become much more relevant to voters. Investigating Palin’s can-didacy, who drew high level of media attention, Ulbig discovered that feelings about her exerted a stronger impact on vote choice, especially among Independent voters. Other research explored the so-called “home-state effect”, that is well-known for Pres-idential candidates and kind of controversial for VP nominees: Devine and Kopko (2011) argue that selecting a vice presidential candidate from a small state is not suf-ficient to produce a significant vice presidential home state advantage. The same au-thors, a few years later (2013), found out that vice presidential home state advantages are statistically negligible and conditioned on the interactive effect of political expe-rience and state population. Furthermore, their results indicate that the mobilization of new voters primarily accounts for presidential home state advantage, while vice presidential home state advantage is mainly due to the conversion of existing voters. Our research goes on a different direction: first, we go through the last 24 presi-dential elections and we try to understand which rationales brought presipresi-dential candidates to choose their running mates. Reasoning on a qualitative level, we aim to show the different strategies employed by the parties and the candidates in order to make the tickets more appealing to the populations and so to maximize votes. In the second section, we measure the actual vice presidential nominee effect, at least in his/her home state. By monitoring the difference between the perfor-mance of the ticket at the national level with the one in the VP home state and comparing this margin with the one obtained in the previous and in the subse-quent presidential election, we are able to estimate the VP effect at state-level.
The First Strategy: Balancing the Ticket
“political kindness” and did not expect him to accept the VP nomination. Inves-tigative journalist Seymour Hersh (1997, 12) agrees with Robert Kennedy’s re-construction of the events, and wrote that John Kennedy would have preferred Missouri Senator Stuart Symington as his running-mate, but Johnson joined forces with House Speaker Sam Rayburn to influence Kennedy to favour himself. J
who were in favour of Prohibition. On the other hand, New York Governor Al Smith’s was favoured by Catholics, ethnic minorities, anti-Prohibition supporters and delegates from the big-cities in the Northeast and urban Midwest. Because of the two-thirds rule, neither McAdoo nor Smith were able to win the nomination. Ballots followed other ballots and with this unprecedented situation, on the 100th count both Smith and McAdoo decided to abandon the race. Then the party con-vention was able to start looking for a compromise figure who would be accept-able to both McAdoo and Smith supporters (Prude 1972). Finally, on the 103rd ballot, the delegates chose John W. Davis as the presidential candidate. He was a former House Representative from West Virginia, virtually unknown to the press and to the greater audience. Nebraska Governor Charles Bryan, William Jennings Bryan’s brother, was selected as VP nominee. The strategy behind this choice was to appeal to rural voters, whom still supported his brother, who was the lead-er of the populist wing and three times presidential candidate (Tucklead-er 2010, 19).
The Second Strategy: Carrying the Home State
of about only 2.5 percentage points for the top of the ticket in his/her home state.
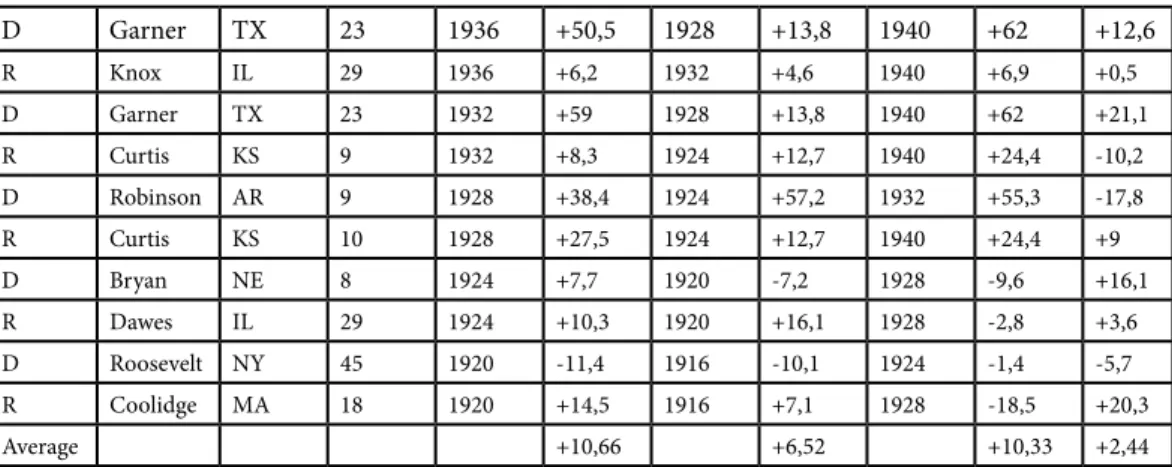
Tab. 1: Vice presidential nominees since 1920. Net popular vote (gain).
Previous Comparison Next Comparison
Party Candidate State EV Year RVI Year RVI Year RVI Net
Gain
D Biden DE 3 2012 +14,7 2004 +10,1 +4,6
R Ryan WI 3 2012 -3 2008 -6,7 +3,7
D Biden DE 3 2008 +17,7 2004 +10,1 +7,7
R Palin AK 3 2008 +28,8 2004 +23,1 2012 +10,1 +12,2
D Edwards NC 15 2004 -10 2000 -13,4 2008 -6,9 +0,2
R Cheney WY 3 2004 +37,3 2000 +21,5 2008 +39,5 +6,8
D
Lieber-man CT 8 2000 +17 1996 +9,6 2004 +12,5 +5,9
R Cheney WY 3 2000 +40,6 1996 +21,5 2008 +39,5 +10,1
D Gore TN 11 1996 -6,1 1988 -8,6 2004 -11,8 +4,1
R Kemp NY 33 1996 -20,3 1992 -10,3 2000 -24,5 -2,9
D Gore TN 11 1992 -0,9 1988 -8,6 2004 -11,8 +9,3
R Quayle IN 12 1992 +11,8 1984 +5,5 1996 +14,1 +2
R Quayle IN 12 1988 +12,4 1984 +5,5 1996 +14,1 +2,6
D Ferraro NY 36 1984 +10,2 1980 +7,1 1988 +11,8 +0,8
R Bush TX 29 1984 +9 1976 +1,1 1996 +13,5 +1,7
D Mondale MN 10 1980 +13,7 1972 +17,6 1988 +14,8 -2,5
R Bush TX 26 1980 +4,1 1976 +1,1 1996 +13,5 -3,2
D Mondale MN 10 1976 +10,8 1972 +17,6 1988 +14,8 -5,4
R Dole KS 7 1976 +9,6 1972 +15 1980 +14,8 -5,3
D Muskie ME 4 1968 +11,5 1964 +15,1 1972 +0,5 +3,7
R Agnew MD 10 1968 -2,3 1964 -8,4 1976 -4 +3,9
D
Hum-phrey MN 10 1964 +5,2 1960 +1,3 1972 +17,6 -4,3
R Miller NY 43 1964 -14,7 1960 -5,1 1968 -6,2 -9
D Johnson TX 24 1960 +1,8 1956 +4,1 1968 +2 -1,2
D Kefauver TN 11 1956 +14,8 1952 +10,6 1960 -7,3 +13,2
R Nixon CA 32 1956 -4,3 1944 -6 1964 +4,3 -3,4
D Sparkman AL 11 1952 +40,4 1944 +56,6 1956 +32,4 -4,1
R Nixon CA 32 1952 +3,7 1944 -6 1964 +4,3 +4,6
D Barkley KY 11 1948 +10,8 1944 +13,7 1952 +10,9 -1,6
R Warren CA 25 1948 +4 1944 -6 1964 +4,3 +4,9
D Truman MO 15 1944 -4,6 1940 -4,8 1952 +9,3 -6,8
R Bricker OH 25 1944 +7,1 1940 +5,5 1948 +4,2 +2,2
D Wallace IA 11 1940 -14,4 1936 -12,5 1944 -12 -2,1
D Garner TX 23 1936 +50,5 1928 +13,8 1940 +62 +12,6
R Knox IL 29 1936 +6,2 1932 +4,6 1940 +6,9 +0,5
D Garner TX 23 1932 +59 1928 +13,8 1940 +62 +21,1
R Curtis KS 9 1932 +8,3 1924 +12,7 1940 +24,4 -10,2
D Robinson AR 9 1928 +38,4 1924 +57,2 1932 +55,3 -17,8
R Curtis KS 10 1928 +27,5 1924 +12,7 1940 +24,4 +9
D Bryan NE 8 1924 +7,7 1920 -7,2 1928 -9,6 +16,1
R Dawes IL 29 1924 +10,3 1920 +16,1 1928 -2,8 +3,6
D Roosevelt NY 45 1920 -11,4 1916 -10,1 1924 -1,4 -5,7
R Coolidge MA 18 1920 +14,5 1916 +7,1 1928 -18,5 +20,3
Average +10,66 +6,52 +10,33 +2,44
(about 4 points rather than 1.5) than those who were no longer in office, or who were U.S. representatives and therefore represented a single House district rather than the whole state. And this is also easily intuitive: senators and governors also serve for longer terms and they usually benefit from more extensive media coverage (Cohen 2001). Fourth, the effects are probably more sounding in smaller states than in bigger ones, maybe because their political cultures are more cohesive and it’s rarer for them to see a native son nominated to a presidential ticket. Vice presidential nominees from states with fewer electoral votes have historically provided a larger home-state boost — Joe Biden and Sarah Palin each had significant effects in Delaware and Alaska in 2008. Fifth, although electoral coalitions have been quite steady in the recent decades, that has not always been like this; Vermont was once one of the most Republican states in the country, and Arizona one of the most Democratic. Therefore, it seems that there are many controversial messages in the data, as these alterations can some-times be more powerful than any effect a vice presidential nominee might have. A different method of analysis might be able to cover some of these issues, although other problems are probably not tractable given the relative scarcity of data (just one presidential election every four years) and the inherent challenge in searching the causes behind anyone’s vote. With that said, it seems that the vice presidential nominee’s effect on his or her home state is normally pretty modest, just around two or three percentage points on average. Certainly, two or three percentage points in one or more swing states is something that every candidate would hope to achieve, but it is probably not enough to overstate the other variables – positive and neg-ative - that a vice presidential candidate could potentially bring in to the ticket. Indeed, in the last two decades, presidential campaigns have not resorted in this principle, with recent vice presidential nominees coming from states like Alaska, Connecticut, Delaware and Wyoming that are currently consid-ered not competitive. In 2012, however, Mitt Romney decided to “risk” again, picking Paul Ryan from Wisconsin, a potential battleground state. Although Ryan halved the gap between Republicans and Democrats, he was not able to turn his home state to Red (it would have been the first time since 1984).
Conclusion
On this point, we should bear in mind what statistics suggest: despite the low effective powers granted by Article II of the Constitution, Vice Presidents usually have a bright future in front of them. Since 1900, about 25 percent of the people nominated for Vice President by Republicans and Democrats have later become presidential nominees themselves, and 15 percent have actually become president, whether by winning the office on their own or by succeeding an incumbent who died or resigned in office.
References
Adkinson, Daniel. 1982. “The Electoral Significance of the Vice Presidency,” Presidential Studies Quarterly 12 (Summer 1982): 330-36.
Ambrose, Stephen E. 1987. Nixon: The Education of a Politician 1913–1962. New York: Simon & Schuster.
Binning, William C., William C. Larry, Eugene Esterly and Paul A. Sracic. 1999. Encyclopedia of American Parties, Campaigns, and Elections. Westport, Conn.: Greenwood Press, 1999.
Braden, Maria. 1996. Women Politicians and the Media. Lexington: The University Press of Ken-tucky.
Caro, Robert A. 2012. The Passage of Power. New York: Alfred A. Knopf.
Catledge, Turner. 1940. “Senator Drafted: New Party Rulers Pick Veteran Farm Leader to Balance Ticket,” The New York Times, 29 June.
Cohen, Jeffrey E. 2001. “Popular Views of the Vice President: Vice Presidential Approval.” Presi-dential Studies Quarterly 31: 142-49.
Cook Political Report. 2012. The Relative Vote Index, 28 May, URL:
http://cookpolitical.com/user/login?destination=/presidential/charts (retrieved 11 May 2013). Devine, Christopher, and Kyle Kopko. 2011. “The Vice Presidential Home State Advantage Recon-sidered: Analyzing the Interactive Effect of Home State Population and Political Experience, 1884-2008,” Presidential Studies Quarterly 41 (1): 1–17.
Devine, Christopher, and Kyle Kopko. 2013. “Presidential Versus Vice Presidential Home State Advantage: A Comparative Analysis of Electoral Significance, Causes, and Processes, 1884- 2008,” Presidential Studies Quarterly 43: 814–838.
DiSalvo, Daniel. 2010. “The Politics of a Party Faction: The Liberal-Labor Alliance in the Demo-cratic Party, 1948-1972,” Journal of Policy History 22: 269-299.
Ferraro, Geraldine and Catherine Whitney. 1998. Framing a Life: A Family Memoir. New York: Scribner.
Ferraro, Geraldine. 2004. My Story. Evanston: Northwestern University Press. Gellman, Irwin. 1999. The Contender. New York: The Free Press.
Glass, Andrew. 2007. “Ferraro joins Democratic ticket July 12, 1984”, The Politico, 12 July. Goldman, Peter and Tony Fuller. 1995. The Quest for the Presidency 1984. New York: Bantam Books.
Goldstein, Joel. 2007. “Presidential Ticket-balancing.” In The American Midwest: An Interpretive Encyclopedia, eds. Richard Sisson, Christian Zacher and Andrew Clayton. Indianapolis: Indiana University Press.
Grofman Bernard, and Reuben Kline. 2010. “Evaluating the Impact of Vice Presidential Selection on Voter Choice,” Presidential Studies Quarterly 40(2): 303-309.
Hatfield, Mark O. 1997. “Alben W. Barkley (1949–1953)”. In Vice Presidents of the United States, 1789-1993. Washington, D.C.: U.S. Government Printing Office.
Hersh, Seymour M. 1997. The Dark Side of Camelot. Boston: Little, Brown & Company. Knuckey, Jonathan. 2012. “The “Palin Effect” in the 2008 U.S. Presidential Election,” Political Re-search Quarterly 65 (2): 275-289.
Libbey, James K. 1979. Dear Alben: Mr. Barkley of Kentucky. Lexington, Kentucky: The University Press of Kentucky.
Mencken, Henry L. and George J. Nathan. 1929. The American Mercury. New York: Alfred A. Knopf.
Mieczkowski, Yanek and Mark Christopher Carnes. 2001. The Routledge Historical Atlas of Presi-dential Elections. New York: Routledge.
Miller Fitzgerald, Libby. 2004. Bill Miller—Do You Know Me?: A Daughter Remembers. Lynch-burg, VA: Warwick House Publishers.
Morrow, Lance. 1984. “Why Not a Woman?” Time, 4 June.
Neal, Steve. 1985. McNary of Oregon: A Political Biography. Portland, OR: Western Imprints. Neuberger, Richard. 1940. “M’Nary Is Strong in the Northwest,” The New York Times, 7 July. Prude, James. 1972. “William Gibbs McAdoo and the Democratic National Convention of 1924”. The Journal of Southern History (Southern Historical Association) 38 (4): 621–628.
Romero, David W. 2001. “Requiem for a Lightweight: Vice Presidential Candidate Evaluations and the Presidential Vote.” Presidential Studies Quarterly 31: 454-63.
Silver, Nate. 2012. “The Overrated Vice Presidential Home-State Effect” The New York Times, 23 April. URL: http://fivethirtyeight.blogs.nytimes.com/2012/04/23/the-overrated-vice-presiden-tial-home-state-effect/ (retrieved 18 August 2013).
Tucker, Garland S. III. 2010. The High Tide of American Conservatism: Davis, Coolidge and the 1924 Election. New York: Emerald.
Ulbig, Stacy. 2010. “The Appeal of Second Bananas: The Impact of Vice Presidential Candidates on Presidential Vote Choice, Yesterday and Today,” American Politics Research 38 (2): 330-355. Wattenberg, Martin P. 1995. “The Role of Vice Presidential Candidate Ratings in Presidential Vot-ing Behavior,” American Politics Research 23 (October 1995): 504-14.