ISSN 0975-928X
Research Article
Heterosis and combining ability for grain yield and yield component traits
in maize (
Zea mays
L.)
A. Rajitha1, D. Ratna Babu1*, Lal Ahamed M1 and V. Srinivasa Rao 2
1Department of Genetics and Plant Breeding 2
Department of Statistics and Mathematics, Agricultural College, Bapatla Agricultural College, Bapatla-522 101
*Email: [email protected]
(Received: 10 Apr 2014; Accepted:20 Jul 2014)
Abstract
Fifteen hybrids obtained by crossing five Lines with three Testers were evaluated to study heterosis and combining ability for grain yield per plant and its component traits. Further, heterosis studies revealed that almost all the Line x Tester combinations registered significant positive heterosis over both mid and better parents for grain yield per plant. The crosses namely BM-256 x BM-85, BM-256 x BM-143, BM-3 x RNBL-4351, BM-421 x BM-85 recorded higher level of significant relative heterosis and heterobeltiosis for grain yield per plant. Combining ability analysis suggested the preponderance of non-additive type of gene action for majority of the traits viz., days to 50% tasseling, days to 50% silking, 100-seed weight, grain protein content and grain yield per plant. Out of the five lines tested in the present investigation, genotypes namely BM-421 and BM-256 recorded significant general combining ability effects in desirable direction for majority of the traits; while the tester, BM-143 recorded significant general combining effect for grain protein content. None of the 15 Line x Tester combinations recorded significant sca effect for grain yield per plant. The cross BM-77 x BM-85 recorded significant sca effect for plant height and grain protein content.
Key words:
Maize, Line x Tester analysis, Heterosis and Combining ability
Introduction:
Maize is a highly allogamous crop and there is a wide scope for exploitation of hybrid vigour, hence it has been successfully exploited for the production of hybrids. Parental selection is very important in hybrid development. In this context, L x T analysis (Kempthome, 1957) has widely been used for evaluation of inbred lines by crossing them with testers. The value of any inbred line in hybrid breeding ultimately depends on its ability to combine very well with other lines to produce superior hybrids. Hence, Combining ability analysis is an important tool to identify parents with better potential to transmit desirable characteristics to the progenies and to identify the best specific cross(s) for yield.
The exploitation of heterosis in maize (Zea mays
L.) can be accomplished through the development and identification of high per se performance vigorous parental lines and their subsequent evaluation for combining ability in cross combinations to identify the hybrids with high heterotic effects. The information about the heterotic patterns and combining ability of the parents and crosses facilitate the breeders in the selection and development of the single cross hybrids.
Material and Methods
The experimental material consisted of 24 genotypes, comprising of 5 Lines (421,
BM-256, BM-77, BM-211 and BM-3), three Testers (RNBL-4351, BM-143 and BM-85) and their resultant 15 hybrids produced by line x tester mating design were evaluated along with one standard check DHM-117. The experimental materials were raised in randomized block design with three replications in experimental field at Agricultural College farm, Bapatla during Kharif
2012. Each genotype was raised in five rows of three metre length with a spacing of 60 x 25 cm. Observations were recorded on ten randomly selected plants per treatment per replication for the traits namely plant height (cm), cob length (cm), kernel rows per cob and grain yield per plant (g) and were used for statistical analysis. However, days to 50% tasseling, days to 50% silking, days to maturity, 100-seed weight (g) and grain protein content (%) were recorded on plot basis. The data on the following yield and yield component traits were recorded.
Line x Tester analysis was carried out according to Kempthorne (1957). The heterosis was estimated in terms of three parameters, i.e. relative heterosis, heterobeltiosis and standard heterosis. Mean values per replication for all traits were subjected to analysis of variance according to Panse and Sukhatme (1985) for randomized block design. The estimates of general and specific combining ability and their variances were obtained by using covariance of half sibs and full sibs.
ISSN 0975-928X
The analysis of variance for combining ability revealed that lines had significant amount of variability for the characters viz., days to 50% tasseling, days to maturity, kernel rows per cob, 100-seed weight and grain protein content, while testers had significant variability for plant height and grain protein content. However, crosses had significant amount of variability for all characters except for days to maturity and grain yield per plant. The parents vs hybrids were significant for majority of the characters except days to maturity and grain protein content which suggested the presence of substantial amount of heterosis in crosses for majority of the characters (Table 1). In case of Line x Tester effects significant amount of variability was observed for days to 50% tasseling, days to 50% silking, plant height, 100-seed weight and grain protein content.
The estimates of relative heterosis (RH) and heterobeltiosis (BH) were ranged from -7.69 to 0.67 and 9.09 to 0.67 for days to 50% tasseling, -7.55 to 4.55 and -8.13 to 1.90 for days to 50% silking, -6.38 to 2.48 and -8.79 to 0.76 for days to maturity, 10.30 to 53.86 and 1.41 to 45.77 for plant height, 14.76 to 45.02 and 4.48 to 44.91for cob length, 1.79 to 23.38 and -6.68 to 22.01 for kernel rows per cob, -0.28 to 48.51 and -1.85 to 44.04 for 100-seed weight, -12.54 to 18.44 and -14.18 to 17.54 for grain protein content and 70.96 to 134.12 and 56.75 to 131.81 for grain yield per plant (Table 2), respectively.
Out of the 15 hybrids, 9 and 10 hybrids were found significant and negative heterosis over mid and better parent for days to 50% tasseling, 6 and 6 hybrids recorded significant negative heterosis over mid and better parent for days to 50% silking, 2 and 1 hybrid recorded significant negative heterosis over mid and better parent for days to maturity. Negative heterosis is desirable for these characters which indicates the earliness.
Among 15 hybrids over mid and better parent, 12 and 8 hybrids recorded significant positive heterosis for plant height, all 15 and 11 hybrids recorded positive significant heterosis for cob length, 10 and 7 hybrids for kernel rows per cob, 14 and 13 hybrids for 100-seed weight, 15 and 9 hybrids for grain protein content showed positive and significant heterosis.All 15 and 14 hybrids exhibited positive and significant relative heterosis and heterobeltiosis for grain yield per plant. The cross BM-421 x BM-143 recorded highest positive significant heterosis over mid parent and better parent. These results were in accordance with the findings of Appunu and Satyanarayana (2007) and Raghu et al. (2012).Improvement in yield is one of the objectives, thus the heterosis can be useful only with superiority over the best checks. The check
Andhra Pradesh. The estimates of standard heterosis (SH) ranged from -16.67 to -7.41, -19.44 to -10.56 and -13.54 to -6.60 for days to 50% tasseling, days to 50% silking and days to maturity (Table 2), respectively. All 15 hybrids exhibited significant standard heterosis in desirable direction.
The range of standard heterosis ranged from -24.57 to 4.04 for plant height, 13.40 to 10.90 for cob length, 11.06 to 2.65 for kernel rows per cob, -28.94 to 5.39 for 100-seed weight, -15.47 to 7.00 for grain protein content and -21.30 to 0.99 for grain yield per plant. None of the 15 Line x Tester combinations recorded significant positive standard heterosis for plant height, cob length, kernel rows per cob, 100-seed weight and grain yield per plant over check DHM-117. The hybrid BM-256 x BM-143 recorded maximum grain yield per plant (130.03) over the standard check. Similar results of positive heterosis over standard parent were reported by Appunu and Satyanarayana (2007), Dubey et al. (2009) and Raghu et al.
(2012).
Analysis of variance for combining ability for yield and yield contributing characters inmaize is presented in the Table 3. Further the variation present in the hybrids is partitioned into portions attributable to lines, testers, lines x tester components. The per cent contribution towards the total variance was maximum due to the interaction of lines and testers for the traits grain yield per plant, 100-seed weight, days to 50% silking, grain protein content, days to 50% tasseling and days to maturity while contribution of lines alone was maximum towards the total variance for cob length, kernel rows per cob and plant height (Table 3).
However the ratio of variance to the total variance suggested the preponderance of non-additive gene action for majority of the traits viz., days to 50% tasseling, days to 50% silking, 100-seed weight, grain protein content and grain yield per plant. Similar results were reported by Venugopal et al.
(2002), Sumalini and Rani (2010), Premlatha et al.
(2011) and for non-additive gene action. While cob length which is governed by additive gene action and traits like kernel rows per cob and days to maturity were governed by both additive and non-additive gene action.
ISSN 0975-928X
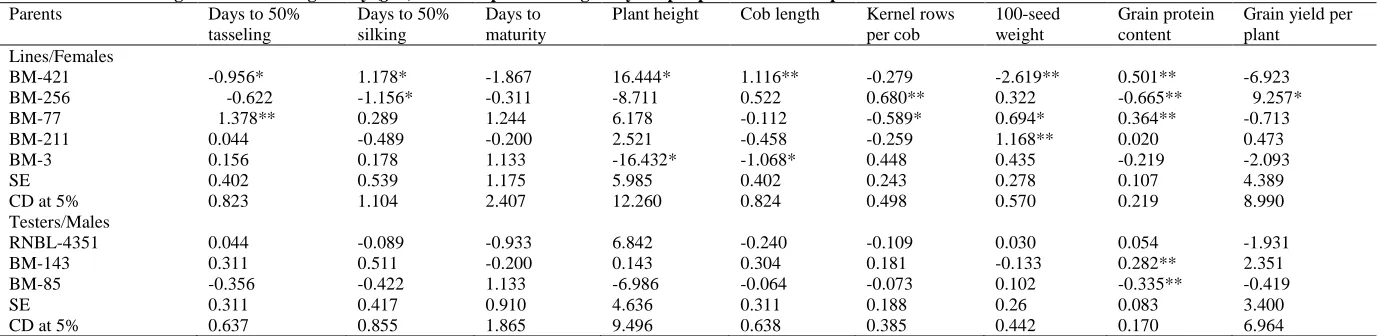
content and BM-211 for 100-seed weight, respectively (Table 4). While the tester, BM-143 recorded significant general combining effect for grain protein content (Table 4).
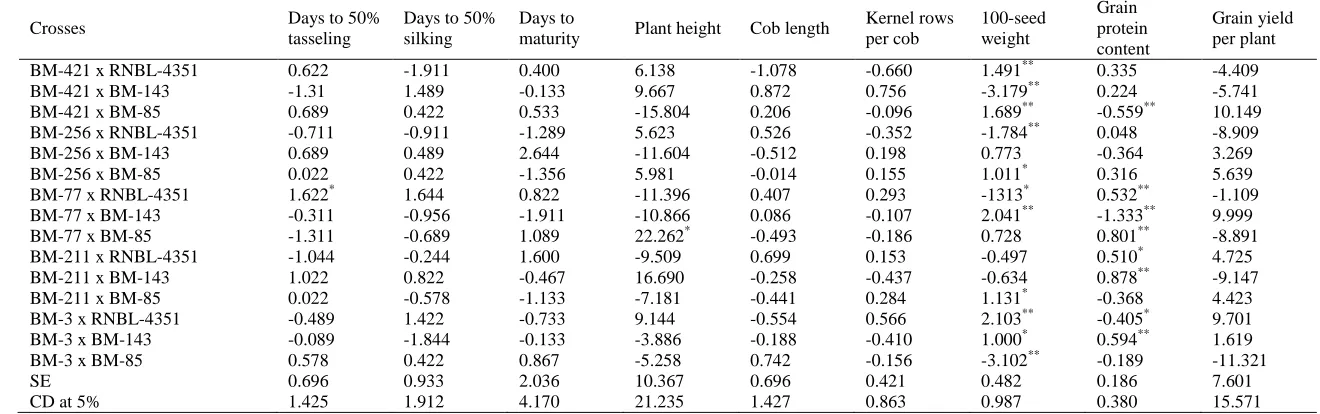
Further the tested lines were given ranking based on the respective combining abilities of all the characters studied, the genotypes namely BM-421 and BM-256 ranked first followed by BM-211 (Table 4). Therefore these lines can be utilized in improvement of the respective traits in any breeding programme wherever hybridization is involved. Due to their good combining ability these lines can be utilized straightaway as parents for production of good hybrids by crossing with other divergent lines and can also be employed in the development of synthetic varieties. None of the 15 Line x Tester combinations recorded significant
sca effect for grain yield per plant (Table 5). The cross BM-77 x BM-85 recorded significant sca
effect for plant height and grain protein content. The crosses BM-3 x RNBL-4351 and BM-421 x BM-85 recorded significant sca effects for 100-seed weight. The gca effects of parents and sca
effects of their hybrid combinations indicated that the crosses with high sca effects were resulted due to high x low, low x low and high x high gca
combinations. Therefore, one can afford to include some low general combiners also along with good combiners in hybridization programmes.
References
Appunu, C and Satyanarayana, E. 2007. Heterosis for grain yield and its components in maize (Zea mays L.). J.Res. ANGRAU 35: 3, 27-30. Dubey, R.B., Joshi, V.N and Verma, M. 2009. Heterosis
for nutritional quality in conventional and non-conventional hybrids of maize (Zea mays L.). Indian J.Genet. 61: 2, 109-114.
Kempthorne, O. 1957. An introduction of Genetic Statistics. John Wiley and Sons Inc., New York. pp. 458-471
Panse, V.G. and Sukhatme, P.V. 1985. Statistical methods for Agricultural workers, Indian Council of Agricultural Research, New Delhi. Premlatha, M., Kalamani, A and Nirmalakumari, A.
2011. Heterosis and combining ability for grain yield and quality in maize (Zea mays L.). Adv. in Env. Biol. 5: 6, 1264-1266.
Raghu, B., Suresh, J., Geetha, P., Saidaiah, P and Kumar, S.S. 2012. Heterosis for grain yield and its component traits in maize (Zea mays L.). J.Res. ANGRAU . 40: 1, 83-90.
Sumalini, K and Rani, T.S. 2010. Heterosis and combining ability for polygenic traits in late maturity hybrids of maize (Zea mays L.). Madras Agric J. 97: 10-12, 340-343.
ISSN 0975-928X
Table 1. Analysis of variance (mean squares) for grain yield and its attributing characters
Source of variation Df Days to 50% tasseling
Days to 50% silking
Days to maturity
Plant height Cob length Kernel rows per cob
100-seed weight
Grain protein content
Grain yield per plant
Replications 2 0.710 0.522 1.797 6.437 3.032 0.935 0.873 0.185 91.591
Genotypes (G) 22 8.130** 6.949** 17.086 2141.649** 13.733** 2.939** 31.570** 1.380** 2546.633**
Parents (P) 7 5.804** 3.500 24.423 1200.839** 2.768 2.443** 8.303** 0.599** 65.456
Lines (F) 4 8.233** 4.733 32.767* 786.468 0.315 3.251** 13.388** 0.551** 83.609
Testers (M) 2 3.444 2.778 8.444 2327.307** 7.165 1.240 0.881 0.994** 54.613
(F Vs M) 1 0.803 0.011 23.003 605.388 3.784 1.619 2.809 0.000 14.532
Crosses 14 4.613** 6.327* 11.181 928.743** 2.994* 1.255* 15.112** 1.869** 272.427
Parents Vs. Crosses 1 73.667** 39.792** 48.392 25708.004** 240.842** 29.974** 424.846** 0.001 51753.749**
Line Effect 4 7.256 6.922 14.522 1486.895 6.479 2.598 20.251 1.966 312.150
Tester Effect 2 1.689 3.356 16.467 717.281 1.155 0.375 0.218 1.458 70.736
Line x Tester Effect 8 4.022* 6.772* 8.189 702.533* 1.711 0.804 16.265** 1.924** 302.988
Error 44 1.453 2.613 12.433 322.405 1.456 0.532 0.697 0.103 938.771
Total 68 3.591 3.954 13.626 901.690 5.474 1.323 10.690 0.519 938.771
Table 2. Magnitude of Relative Heterosis (RH), Heterobeltiosis (BH) and Standard Heterosis (SH) for days to 50% tasseling, days to 50% silking and days to maturity
Sl. No. Hybrids/ crosses Days to 50% tasseling Days to 50% silking Days to maturity
RH BH SH RH BH SH RH BH SH
1 BM-421 x RNBL-4351 -3.45 -6.04** -13.58** -1.65 -2.61 -17.22** -4.60 -8.79** -13.54**
2 BM-421 x BM-143 -6.57** -8.78** -16.67** 4.55 1.90 10.56** -1.56 -4.18 -12.50**
3 BM-421 x BM-85 -2.11 -2.80 -14.20** 0.65 -1.90 -13.89** 0.00 -3.37 -10.42**
4 BM-256 x RNBL-4351 -6.80** -8.05** -15.43** -6.15** -7.05** -19.44** -5.82* -8.06* -12.85**
5 BM-256 x BM-143 -3.07 -4.05 -12.35** -3.82 -4.43 -16.11** 1.34 0.76 -7.99*
6 BM-256 x BM-85 -4.17* -4.83* -14.81** -5.73* -6.33* -17.78** -2.47 -3.75 -10.76**
7 BM-77 x RNBL-4351 0.67 0.67 -7.41** 0.96 -0.63 -12.78** -1.32 -4.03 -9.03**
8 BM-77 x BM-143 -2.36 -2.68 -10.49** -4.43 -4.43 -16.11** -1.73 -2.66 -11.11**
9 BM-77 x BM-85 -4.11* -6.04** -13.58** -5.70* -5.70* -17.22** 2.48 0.75 -6.60*
10 BM-211 x RNBL-4351 -7.69** -8.00** -14.81** -4.79* -6.88** -17.22** -3.35 -4.76 -9.72**
11 BM-211 x BM-143 -2.68 -3.33 -10.49** -3.14 -3.75 -14.44** -3.03 -3.40 -11.11**
12 BM-211 x BM-85 -4.44* -6.67** -13.58** -7.55** -8.13** -18.33** -3.01 -3.37 -10.42**
13 BM-3 x RNBL-4351 -7.59** -9.09** -13.58** 0.65 -0.64 -13.33** -6.38* -6.88 -10.76**
14 BM-3 x BM-143 -5.96** -7.79** -12.35** -6.03** -6.33* -17.78** -3.15 -5.43 -9.38**
15 BM-3 x BM-85 -4.38* -7.79** -12.35** -3.49 -3.80 -15.56** -1.29 -2.90 -6.94*
Range Max. Min.
0.67 -7.69
0.67 -9.09
-7.41 -16.67
4.55 -7.55
1.90 -8.13
-10.56 -19.44
2.48 -6.38
0.76 -8.79
-6.60 -13.54
Average -4.31 -5.68 -13.05 -3.04 -4.05 -15.85 -2.26 -4.00 -10.21
ISSN 0975-928X
Table 2 (Continued). Magnitude of Relative Heterosis (RH), Heterobeltiosis (BH) and Standard Heterosis (SH) for plant height, cob length and kernel rows per cob
Sl. No. Hybrids/ crosses Plant height Cob length Kernel rows per cob
RH BH SH RH BH SH RH BH SH
1 BM-421 x RNBL-4351 25.03** 18.11* 4.04 33.06** 33.03** -3.69 6.49 4.59 -11.06**
2 BM-421 x BM-143 46.48** 30.82** 2.48 38.33** 26.05** 10.90 23.38** 22.01** 0.04
3 BM-421 x BM-85 17.57* 10.33 -13.58 45.02** 44.91** 4.86 8.91* 4.90 -7.16
4 BM-256 x RNBL-4351 21.32* 3.76 -8.60 39.52** 37.88** 2.22 11.48** 8.82 -2.82
5 BM-256 x BM-143 28.23** 27.20* -20.38** 22.55** 12.90 -0.66 21.13** 14.94** 2.65
6 BM-256 x BM-85 29.14** 23.42* -15.23* 36.76** 35.02** 0.10 13.29** 12.78** 0.72
7 BM-77 x RNBL-4351 20.84* 2.57 -9.65 32.78** 30.53** -2.18 10.69* 9.52* -6.88
8 BM-77 x BM-143 41.92** 41.76** -12.69 21.68** 12.66 -0.88 13.10** 11.02* -7.59
9 BM-77 x BM-85 53.86** 45.77** 0.11 27.17** 24.88** -6.42 5.09 1.96 -9.76*
10 BM-211 x RNBL-4351 10.30 1.58 -10.52 36.88** 34.67** -2.50 2.53 -4.71 -5.64
11 BM-211 x BM-143 45.97** 33.60** -0.92 20.33** 8.07 -4.92 3.14 -6.68 -7.59
12 BM-211 x BM-85 17.35 13.01 -16.19* 29.11** 27.16** -8.13 1.79 -3.61 -4.56
13 BM-3 x RNBL-4351 19.17* 1.41 -10.67 19.76** 19.61* -13.40* 18.35** 17.18** 1.65
14 BM-3 x BM-143 29.01** 28.75* -20.39** 14.76* 4.48 -8.07 16.44** 12.03 -2.82
15 BM-3 x BM-85 15.58 9.82 -24.57** 31.82** 31.80** -4.78 10.90** 9.80* -2.82
Range Max. Min.
53.86 10.30
45.77 1.41
4.04 -24.57
45.02 14.76
44.91 4.48 to
10.90 -13.40
23.38 1.79
22.01 -6.68
2.65 -11.06
Average 28.12 19.46 -10.45 29.97 25.58 -2.50 11.11 7.64 -4.24
Table 2 (Continued). Magnitude of Relative Heterosis (RH), Heterobeltiosis (BH) and Standard Heterosis (SH) for 100-seed weight, grain protein content and grain yield per plant
Sl. No. Hybrids/ crosses 100-Seed weight Grain protein content Grain yield per plant
RH BH SH RH BH SH RH BH SH
1 BM-421 x RNBL-4351 25.37** 21.89** -9.49** 8.95** 2.70 3.61 91.34** 89.70** -20.86*
2 BM-421 x BM-143 -0.28 -1.85 -28.94** 18.44** 17.54** 4.97 82.43** 71.22** -18.57*
3 BM-421 x BM-85 30.81** 30.61** -8.41** -1.85** -2.94 -11.35** 115.20** 110.94 -8.38
4 BM-256 x RNBL-4351 27.42** 20.08** -10.83** -12.31** -14.10** -13.33** 111.08** 107.17** -11.79
5 BM-256 x BM-143 43.07** 36.44** -1.21 -8.48** -12.65** -15.47** 124.09** 112.36** 0.99
6 BM-256 x BM-85 48.51** 44.04** 0.70 -9.34** -11.89** -14.73** 134.12** 131.81** 0.68
7 BM-77 x RNBL-4351 14.21** 5.39 -7.44* 11.28** 3.39 4.31 85.88** 66.10** -13.48
8 BM-77 x BM-143 31.55** 20.00** 5.39 -2.34** -3.09 -14.77** 97.65** 89.04** -1.52
9 BM-77 x BM-85 20.71** 8.40* -4.80 15.68** 12.68** 2.91 70.96** 56.75** -18.35*
10 BM-211 x RNBL-4351 28.14** 24.83** -2.25 -10.83** -12.63** -11.85** 115.45** 107.25** -8.02
11 BM-211 x BM-143 28.11** 23.29** -3.46 15.82** 10.52** 7.00* 83.88** 77.74** -15.47
12 BM-211 x BM-85 41.13** 33.56** 4.59 -9.36** -11.92** -14.73** 111.62** 109.36** -7.08
13 BM-3 x RNBL-4351 42.75** 41.75** 5.26 -12.54** -14.18 -13.41** 117.09** 106.44** -6.15
14 BM-3 x BM-143 37.57** 36.81** 0.16 9.03** 3.88 0.89 95.44** 91.13** -9.10
15 BM-3 x BM-85 18.23** 15.57** -15.39** -10.25** -12.93** -15.43 77.06** 73.11** -21.30*
Range Max. Min.
48.51 -0.28
44.04 -1.85
5.39 -28.94
18.44 -12.54
17.54 -14.18
7.00 -15.47
134.12 70.96
131.81 56.75
0.99 -21.30
Average 29.15 24.05 -5.07 0.13 -3.04 -6.76 100.89 93.34 -10.56
ISSN 0975-928X
Table 3. Estimates of genetic components of variance and proportional contribution of Lines, Testers and Line x Tester interaction to total variance for different characters
*, ** Significant at 5% and 1% levels, respectively
Table 4. Estimates of general combining ability (gca) effects of parents for grain yield per plant and its component characters
Parents Days to 50%
tasseling
Days to 50% silking
Days to maturity
Plant height Cob length Kernel rows per cob
100-seed weight
Grain protein content
Grain yield per plant
Lines/Females
BM-421 -0.956* 1.178* -1.867 16.444* 1.116** -0.279 -2.619** 0.501** -6.923
BM-256 -0.622 -1.156* -0.311 -8.711 0.522 0.680** 0.322 -0.665** 9.257*
BM-77 1.378** 0.289 1.244 6.178 -0.112 -0.589* 0.694* 0.364** -0.713
BM-211 0.044 -0.489 -0.200 2.521 -0.458 -0.259 1.168** 0.020 0.473
BM-3 0.156 0.178 1.133 -16.432* -1.068* 0.448 0.435 -0.219 -2.093
SE 0.402 0.539 1.175 5.985 0.402 0.243 0.278 0.107 4.389
CD at 5% 0.823 1.104 2.407 12.260 0.824 0.498 0.570 0.219 8.990
Testers/Males
RNBL-4351 0.044 -0.089 -0.933 6.842 -0.240 -0.109 0.030 0.054 -1.931
BM-143 0.311 0.511 -0.200 0.143 0.304 0.181 -0.133 0.282** 2.351
BM-85 -0.356 -0.422 1.133 -6.986 -0.064 -0.073 0.102 -0.335** -0.419
SE 0.311 0.417 0.910 4.636 0.311 0.188 0.26 0.083 3.400
CD at 5% 0.637 0.855 1.865 9.496 0.638 0.385 0.442 0.170 6.964
*, ** Significant at 5% and 1% levels, respectively Days to 50%
tasseling
Days to 50% silking
Days to maturity
Plant height Cob length Kernel rows per cob
100-seed weight Grain protein content
Grain yield per plant
gca 0.0375 -0.1361 0.6088* 33.2963 0.1755* 0.0568* -0.5026 -0.0176 -9.2954
sca 0.8566* 1.3865* -1.4149 126.7094 0.0850 0.0906 5.1895** 0.6068** 43.2128
2gca/ 2gca+sca 0.0805 -0.2443 -6.1713 0.3445 0.8050 0.5563 -0.2402 -0.0616 -0.7550
Narrow sense heritability (%)
5.2976 13.7127 30.8468 22.1407 38.1073 29.7664 22.7569 5.8229 22.5602
Contribution (%)
Lines 44.9415 31.2594 37.1096 45.7421 61.8350 59.1206 38.2888 30.0472 32.7375
Testers 5.2306 7.5765 21.0392 11.0331 5.5127 4.2649 0.2062 11.1446 3.7093
ISSN 0975-928X
Table 5. Estimates of specific combining ability (sca) effects of hybrids for grain yield per plant and its component characters
Crosses Days to 50%
tasseling
Days to 50% silking
Days to
maturity Plant height Cob length
Kernel rows per cob
100-seed weight
Grain protein content
Grain yield per plant
BM-421 x RNBL-4351 0.622 -1.911 0.400 6.138 -1.078 -0.660 1.491** 0.335 -4.409
BM-421 x BM-143 -1.31 1.489 -0.133 9.667 0.872 0.756 -3.179** 0.224 -5.741
BM-421 x BM-85 0.689 0.422 0.533 -15.804 0.206 -0.096 1.689** -0.559** 10.149
BM-256 x RNBL-4351 -0.711 -0.911 -1.289 5.623 0.526 -0.352 -1.784** 0.048 -8.909
BM-256 x BM-143 0.689 0.489 2.644 -11.604 -0.512 0.198 0.773 -0.364 3.269
BM-256 x BM-85 0.022 0.422 -1.356 5.981 -0.014 0.155 1.011* 0.316 5.639
BM-77 x RNBL-4351 1.622* 1.644 0.822 -11.396 0.407 0.293 -1313* 0.532** -1.109
BM-77 x BM-143 -0.311 -0.956 -1.911 -10.866 0.086 -0.107 2.041** -1.333** 9.999
BM-77 x BM-85 -1.311 -0.689 1.089 22.262* -0.493 -0.186 0.728 0.801** -8.891
BM-211 x RNBL-4351 -1.044 -0.244 1.600 -9.509 0.699 0.153 -0.497 0.510* 4.725
BM-211 x BM-143 1.022 0.822 -0.467 16.690 -0.258 -0.437 -0.634 0.878** -9.147
BM-211 x BM-85 0.022 -0.578 -1.133 -7.181 -0.441 0.284 1.131* -0.368 4.423
BM-3 x RNBL-4351 -0.489 1.422 -0.733 9.144 -0.554 0.566 2.103** -0.405* 9.701
BM-3 x BM-143 -0.089 -1.844 -0.133 -3.886 -0.188 -0.410 1.000* 0.594** 1.619
BM-3 x BM-85 0.578 0.422 0.867 -5.258 0.742 -0.156 -3.102** -0.189 -11.321
SE 0.696 0.933 2.036 10.367 0.696 0.421 0.482 0.186 7.601
CD at 5% 1.425 1.912 4.170 21.235 1.427 0.863 0.987 0.380 15.571