V
OLUMEN
O.
7
(2017),
I
SSUEN
O.
06
(J
UNE)
ISSN
2231-5756
A Monthly Double-Blind Peer Reviewed (Refereed/Juried) Open Access International e-Journal - Included in the International Serial Directories Indexed & Listed at:
Ulrich's Periodicals Directory ©, ProQuest, U.S.A., EBSCO Publishing, U.S.A., Cabell’s Directories of Publishing Opportunities, U.S.A., Google Scholar, Open J-Gage, India [link of the same is duly available at Inflibnet of University Grants Commission (U.G.C.)],
Index Copernicus Publishers Panel, Poland with IC Value of 5.09 & number of libraries all around the world.
V
OLUMEN
O.
7
(2017),
I
SSUEN
O.
06
(J
UNE)
ISSN
2231-5756
INTERNATIONAL JOURNAL OF RESEARCH IN COMMERCE, IT & MANAGEMENT
CONTENTS
Sr.
No.
TITLE & NAME OF THE AUTHOR (S)
Page
No.
1
.
PERCEPTIONS OF EXECUTIVE LEVEL EMPLOYEES TOWARDS HRM PRACTICES IN SELECTED PRIVATE
SECTOR BANKS IN PUNJAB
SANJEEV, DR. N S BHALLA, DR. T S SIDHU & SHRUTI
1
2
.
WOMEN PREFERENCE AS A JEWELLERY BUYER: IMPACT OF CELEBRITY ENDORSEMENT
SHAMILY JAGGI & DR. SANJAY KUMAR BAHL
9
3
.
LIQUIDITY AND PROFITABILITY ANALYSIS OF SELECTED STEEL COMPANIES
DR. M. K. JAIN, DR. VIKAS GARG & SHIVRANJAN
14
4
.
A STUDY ON IMPRESSION OF STRESS AND SURVIVING STRATEGIES AMONG THE BANK EMPLOYEES IN
TIRUNELVELI DISTRICT
DR. N. KAMALA & A. ARUNA DEVI
21
5
.
A STUDY OF INTERNET USERS’ ATTITUDE AND PERCEPTION TOWARDS ONLINE SHOPPING
PARVEEN KUMAR GARG & DR. AMANDEEP SINGH
24
6
.
DEFECT ANALYSIS AND PRECLUSION USING QUALITY TOOLS: A CASE STUDY OF ABC COMPANY
DR. SHIKHA GUPTA, DR. K. K. GARG & RADHA YADAV
30
7
.
ECONOMIC EMPOWERMENT OF BODO WOMEN THROUGH SELF-HELP GROUPS IN ASSAM
MAINAO BRAHMA & DR. K. DEVAN
37
8
.
CONSUMER MOTIVES AND INFLUENCING FACTORS IN LIFE INSURANCE BUYING DECISIONS: A STUDY
IN PUNJAB AND CHANDIGARH REGION
NEHA SHRIVASTAVA & DR. RAMINDER PAL SINGH
41
9
.
ROLE OF SOCIAL MEDIA IN CRISIS COMMUNICATION IN THE BUSINESS CONTEXT: A STUDY WITH
INDIAN EXAMPLES
CATHERINE MARY MATHEW
50
10
.
FINANCIAL PERFORMANCE OF INSURANCE INDUSTRY IN ETHIOPIA
DEMIS H GEBREAL, DR. SUJATHA SELVARAJ & DANIEL TOLOSA
53
11
.
NATURE, MAGNITUDE AND DETERMINANTS OF INDEBTEDNESS AMONG WOMEN LABOUR
BENEFICIARY HOUSEHOLDS IN PUNJAB: AN EMPIRICAL ANALYSIS OF MGNREGS
DR. SARBJEET SINGH, DR. RAVITA & TANLEEN KAUR
59
12
.
IMPACT OF GOVERNMENT POLICIES ON ENTREPRENEURSHIP IN MICRO SMALL AND MEDIUM
ENTERPRISES IN INDIA
BISHWAJEET PRAKASH & DR. JAINENDRA KUMAR VERMA
66
13
.
A STUDY OF EMPLOYEE PERCEPTION ON ORGANIZATIONAL CLIMATE AT B.E.L., KOTDWARA
DR. SANTOSH KUMAR GUPTA & ANSHIKA BANSAL
70
14
.
A STUDY OF CORPORATE SOCIAL RESPONSIBILITY PRACTICES IN MAHARATNA PUBLIC SECTOR
ENTERPRISES OF INDIA
DR. MOHD TAQI & DR. MOHD AJMAL
76
15
.
AN EMPIRICAL ANALYSIS OF ARBITRAGE OPPORTUNITIES IN NSE NIFTY FUTURES
DR. SOHELI GHOSE & ROMIT ABHICHANDANI
85
16
.
AN EMPIRICAL STUDY OF DEMONETIZATION IMPACT ON RURAL PUBLIC
DR. D.CH. APPA RAO & DR. CH. BRAHMAIAH
94
17
.
EMOTIONAL INTELLIGENCE AS AN EDUCATIONAL STRATEGY FOR ENHANCEMENT OF EMPLOYABILITY
AFIFA IBRAHIM & MUBASHIR MAJID BABA
97
18
.
DEMONETIZATION & ITS IMPACT ON INDIAN ECONOMY
PRIYANKA SHRIVAS
102
19
.
IMPACT OF DEMONETIZATION ON ENTREPRENEURSHIP
AMANPREET
104
20
.
MEETING ISSUES AND CHALLENGES OF TALENT MANAGEMENT THROUGH SELECT HUMAN RESOURCE
PRACTICES IN SELECT IT COMPANIES OF PUNJAB
JITESH KUMAR PANDEY
107
V
OLUMEN
O.
7
(2017),
I
SSUEN
O.
06
(J
UNE)
ISSN
2231-5756
INTERNATIONAL JOURNAL OF RESEARCH IN COMMERCE, IT & MANAGEMENT
CHIEF PATRON
Prof. (Dr.) K. K. AGGARWAL
Chairman, Malaviya National Institute of Technology, Jaipur
(An institute of National Importance & fully funded by Ministry of Human Resource Development, Government of India)
Chancellor, K. R. Mangalam University, Gurgaon
Chancellor, Lingaya’s University, Faridabad
Founder Vice-Chancellor (1998-2008), Guru Gobind Singh Indraprastha University, Delhi
Ex. Pro Vice-Chancellor, Guru Jambheshwar University, Hisar
FOUNDER PATRON
Late Sh. RAM BHAJAN AGGARWAL
Former State Minister for Home & Tourism, Government of Haryana
Former Vice-President, Dadri Education Society, Charkhi Dadri
Former President, Chinar Syntex Ltd. (Textile Mills), Bhiwani
FORMER CO-ORDINATOR
Dr. S. GARG
Faculty, Shree Ram Institute of Business & Management, Urjani
ADVISOR
Prof. S. L. MAHANDRU
Principal (Retd.), Maharaja Agrasen College, Jagadhri
EDITOR
Dr. R. K. SHARMA
Professor & Dean, Bharti Vidyapeeth University Institute of Management & Research, New Delhi
CO-EDITOR
Dr. BHAVET
Faculty, Shree Ram Institute of Engineering & Technology, Urjani
EDITORIAL ADVISORY BOARD
Dr. S. P. TIWARI
Head, Department of Economics & Rural Development, Dr. Ram Manohar Lohia Avadh University, Faizabad
Dr. CHRISTIAN EHIOBUCHE
Professor of Global Business/Management, Larry L Luing School of Business, Berkeley College, USA
Dr. SIKANDER KUMAR
Chairman, Department of Economics, Himachal Pradesh University, Shimla, Himachal Pradesh
Dr. JOSÉ G. VARGAS-HERNÁNDEZ
Research Professor, University Center for Economic & Managerial Sciences, University of Guadalajara,
Gua-dalajara, Mexico
Dr. M. N. SHARMA
Chairman, M.B.A., Haryana College of Technology & Management, Kaithal
Dr. TEGUH WIDODO
Dean, Faculty of Applied Science, Telkom University, Bandung Technoplex, Jl. Telekomunikasi, Indonesia
Dr. M. S. SENAM RAJU
Professor, School of Management Studies, I.G.N.O.U., New Delhi
Dr. CLIFFORD OBIYO OFURUM
Professor of Accounting & Finance, Faculty of Management Sciences, University of Port Harcourt, Nigeria
Dr. KAUP MOHAMED
V
OLUMEN
O.
7
(2017),
I
SSUEN
O.
06
(J
UNE)
ISSN
2231-5756
INTERNATIONAL JOURNAL OF RESEARCH IN COMMERCE, IT & MANAGEMENT
SUNIL KUMAR KARWASRA
Principal, Aakash College of Education, ChanderKalan, Tohana, Fatehabad
Dr. MIKE AMUHAYA IRAVO
Principal, Jomo Kenyatta University of Agriculture & Tech., Westlands Campus, Nairobi-Kenya
Dr. SYED TABASSUM SULTANA
Principal, Matrusri Institute of Post Graduate Studies, Hyderabad
Dr. NEPOMUCENO TIU
Chief Librarian & Professor, Lyceum of the Philippines University, Laguna, Philippines
Dr. SANJIV MITTAL
Professor & Dean, University School of Management Studies, GGS Indraprastha University, Delhi
Dr. ANA ŠTAMBUK
Head of Department of Statistics, Faculty of Economics, University of Rijeka, Rijeka, Croatia
Dr. RAJENDER GUPTA
Convener, Board of Studies in Economics, University of Jammu, Jammu
Dr. SHIB SHANKAR ROY
Professor, Department of Marketing, University of Rajshahi, Rajshahi, Bangladesh
Dr. ANIL K. SAINI
Professor, Guru Gobind Singh Indraprastha University, Delhi
Dr. SRINIVAS MADISHETTI
Professor, School of Business, Mzumbe University, Tanzania
Dr. NAWAB ALI KHAN
Professor & Dean, Faculty of Commerce, Aligarh Muslim University, Aligarh, U.P.
MUDENDA COLLINS
Head, Operations & Supply Chain, School of Business, The Copperbelt University, Zambia
Dr. EGWAKHE A. JOHNSON
Professor & Director, Babcock Centre for Executive Development, Babcock University, Nigeria
Dr. A. SURYANARAYANA
Professor, Department of Business Management, Osmania University, Hyderabad
Dr. MURAT DARÇIN
Associate Dean, Gendarmerie and Coast Guard Academy, Ankara, Turkey
Dr. ABHAY BANSAL
Head, Department of Information Technology, Amity School of Engg. & Tech., Amity University, Noida
Dr. YOUNOS VAKIL ALROAIA
Head of International Center, DOS in Management, Semnan Branch, Islamic Azad University, Semnan, Iran
WILLIAM NKOMO
Asst. Head of the Department, Faculty of Computing, Botho University, Francistown, Botswana
Dr. JAYASHREE SHANTARAM PATIL (DAKE)
Faculty in Economics, KPB Hinduja College of Commerce, Mumbai
SHASHI KHURANA
Associate Professor, S. M. S. Khalsa Lubana Girls College, Barara, Ambala
Dr. SEOW TA WEEA
Associate Professor, Universiti Tun Hussein Onn Malaysia, Parit Raja, Malaysia
Dr. OKAN VELI ŞAFAKLI
Associate Professor, European University of Lefke, Lefke, Cyprus
Dr. MOHENDER KUMAR GUPTA
Associate Professor, Government College, Hodal
Dr. BORIS MILOVIC
V
OLUMEN
O.
7
(2017),
I
SSUEN
O.
06
(J
UNE)
ISSN
2231-5756
INTERNATIONAL JOURNAL OF RESEARCH IN COMMERCE, IT & MANAGEMENT
Dr. MOHAMMAD TALHA
Associate Professor, Department of Accounting & MIS, College of Industrial Management, King Fahd
Uni-versity of Petroleum & Minerals, Dhahran, Saudi Arabia
Dr. V. SELVAM
Associate Professor, SSL, VIT University, Vellore
Dr. IQBAL THONSE HAWALDAR
Associate Professor, College of Business Administration, Kingdom University, Bahrain
Dr. PARDEEP AHLAWAT
Associate Professor, Institute of Management Studies & Research, Maharshi Dayanand University, Rohtak
Dr. ALEXANDER MOSESOV
Associate Professor, Kazakh-British Technical University (KBTU), Almaty, Kazakhstan
Dr. ASHOK KUMAR CHAUHAN
Reader, Department of Economics, Kurukshetra University, Kurukshetra
YU-BING WANG
Faculty, department of Marketing, Feng Chia University, Taichung, Taiwan
SURJEET SINGH
Faculty, Department of Computer Science, G. M. N. (P.G.) College, Ambala Cantt.
Dr. MELAKE TEWOLDE TECLEGHIORGIS
Faculty, College of Business & Economics, Department of Economics, Asmara, Eritrea
Dr. RAJESH MODI
Faculty, Yanbu Industrial College, Kingdom of Saudi Arabia
Dr. SAMBHAVNA
Faculty, I.I.T.M., Delhi
Dr. THAMPOE MANAGALESWARAN
Faculty, Vavuniya Campus, University of Jaffna, Sri Lanka
Dr. SHIVAKUMAR DEENE
Faculty, Dept. of Commerce, School of Business Studies, Central University of Karnataka, Gulbarga
SURAJ GAUDEL
BBA Program Coordinator, LA GRANDEE International College, Simalchaur - 8, Pokhara, Nepal
FORMER TECHNICAL ADVISOR
AMITA
FINANCIAL ADVISORS
DICKEN GOYAL
Advocate & Tax Adviser, Panchkula
NEENA
Investment Consultant, Chambaghat, Solan, Himachal Pradesh
LEGAL ADVISORS
JITENDER S. CHAHAL
Advocate, Punjab & Haryana High Court, Chandigarh U.T.
CHANDER BHUSHAN SHARMA
Advocate & Consultant, District Courts, Yamunanagar at Jagadhri
SUPERINTENDENT
V
OLUMEN
O.
7
(2017),
I
SSUEN
O.
06
(J
UNE)
ISSN
2231-5756
INTERNATIONAL JOURNAL OF RESEARCH IN COMMERCE, IT & MANAGEMENT
CALL FOR MANUSCRIPTS
We invite unpublished novel, original, empirical and high quality research work pertaining to the recent developments & practices in the areas of Com-puter Science & Applications; Commerce; Business; Finance; Marketing; Human Resource Management; General Management; Banking; Economics; Tourism Administration & Management; Education; Law; Library & Information Science; Defence & Strategic Studies; Electronic Science; Corporate Gov-ernance; Industrial Relations; and emerging paradigms in allied subjects like Accounting; Accounting Information Systems; Accounting Theory & Practice; Auditing; Behavioral Accounting; Behavioral Economics; Corporate Finance; Cost Accounting; Econometrics; Economic Development; Economic History; Financial Institutions & Markets; Financial Services; Fiscal Policy; Government & Non Profit Accounting; Industrial Organization; International Economics & Trade; International Finance; Macro Economics; Micro Economics; Rural Economics; Co-operation; Demography: Development Planning; Development Studies; Applied Economics; Development Economics; Business Economics; Monetary Policy; Public Policy Economics; Real Estate; Regional Economics; Political Science; Continuing Education; Labour Welfare; Philosophy; Psychology; Sociology; Tax Accounting; Advertising & Promotion Management; Management Information Systems (MIS); Business Law; Public Responsibility & Ethics; Communication; Direct Marketing; E-Commerce; Global Business; Health Care Administration; Labour Relations & Human Resource Management; Marketing Research; Marketing Theory & Applications; Non-Profit Or-ganizations; Office Administration/Management; Operations Research/Statistics; Organizational Behavior & Theory; Organizational Development; Pro-duction/Operations; International Relations; Human Rights & Duties; Public Administration; Population Studies; Purchasing/Materials Management; Re-tailing; Sales/Selling; Services; Small Business Entrepreneurship; Strategic Management Policy; Technology/Innovation; Tourism & Hospitality; Transpor-tation Distribution; Algorithms; Artificial Intelligence; Compilers & Translation; Computer Aided Design (CAD); Computer Aided Manufacturing; Computer Graphics; Computer Organization & Architecture; Database Structures & Systems; Discrete Structures; Internet; Management Information Systems; Mod-eling & Simulation; Neural Systems/Neural Networks; Numerical Analysis/Scientific Computing; Object Oriented Programming; Operating Systems; Pro-gramming Languages; Robotics; Symbolic & Formal Logic; Web Design and emerging paradigms in allied subjects.
Anybody can submit the soft copy of unpublished novel; original; empirical and high quality research work/manuscript anytime in M.S. Word format after preparing the same as per our GUIDELINES FOR SUBMISSION; at our email address i.e. [email protected] or online by clicking the link online submission as given on our website (FOR ONLINE SUBMISSION, CLICK HERE).
GUIDELINES FOR SUBMISSION OF MANUSCRIPT
1. COVERING LETTER FOR SUBMISSION:
DATED: _____________
THE EDITOR
IJRCM
Subject: SUBMISSION OF MANUSCRIPT IN THE AREA OF______________________________________________________________.
(e.g. Finance/Mkt./HRM/General Mgt./Engineering/Economics/Computer/IT/ Education/Psychology/Law/Math/other, please specify)
DEAR SIR/MADAM
Please find my submission of manuscript titled ‘___________________________________________’ for likely publication in one of your journals.
I hereby affirm that the contents of this manuscript are original. Furthermore, it has neither been published anywhere in any language fully or partly, nor it is under review for publication elsewhere.
I affirm that all the co-authors of this manuscript have seen the submitted version of the manuscript and have agreed to inclusion of their names as co-authors.
Also, if my/our manuscript is accepted, I agree to comply with the formalities as given on the website of the journal. The Journal has discretion to publish our contribution in any of its journals.
NAME OF CORRESPONDING AUTHOR :
Designation/Post* :
Institution/College/University with full address & Pin Code :
Residential address with Pin Code :
Mobile Number (s) with country ISD code :
Is WhatsApp or Viber active on your above noted Mobile Number (Yes/No) :
Landline Number (s) with country ISD code :
E-mail Address :
Alternate E-mail Address :
Nationality :
* i.e. Alumnus (Male Alumni), Alumna (Female Alumni), Student, Research Scholar (M. Phil), Research Scholar (Ph. D.), JRF, Research Assistant, Assistant Lecturer, Lecturer, Senior Lecturer, Junior Assistant Professor, Assistant Professor, Senior Assistant Professor, Co-ordinator, Reader, Associate Profes-sor, ProfesProfes-sor, Head, Vice-Principal, Dy. Director, Principal, Director, Dean, President, Vice Chancellor, Industry Designation etc. The qualification of
V
OLUMEN
O.
7
(2017),
I
SSUEN
O.
06
(J
UNE)
ISSN
2231-5756
INTERNATIONAL JOURNAL OF RESEARCH IN COMMERCE, IT & MANAGEMENT
NOTES:a) The whole manuscript has to be in ONE MS WORD FILE only, which will start from the covering letter, inside the manuscript. pdf. version is liable to be rejected without any consideration.
b) The sender is required to mention the following in the SUBJECT COLUMNof the mail:
New Manuscript for Review in the area of (e.g. Finance/Marketing/HRM/General Mgt./Engineering/Economics/Computer/IT/ Education/Psychology/Law/Math/other, please specify)
c) There is no need to give any text in the body of the mail, except the cases where the author wishes to give any specific message
w.r.t. to the manuscript.
d) The total size of the file containing the manuscript is expected to be below 1000 KB.
e) Only the Abstract will not be considered for review and the author is required to submit the complete manuscript in the first instance.
f) The journal gives acknowledgement w.r.t. the receipt of every email within twenty-four hours and in case of non-receipt of acknowledgment from the journal, w.r.t. the submission of the manuscript, within two days of its submission, the corresponding author is required to demand for the same by sending a separate mail to the journal.
g) The author (s) name or details should not appear anywhere on the body of the manuscript, except on the covering letter and the cover page of the manuscript, in the manner as mentioned in the guidelines.
2. MANUSCRIPT TITLE: The title of the paper should be typed in bold letters, centeredand fully capitalised.
3. AUTHOR NAME (S) & AFFILIATIONS: Author (s) name, designation, affiliation (s), address, mobile/landline number (s), and email/al-ternate email address should be given underneath the title.
4. ACKNOWLEDGMENTS: Acknowledgements can be given to reviewers, guides, funding institutions, etc., if any.
5. ABSTRACT: Abstract should be in fully Italic printing, ranging between 150 to 300 words. The abstract must be informative and eluci-dating the background, aims, methods, results & conclusion in a SINGLE PARA. Abbreviations must be mentioned in full.
6. KEYWORDS: Abstract must be followed by a list of keywords, subject to the maximum of five. These should be arranged in alphabetic order separated by commas and full stop at the end. All words of the keywords, including the first one should be in small letters, except special words e.g. name of the Countries, abbreviations etc.
7. JEL CODE: Provide the appropriate Journal of Economic Literature Classification System code (s). JEL codes are available at www.aea-web.org/econlit/jelCodes.php. However, mentioning of JEL Code is not mandatory.
8. MANUSCRIPT: Manuscript must be in BRITISH ENGLISH prepared on a standard A4 size PORTRAIT SETTING PAPER. It should be free
from any errors i.e. grammatical, spelling or punctuation. It must be thoroughly edited at your end.
9. HEADINGS: All the headings must be bold-faced, aligned left and fully capitalised. Leave a blank line before each heading.
10. SUB-HEADINGS: All the sub-headings must be bold-faced, aligned left and fully capitalised.
11. MAIN TEXT:
THE MAIN TEXT SHOULD FOLLOW THE FOLLOWING SEQUENCE:
INTRODUCTION REVIEW OF LITERATURE
NEED/IMPORTANCE OF THE STUDY STATEMENT OF THE PROBLEM OBJECTIVES
HYPOTHESIS (ES)
RESEARCH METHODOLOGY RESULTS & DISCUSSION
FINDINGS
RECOMMENDATIONS/SUGGESTIONS
CONCLUSIONS LIMITATIONS
SCOPE FOR FURTHER RESEARCH
REFERENCES
APPENDIX/ANNEXURE
V
OLUMEN
O.
7
(2017),
I
SSUEN
O.
06
(J
UNE)
ISSN
2231-5756
INTERNATIONAL JOURNAL OF RESEARCH IN COMMERCE, IT & MANAGEMENT
12. FIGURES & TABLES: These should be simple, crystal CLEAR, centered, separately numbered & self-explained, and the titles must beabove the table/figure. Sources of data should be mentioned below the table/figure. It should be ensured that the tables/figures are
referred to from the main text.
13. EQUATIONS/FORMULAE: These should be consecutively numbered in parenthesis, left aligned with equation/formulae number placed at the right. The equation editor provided with standard versions of Microsoft Word may be utilised. If any other equation editor is utilised, author must confirm that these equations may be viewed and edited in versions of Microsoft Office that does not have the editor.
14. ACRONYMS: These should not be used in the abstract. The use of acronyms is elsewhere is acceptable. Acronyms should be defined on its first use in each section e.g. Reserve Bank of India (RBI). Acronyms should be redefined on first use in subsequent sections.
15. REFERENCES: The list of all references should be alphabetically arranged. The author (s) should mention only the actually utilised references in the preparation of manuscript and they may follow Harvard Style of Referencing. Also check to ensure that everything that you are including in the reference section is duly cited in the paper. The author (s) are supposed to follow the references as per the following:
•
All works cited in the text (including sources for tables and figures) should be listed alphabetically.•
Use (ed.) for one editor, and (ed.s) for multiple editors.•
When listing two or more works by one author, use --- (20xx), such as after Kohl (1997), use --- (2001), etc., in chronologically ascending order.•
Indicate (opening and closing) page numbers for articles in journals and for chapters in books.•
The title of books and journals should be in italic printing. Double quotation marks are used for titles of journal articles, book chapters, dissertations, reports, working papers, unpublished material, etc.•
For titles in a language other than English, provide an English translation in parenthesis.•
Headers, footers, endnotes and footnotes should not be used in the document. However, you can mention short notes to elucidate some specific point, which may be placed in number orders before the references.PLEASE USE THE FOLLOWING FOR STYLE AND PUNCTUATION IN REFERENCES:
BOOKS
•
Bowersox, Donald J., Closs, David J., (1996), "Logistical Management." Tata McGraw, Hill, New Delhi.•
Hunker, H.L. and A.J. Wright (1963), "Factors of Industrial Location in Ohio" Ohio State University, Nigeria.CONTRIBUTIONS TO BOOKS
•
Sharma T., Kwatra, G. (2008) Effectiveness of Social Advertising: A Study of Selected Campaigns, Corporate Social Responsibility, Edited by David Crowther & Nicholas Capaldi, Ashgate Research Companion to Corporate Social Responsibility, Chapter 15, pp 287-303.JOURNAL AND OTHER ARTICLES
•
Schemenner, R.W., Huber, J.C. and Cook, R.L. (1987), "Geographic Differences and the Location of New Manufacturing Facilities," Jour-nal of Urban Economics, Vol. 21, No. 1, pp. 83-104.CONFERENCE PAPERS
•
Garg, Sambhav (2011): "Business Ethics" Paper presented at the Annual International Conference for the All India Management Asso-ciation, New Delhi, India, 19–23UNPUBLISHED DISSERTATIONS
•
Kumar S. (2011): "Customer Value: A Comparative Study of Rural and Urban Customers," Thesis, Kurukshetra University, Kurukshetra.ONLINE RESOURCES
•
Always indicate the date that the source was accessed, as online resources are frequently updated or removed.WEBSITES
V
OLUMEN
O.
7
(2017),
I
SSUEN
O.
06
(J
UNE)
ISSN
2231-5756
INTERNATIONAL JOURNAL OF RESEARCH IN COMMERCE, IT & MANAGEMENT
DEFECT ANALYSIS AND PRECLUSION USING QUALITY TOOLS: A CASE STUDY OF ABC COMPANY
DR. SHIKHA GUPTA
ASST. PROFESSOR
DEPARTMENT OF COMMERCE
LINGAYA’S LALITA DEVI INSTITUTE OF MANAGEMENT & SCIENCES
NEW DELHI
DR. K. K. GARG
PROFESSOR
DEPARTMENT OF COMMERCE
LINGAYA’S LALITA DEVI INSTITUTE OF MANAGEMENT & SCIENCES
NEW DELHI
RADHA YADAV
ASST. PROFESSOR
DEPARTMENT OF COMMERCE
LINGAYA’S LALITA DEVI INSTITUTE OF MANAGEMENT & SCIENCES
NEW DELHI
ABSTRACT
Quality is the heart of today’s product and service. A customer is ready to pay high for best quality products while a high defect rate dissatisfied the customer and sometimes fling the company out of the market. Unfortunately it’s not always easy to meet the industry and customer quality standards and makes the product hundred per cent defect free. However regular practices of quality tools help the company in early detection of defects and take timely corrective measures to minimize the defect count. The company needs to work continuously for the improvement in the work product to have satisfied customers and survive long run in the market. In this paper we have studied the e-Learning and application development project of ABC Company by means of DMAIC a data-driven quality strategy and quality tools namely Pareto Chart and Fishbone Diagram to identify the root causes of high defect count in the projects. The corrective measures are recommended and implemented in the project gray areas to minimize the defect rates in the process. The detection and prevention of defects using quality tools has shown that involvement of entire project team, and cautious continuous practice of quality tools help the company to achieve its target and lead towards progressive improvement in its work process.
KEYWORDS
DMAIC, defects, fishbone diagram, pareto chart, quality tools.
1. INTRODUCTION
or any customer, the key element they look for in the deliverable is ‘its quality’, which in layman’s terms is ‘the deliverable does what it is supposed to do and does not do what it is not supposed to do’. It should work correctly and accurately always without any errors / wrong results. Defects are anything that results in customer dissatisfaction.
In the IT world, new technologies bring along new challenges for the development team in terms of learning curve, new features, functionalities and tools usage. Due to this learning curve, more mistakes do happen impacting the deliverable quality. So, the objective of this project is to showcase a methodology which will help to speed up the learning curve for such new technologies which results in better quality products earlier in the lifecycle of the said technology. The company should make it a point to delight their customers by fulfilling their expectations. To help this cause, Six Sigma plays a very critical role as it lays a lot of emphasis on “Quality must become a part of the culture”
1.1 SIX SIGMA
The Six Sigma expert uses qualitative and quantitative techniques to drive process improvement. Although the tools, themselves, are not unique, the way they are applied and integrated as part of a system. Six Sigma professionals do not always agree as to exactly which tools constitute the set. Some of the statistical and graphical tools commonly used in improvement projects are listed below.
I. DEFINING A PROBLEM, IMPROVEMENT OPPORTUNITY, OR REQUIREMENTS
Project charter to define the focus, scope, direction, and motivation for the improvement team
Voice of the customer to understand feedback from current and future customers indicating offerings that satisfy, delight, and dissatisfy them
Value stream map to provide an overview of an entire process, starting and finishing at the customer, and analyzing what is required to meet customer needs
II. MEASURING PROCESS PERFORMANCE
Process map for recording the activities performed as part of a process Capability analysis to assess the ability of a process to meet specifications Pareto chart to analyze the frequency of problems or causes
III. ANALYZING PROCESSES TO DETERMINE ROOT CAUSES OF VARIATION, DEFECTS, OR POOR PERFORMANCE
Root cause analysis to uncover causes
Failure mode and effects analysis for identifying possible product, service, and process failures Multi-vari chart to detect different types of variation within a process
IV. IMPROVING PROCESS PERFORMANCE BY ADDRESSING ROOT CAUSES
Design of experiments (DOE) helps to solve problems from complex processes or systems where there are many factors influencing the outcome and where it is impossible to isolate one factor or variable from the others. Kaizen event to introduce rapid change by focusing on a narrow project and using the ideas and motivation of the people who do the work
V. CONTROLLING THE IMPROVED PROCESS AND FUTURE PERFORMANCE
Control plan to document what is needed to keep an improved process at its current level Statistical process control (SPC) for monitoring process behaviour 5S to create a workplace suited for visual control Mistake proofing (poka-yoke) to make errors impossible or immediately detectable. Additionally, Six Sigma team leaders often use project management tools such as Gantt charts and team engagement tools like brainstorming and nominal group technique.
V
OLUMEN
O.
7
(2017),
I
SSUEN
O.
06
(J
UNE)
ISSN
2231-5756
INTERNATIONAL JOURNAL OF RESEARCH IN COMMERCE, IT & MANAGEMENT
1.2 SEVEN QUALITY TOOLS FOR CONTINUOUS QUALITY IMPROVEMENT
Quality is the demand of today’s customer. They are ready to lose their pockets for getting an assured quality product. Best quality product stands alone in the highly competitive market and need no further marketing by the company, for example Apple company products. Quality is the core feature of any product or process that makes the product unique. To lead and beat the cut throat market competition the companies are required to continuously work towards quality improvement of its company products and processes.
To match the quality standards of the industry the quality engineers are relying over the fundamental seven quality control tools proposed by the Kaoru Ishikawa, professor of engineering at Tokyo University and the father of “quality circles”. These have been described as the magnificent seven by Wadsworth et al. The Q-7 tools are summarised below as:-
(i) Histograms
(ii) Scatter diagram
(iii) Stratification
(iv) Pareto Analysis
(v) Check-sheets
(vi) Cause and Effect diagram
(vii) Control charts
The above mentioned seven basic quality tools used by the organizations to provide information about problems in the organization assisting to derive solutions for the same. The detailed discussion of the seven basic quality tools in brief.
Histogram The development of histogram also termed as bar graph is attributed to a French statistician A.M. Guerry in 1833. It represents variation in sets of data through bar charts, thus demonstrating “distribution” in the level of variation. It is characterized by three constituents a centre (mean), a width (spread) and overall shape. Histogram is used for illustrating the frequency and the extent in the context of two variables. Histogram is a chart with columns. This represents the distribution by mean. If the histogram is normal, the graph takes the shape of a bell curve. If it is not normal, it may take different shapes based on the condition of the distribution. There are vvarious types of histograms are possible and their interpretations (see table A1).
Scatter Diagrams The scatter diagram was developed so that intuitive and qualitative conclusions could be drawn about the paired data or variables. A scatter diagram is composed of a horizontal axis containing the measured values of one variable (independent, i.e. cause) and a vertical axis, representing the measure-ments of the other variable (dependent, i.e. effect). These diagrams provide a way to study the relationship of one variable with another which is useful for specific requirements such as product design, such as the percentage of an ingredient in an alloy, or the number of employees’ errors and overtime worked. The resulting scatter diagram could, for example, provide useful information for material selection for design purpose. It is used as a part of investigation of relationships between variables, which is an important part of the quality management. So it is used under following circumstances as:
(a) Validating “hunches” about a cause-and-effect relationship between types of variables.
(b) Displaying the direction of the relationship (positive, negative etc.)
(c) Displaying the strength of the relationship.
Stratification Interpreting data can be a creative process. There are always instances of data which seem to define a rational explanation. Office equipments which work perfectly well one day may not work at all, the next day. Often, a suitable stratification will be obvious to the people who have experience with a product, process and materials and situations. So, stratifications are a method of analysis of data by grouping it in different ways. The steps are as follows:
(i) Collect data about any problem in product/detects, etc.
(ii) Consider potentially significant way of significant way of grouping data (stratification) on basis of factors experienced. (iii) Repeat data through graphic manner reflecting stratification.
(iv) Analyse results and try new grouping, if necessary, to get insight into the problem and make evident the correlation.
Pareto Analysis Pareto Analysisis named after Vilfredo Pareto -an Italian economist.It is a prioritization technique that identifies the most significant items among many. This technique implies that about 80% of the problems or effects are produced by about 20% of the causes. Pareto Chart is used analyse data relating to a problem in such a way as to highlight the most significant areas, inputs or issues. Pareto Analysis often reveals that a small number of failures are responsible for the bulk of quality costs, a phenomenon called the ‘Pareto Principle.’ This pattern is also called the ‘80/20’ rule. A Pareto Chart is a series of bars whose heights reflect the frequency or impact of problems. The bars are arranged in descending order of height from left to right. This bar chart is used to separate the “vital few” from the “trivial many”.
The procedure for performing a Pareto analysis consists of the following eight steps: 1. Define the activity or system of interest.
2. Define the specific risk-related factors of merit. 3. Sub-divide the activity or system for analysis.
4. Determine which elements of the activity or system lead to the problems of interest.
5. Collect and organize relevant risk data for elements o the activity or system.
6. Plot the data on Pareto charts.
7. Further subdivide the elements of the activity or system (if necessary).
8. Use the results in decision making.
ADVANTAGES OF PARETO ANALYSIS
1. Breaks a big problem down into smaller pieces. 2. Identifies the most significant factors.
3. Shows where to focus efforts & allows better use of limited resources. 4. Helps to separate the few major problems from the many possible problems.
Check-Sheets A Check sheet is an aid used in assembling and compiling data concerning a problem. It is used to collect data on a process in order to determine whether any unusual or unwanted elements are present. The functions of a Check sheet are Production process distribution check, Defective item check, Defect location check, Defect cause check.It is a tool for recording direct observations and helping to accumulate facts in the process. The data to be recorded can base on attributes (Go or no-go situations, binary classification like right or wrong, present or absent, i.e. discrete countable data.) or variables: (Data from measurement collectable on a continuous scale, e.g. diameter of a piston, tensile strength of a piece of rod, etc.)
According to the type of data to be collected, check sheets are designed. In-addition to a variable check sheet and attribute check sheet, there can be defect location sheet or measles chart. On a process flowchart or engineering drawing are marked errors, defects and problems. Accumulation of crosses or other marks on the document indicates as to where the major or most frequent occurring defects can be found.
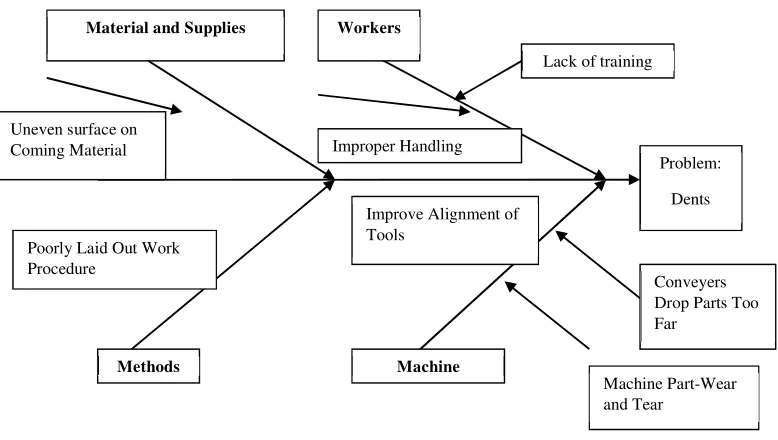
Fishbone Diagram The fishbone diagram (see fig 1) is also known as a "cause and effect diagram." A fishbone diagram is a structured tool for brainstorming. This cause-and-effect diagram methodology is crafted to aid organizational teams identify potential causes for a described issue. Some people refer to this tool as Ishikawa diagram, named after its developer. The name fishbone originates from the diagram’s fishbone appearance.
With a fishbone brainstorming approach, the session is conducted around categories of causes such as Methods, People, Machines, Equipment, Materials, Envi-ronment and Management. To start the process, the team should state the problem. This statement is then followed by brainstorming for root causes to the issue around the chosen categories.
V
OLUMEN
O.
7
(2017),
I
SSUEN
O.
06
(J
UNE)
ISSN
2231-5756
INTERNATIONAL JOURNAL OF RESEARCH IN COMMERCE, IT & MANAGEMENT
Control Charts The backbone of Statistical Process Control (SPC) is control charts, these were first proposed by Walter Shewhart in 1924. This gives a clear visual display that quickly tells when a process is “out of control”. Control charts are important and display the result of statistical process control measures which depict whether product samples conform to specified limits or tolerances. A control chart displays a central horizontal line usually corresponds to the average value of the quality characteristics being measured. Two other horizontal lines represent the upper and lower control limits.
The mentioned 7-QC tools are in practice by the organization in order to enhance the efficiency. The staff should be trained during the orientation program about the implication of adaption of quality control tools.
2.
PRACTICES OF DETECTION AND CORRECTION OF DEFECTS AT ABC COMPANY*
ABC Company offers innovative, efficient and customized solutions around curriculum and media development, assessments, engineering and big data. They exist to help their partners and customers understand, create and improve the learning process and the content, products, systems and data that shape and support it. ABC Company’s exclusive commitment to the education industry has strengthened position as an intuitive, informed development partner for the industry’s most cutting-edge solutions and has provided the platform to develop tools and processes precisely engineered for education.
2.1 SERVICE LINES OF ABC COMPANY
1. Content Projects Project deals with development of e-Learning courses for various high schools. This e-Learning course will help student to understand the topic better and will make studies interesting for them.
2. Porting Projects This is porting project i.e. porting from one LMS to other or converting an e-Learning course from FLASH to HTML 5. To match up with upgrading and new technology.
3. Application Development Projects These projects are building frameworks that map use cases, requirements and specifications to processes, technologies, and standards that integrate your systems and optimize your investments.
2.2 STATEMENT OF THE PROBLEM
A defect in work products hamper their quality and stop them from normal functioning. Therefore the scope of this paper is to identify the defects in the work product and minimize it.
Below are the steps for conducting defect prevention:
(i) Identify the defects
(ii) Categorize the defects e.g. Functional, Logical, GUI etc. (iii) Once categorization is completed create a Pareto chart.
(iv) Pareto chart helps in understanding which 20% defects are causing 80% of problems.
(v) Then after identifying those defects create a Fishbone diagram by doing brainstorming on it.
(vi) Fishbone diagram will help us to understand the root cause of those defects. (vii) After doing the root cause analysis take actions to fix them.
2.3 METHODS
In this paper the two sample projects are considered namely E-Learning i.e. Content and another application development. i.e. Development. The defects of these projects are identified, analyzed and its causes will be identified.
To identify the defects and errors, the DMAIC a data-driven quality strategy is used to improve processes. The DMAIC is an integral part of a Six Sigma initiative, but in general can be implemented as a standalone quality improvement procedure or as part of other process improvement initiatives such as lean. DMAIC is an ellipsis for five interconnected phases named as Define, Measure, Analyze, Improve, and Control.
THE DMAIC METHODOLOGY APPROACH a) Define
• The main objective of this stage is to outline the borders of the project.
• Stakeholders agree on the parameters that will define the project
• Scope and budgetary items, as well as customer needs, are aligned with project goals
• Team development takes place as the project begins to take shape
b) Measure
• The main objective is to collect data pertinent to the scope of the project.
• Leaders collect reliable baseline data to compare against future results
• Teams create a detailed map of all interrelated business processes to elucidate areas of possible performance enhancement
c) Analyze
• The main objective is to reveal the root cause of business inefficiencies.
• Analysis of data reveals areas where the implementation of change can provide the most effective results
• Groups discuss ways that the data underscores areas ripe for improvement
d) Improve
• The main objective at the end of this stage is to complete a test run of a change that is to be widely implemented.
• Teams and stakeholders devise methods to address the process deficiencies uncovered during the data analysis process
• Groups finalize and test a change that is aimed at mitigating the ineffective process
• Improvements are ongoing and include feedback analysis and stakeholder participation
e) Control
• The objective of the last stage of the methodology is to develop metrics that help leaders monitor and document continued success.
• Six Sigma strategies are adaptive and on-going.
• Adjustments can be made and new changes may be implemented as a result of the completion of this first cycle of the process.
At the end of the cycle, additional processes are either addressed or the initial project is completed.
2.4 PROJECT DESCRIPTION
The projects under study are content project and development project. The detail description of the projects is mentioned as follows.
a) Content Project:
Company will update the design PPT as per the UI related changes that have been mentioned in the document. Company will share the updated design PPT with client for their review and approval.
Company will implement the feedback received from client and will share the updated designs for approval. Company will create HTML5 mockups as per the designs approved by client.
There would be a maximum of two rounds of review iterations from client.
Client will provide “sample” content per each new template while creating the HTML mock-ups. HTML Mockups would be reviewed and approved by client team.
Once the designs and HTML5 mockups gets approved by client team, Company would proceed with the development phase. Company to create ICE document with the sample content that will be provided by client for ICE Authoring.
V
OLUMEN
O.
7
(2017),
I
SSUEN
O.
06
(J
UNE)
ISSN
2231-5756
INTERNATIONAL JOURNAL OF RESEARCH IN COMMERCE, IT & MANAGEMENT
Company will test all the HTML5 ICE templates on the browsers & devices mentioned in the section 3.3.1.1 of this document. Company would deliver the updated ICE templates to Client for review & approval after complete development & QA.b) Development Project
Convert the course from one LMS format to another Develop the course from Scratch from Manuscripts Create Test bank quizzes from Word/PDF/PPT files
2.5 METRICS
Metrics are parameters or measures of quantitative assessment used for measurement, comparison or to track performance or production. A performance met-ric is that which determines an organization's behaviour and performance. Performance metmet-rics measure an organization's activities and performance. It should support a range of stakeholder needs from customers, shareholders to employees. Every organization should have SMART Metric goals i.e. specific, measurable, attainable, realistic, and timely.
2.6 GAPS IDENTIFIED IN THE PROJECT
Data of Content & Publishing projects are analyzed which has received quite a lot defects from client from past few months. Data is collected from the project and root cause analysis is done to find out the actual cause for the rise in defect count in past few months. This analysis is done with help of QC tools for deep & better understanding.
Few basic metrics set for the projects are defect density. Defect Density is the number of confirmed defects detected in software/component during a defined period of development/operation divided by the size of the software/component. The 'defects' are: confirmed and agreed upon (not just reported). Dropped defects are not counted.
At the start of the project we need to decide on target of defect density. The target is based on historical data i.e. passes project or it can also be an organization target. As the project progress the target may get change based on the results of the metrics. The target we have identified for the Content and Development project is based an organization target as 0.05 (0.05 means 5 defects per 100 assets/screens).
2.7 RESULTS- DEFECT ANALYSIS AND METRIC CALCULATION
Every organization strives to have lowest possible defects in its work process. To meet the target of six sigma 0.05 defects per unit is a great challenge for an organization. In this context the defect analysis of content project and development project of ABC company are discussed in detail as follows:
2.7.1 E-LEARNING PROJECT
Metrics calculation for Development project
During the metric calculation for Content Project, we found 100 numbers of defects in 1500 assets. The defect density is measured as 0.067 defects per unit. The defect parentage is higher than the target defect density i.e. 0.05 defects per unit.
No of defects found in project = 100 defects
Size = 1500 Assets
Defect density = 100/1500
Defect density = 0.067 defects/unit
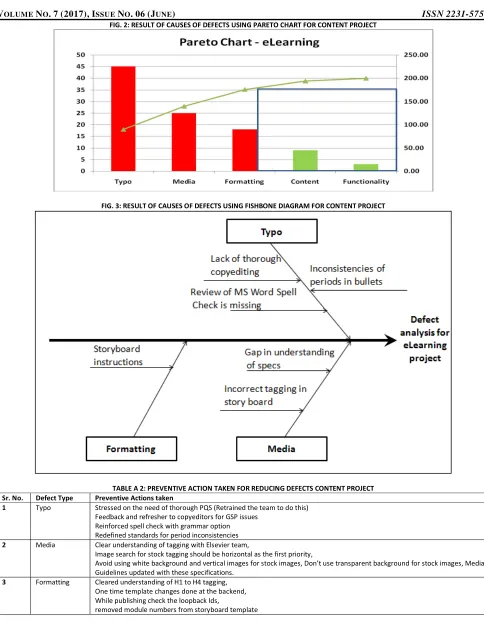
The aim of the study is to bring down the defects as low as of Six Sigma standards 0.05 defects per unit. The result reveals that the defect density is not up to the set standards hence there is a need to identify why we were not able to meet our target through defect analysis. We have used Pareto chart to identify cause of defects. As per the Pareto chart analysis we have identified that Typo, Media, Formatting, content and functionality are the important causes of defects. Out of this typo, media and formatting are the major causes responsible for 80 per cent of the defects (see fig. 2) while content and functionality are responsible for 20 per cent defects in content project. The fishbone diagram (see fig 3) depicts that lack of thorough copy editing, missing of spell check function while review of MS Word Spell Check, inconsistencies of periods in bullets hamper the typo element of e-learning content. The incorrect tagging in storyboard and gap in understand-ing of specs are the causes resulted in media related issues in the e learnunderstand-ing content of the company. The research also pointed out that the poor and shortened storyboard instructions are responsible for poor formatting of e-learning contents project under the study.
Action taken for Improvement in Content project
In the company we have taken certain necessary preventive actions in the gray areas to reduce rate of defects in the content project of the company (see table. A2).
It is advised that to improve the typo related errors the company need to retrain the project team so that they should focus over the need of through PQS. Feedback, reinforcement of spell check with grammar checking and by redefining the standards for period inconsistency the project team can minimize the typo errors.
To improve the media of the content project, the company was informed to clear the understanding of tagging with Elsevier team. The image search for stock tagging was made horizontal. It was strongly recommended to avoid the use of white or transparent background and vertical images for stock images. To improve the formatting errors, we have worked towards having clear understanding of H1 to H4 tagging. While publishing the content the team need to check the loopback Ids, removed module numbers from storyboard template. The team should see that only one time template changes are done at the backend.
2.7.2 DEVELOPMENT PROJECT
Metrics calculation for Development project
During the metric calculation for Development project, we found 50 numbers of defects in 600 assets. The defect density is measured as 0.077 defects per unit. The defect parentage is higher than the target defect density i.e. 0.05 defects per unit.
No of defects found in project = 50 defects
Size = 600 Assets
Defect density = 50/600
Defect density = 0.077 defects/unit
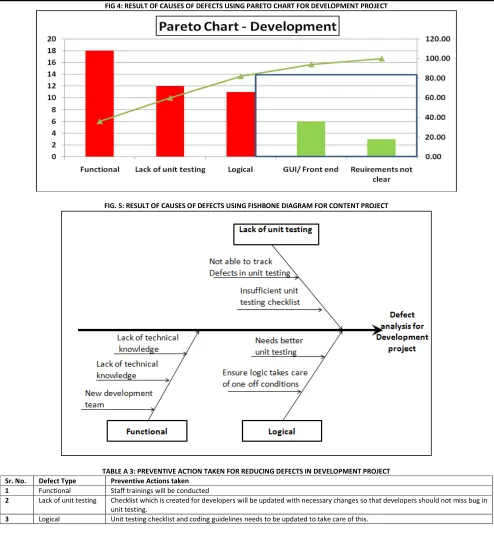
To meet our objective to bring down the defects as low as to 0.05 defects per unit, we need to do defect analysis, to identify the root causes behind high defect rates. For finding the true causes of defect, the Pareto chart and fishbone diagram are used. As per the Pareto chart analysis we have identified that functional, lack of unit testing, logical, GUI/Front End, and unclear recruitments are the key causes of defects (see fig.4). It was found that functional, lack of unit testing and logical are the foremost causes accountable for 80 per cent of the defects (see fig.4) while GUI/Front End and unclear recruitments are responsible for only 20 per cent defects in content project. The fishbone diagram (see fig.5) depicts that lack of technical knowledge and new development team impede the functional aspect of development project under the study. The causes not able to trace the defects in unit testing, and having insufficient unit testing checklist are found responsible for lack of unit testing. The poor unit testing and ensure logic takes care of one off conditions are the causes behind the logical aspect of high defects in the development project of the company.
V
OLUMEN
O.
7
(2017),
I
SSUEN
O.
06
(J
UNE)
ISSN
2231-5756
INTERNATIONAL JOURNAL OF RESEARCH IN COMMERCE, IT & MANAGEMENT
Action taken for Improvement in Development project
The certain necessary preventive actions are taken in the priority areas to reduce rate of defects in the development project of the company (see table. A3). It is recommend that to overcome the functional related fault the company needs to provide adequate training sessions for the project team. To improve the unit testing the updated unit testing checklist is provided to the developers for tracing the defects timely and effectively. To improve the logical element of the devel-opment project the company is said to update the coding guidelines.
3. CONCLUSION
The quality tool helps us in achieving customer satisfaction and bug free product but if they are not used properly it will not lead to any improvement. The use of tools should be appropriate and correct to improve the quality of the product. The projects under study have received high defect count from customer and were not able to meet the organization goal. After applying quality tool Pareto Chart we came to know which defect category had highest defect count. The root causes of the defects where identified using Fishbone diagram and to decide action needs to be taken. This should be done with involvement of entire team so that they come up to some solution to avoid these defects. After successfully implementing the actions it was decided that the activity should be repeated again to see whether we successful in meeting the target or do we need to take any more actions or measures. Once the team meet the goal it can reset their goal so that the team can make the process more stringent and defect free. By doing this the company can achieve its target of delivering a “Bug Free” product to its customer and gain customer satisfaction. Hence it is advised that quality tools should be utilized cautiously so that the results help the quality team to achieve its target and lead towards continuous improvement in its products and services.
4. REFERENCES
1. Defect Prevention by SEI’s CMM Model (2016). Retrieved from http://www.dfs.mil/technology/pal/cmm/vl/dp
2. Linda Westfall, Defect Density (2016). Retrieved from http://www.westfallteam.com/Papers/defect_density.pdf
3. Megan Graham, Software Defect Prevention using Orthogonal Defect Prevention (2016). Retrieved from http://twinspin.cs.umn.edufiles/ODC_TwinSPIN
4. Project Metrics (2016). Retrieved from https://www.infoq.com/articles/project-metrics
5. Project Smart (2016). Retrieved from https://www.projectsmart.co.uk/smart-goals.php
6. Quality Assurance Alternatives and Techniques (2016). Retrieved from http://asq.org/pub/sqp/past/vol3_issue3/tian.html
7. Seven Basic Quality Tools (2016). Retrieved from http://asq.org/learn-about-quality/seven-basic-quality-tools/overview/overview.html
8. Tiejun, P., Leina, Z., & Chengbin, F. (2008). Defect Tracing System Based on Orthogonal Defect Classification. Computer Engineering and Applications, vol 43, PP 10, May 2008.
ANNEXURE
TABLE A 1: TYPES OF HISTOGRAMS Shape Description
Bell-shaped Symmetrical shape with a peak in middle representing a normal distribution.
Double-peaked Two normal distributions with two peaks in middle indicating more than one distribution at work.
Comb Alternative peaks showing possible errors in data collection and analysis.
Skewed An asymmetrical shape-positively or negatively skewed- usually reflecting limit in the specification on one side.
Truncated An asymmetrical shape with a peak at the end. Usually being a part of a normal distribution with part of it having been removed.
Isolated peak Two normal distributions suggesting two processes taking place at the same time.
Edged peak A normal distribution curve with a large peak at one end indication errors in data recording.
FIG. 1: DIAGRAM OF FISHBONE QUALITY TOOL
Material and Supplies Workers
Problem:
Dents
Machine Methods
Lack of training
Improper Handling Uneven surface on
Coming Material
Poorly Laid Out Work Procedure
Improve Alignment of Tools
Conveyers Drop Parts Too Far
V
OLUMEN
O.
7
(2017),
I
SSUEN
O.
06
(J
UNE)
ISSN
2231-5756
INTERNATIONAL JOURNAL OF RESEARCH IN COMMERCE, IT & MANAGEMENT
FIG. 2: RESULT OF CAUSES OF DEFECTS USING PARETO CHART FOR CONTENT PROJECT
FIG. 3: RESULT OF CAUSES OF DEFECTS USING FISHBONE DIAGRAM FOR CONTENT PROJECT
TABLE A 2: PREVENTIVE ACTION TAKEN FOR REDUCING DEFECTS CONTENT PROJECT Sr. No. Defect Type Preventive Actions taken
1 Typo Stressed on the need of thorough PQS (Retrained the team to do this)
Feedback and refresher to copyeditors for GSP issues Reinforced spell check with grammar option Redefined standards for period inconsistencies
2 Media Clear understanding of tagging with Elsevier team,
Image search for stock tagging should be horizontal as the first priority,
Avoid using white background and vertical images for stock images, Don’t use transparent background for stock images, Media Guidelines updated with these specifications.
3 Formatting Cleared understanding of H1 to H4 tagging,
One time template changes done at the backend, While publishing check the loopback Ids,
V
OLUMEN
O.
7
(2017),
I
SSUEN
O.
06
(J
UNE)
ISSN
2231-5756
INTERNATIONAL JOURNAL OF RESEARCH IN COMMERCE, IT & MANAGEMENT
FIG 4: RESULT OF CAUSES OF DEFECTS USING PARETO CHART FOR DEVELOPMENT PROJECT
FIG. 5: RESULT OF CAUSES OF DEFECTS USING FISHBONE DIAGRAM FOR CONTENT PROJECT
TABLE A 3: PREVENTIVE ACTION TAKEN FOR REDUCING DEFECTS IN DEVELOPMENT PROJECT Sr. No. Defect Type Preventive Actions taken
1 Functional Staff trainings will be conducted
2 Lack of unit testing Checklist which is created for developers will be updated with necessary changes so that developers should not miss bug in
unit testing.
3 Logical Unit testing checklist and coding guidelines needs to be updated to take care of this.