The University of San Francisco
USF Scholarship: a digital repository @ Gleeson Library |
Geschke Center
Master's Theses Theses, Dissertations, Capstones and Projects
Spring 5-16-2014
FDI and Technical Efficiency in Manufacturing
Firms: A Stochastic Frontier Approach
Yue Zhou
Follow this and additional works at:https://repository.usfca.edu/thes
Part of theEconomics Commons
This Thesis is brought to you for free and open access by the Theses, Dissertations, Capstones and Projects at USF Scholarship: a digital repository @ Gleeson Library | Geschke Center. It has been accepted for inclusion in Master's Theses by an authorized administrator of USF Scholarship: a digital repository @ Gleeson Library | Geschke Center. For more information, please [email protected].
Recommended Citation
Zhou, Yue, "FDI and Technical Efficiency in Manufacturing Firms: A Stochastic Frontier Approach" (2014).Master's Theses. 95.
FDI and Technical Efficiency in Manufacturing
Firms: A Stochastic Frontier Approach
Master’s Thesis
International and Development Economics
Key Words: FDI, technical efficiency, stochastic frontier model Yue Zhou
Department of Economics University of San Francisco
2130 Fulton St. San Francisco, CA 94117 e-mail: [email protected]
May 2014
Abstract: In this paper, firm-level data from manufacturing sector in five African countries is obtained to estimate the impact of foreign direct investment (FDI) on firm’s technical efficiency. Unbalanced panel data over period of 1991-2003 shows that the existence of FDI has a significant impact on domestic firms’ technical efficiency. The results remain robust after controlling for country and year fixed effect. Other determinants of technical efficiency are investigated as well and the results show that firm size and export behavior increases efficiency while firm age lowers efficiency.
1
1.
INTRODUCTION
The contribution of foreign direct investment (FDI) to the developing economies has been examined by a large body of theoretical and empirical studies. In general, it is agreed that FDI inflows lead to an increased rate of economic growth (Blonigen, 2005). A major growth-enhancing characteristic of FDI is the advanced technology that often accompanies foreign capital investment and transferred through spillover effects (Wijeweera, et al., 2010). Although it is widely accepted by many policy makers and academics that FDI can have important spillover effects on a host country’s development effort, the empirical results for FDI generating positive spillovers for host countries is still mixed. Some empirical studies using panel data confirm that FDI generates positive spillovers (Chuang and Hsu, 2004; Javorcik, 2004; Gorg and Strobl, 2005; Kugler, 2006; Liang, 2007), while some studies provide no evidence (Haddad and Harrison, 1993; Kathuria, 2000; Konings, 2001) or even negative evidence (Aitken and Harrison, 1999; Djankov and Hoekman, 2000; Thangavelu and Pattnayak, 2006) (see also Salim and Suyanto, 2013)
Specifically, Lumbila (2005) find that FDI brings fresh capital and it may allow the economy to take advantages from new cutting edge technological processes and management methods. However, the impact of FDI is also constrained due to the limited absorptive capability (trained workers, basic infrastructure network, and macroeconomic performance). And he believes that FDI is a key factor for many countries trapped into poverty because of the technological spillover effect it involves. Similarly, Andreas (2006) reports that FDI inflows enhance economic growth in developing countries by improving domestic firms’ technology and productivity through technological spillovers and inflows of physical capital. And he also argues that the positive spillover effect only occurred in the developing economies, not for the developed ones.
Using cross-section data, Alfaro (2003) shows that FDI only generates positive effects in the manufacturing sector. The spillover effects is negative for the primary sector and is ambiguous in the service sector. However, he fails to recognize which sector in which country had negative growth under the assistance of FDI.
2
technology transfer from foreign countries is not necessarily equivalent to productivity growth. It is also important to explore whether the transferred technology can be utilized efficiently in domestic countries, which can be affected greatly by a vector of country characteristics.
In this paper, we take the approach of stochastic frontier model to analyze whether the existence of FDI contributes to country/firm level technical efficiency. Two components are generally considered in the productivity growth: (i) technical efficiency and (ii) technical progress. Technical efficiency is defined as the potential maximum output obtained based on a vector of production inputs. It refers to the efficiency achieved (or not) towards the production frontier. On the other hand, technical progress leads to an outward shift of the production frontier (Wang & Wong, 2012). Solow (1957) explains two source of growth rate, an increase in the production inputs and an increase in productivity - “technical change”, which is measured by the residual from production model. However there is no distinguish between technical efficiency and technical change and it is also assumed that all countries are perfectly efficient on their production frontier, which could be seen as a potential caveat.
Since technical efficiency varies across both countries and firms, we take the approach of stochastic frontier analysis used by Battese and Coelli (1995) and Wang & Wong (2012) as well. The estimation of inefficiency is the deviation from the actual production to the potential achievable output given a panel dataset. One major advantage of using this approach is that we no longer assume each country/firm is perfectly efficient. Thus we are able to understand the factors that affect the technical efficiency level.
So far theoretical and empirical works adopting the stochastic frontier analysis mainly focus on the relationship between FDI and country technical efficiency. For instance, Iyer et al. (2004) use this approach to examine the spillover effects of FDI for 20 OECD countries. Wijeweera, Villano and Dollery (2010) adopt the same framework to study the relationship between FDI and growth rate in 45 OECD countries. Nourzad (2008) employs the translog form of production frontier to estimate the technical inefficiency factors which can be specified in a conditional mean function.
3
presence of the former increases the inefficiency of the latter. Based on a panel data of 666 manufacturing firms, Sinan, Jones and Mygind (2007) find that foreign ownership, firm size and higher labor quality enhance firm efficiency. Using cross-section data, Seethamma, Natarajan and Rajesh Raj (2007)’s estimate find that unorganized manufacturing firms are not using resources and technology efficiently, thus are operating at 48 percent of their potential output level on average.
These existed empirical works present two main characteristics. First is the small sample size and low diversity. Salim and Suyanto (2013) include 210 firms in their sample from pharmaceutical sector. Ghali and Rezgui (2006)’s result only explains how FDI affect domestic firms efficiency within Tunisia. Small sample size are often not representative. Second is the short time period over which firms are observed. Seethamma, Natarajan and Rajesh Raj (2007)’s sample period is between 2000 and 2001. Collier et al. (2000) examine the relationship between export and efficiency using a four year period sample. Confidence in the reliability of general findings is undermined by the two facts stated above. In this paper, we attempt to contribute to the existing literature by employing data from four African countries over time period of 1991-2003, which consists 1439 firms in five sub-sectors of manufacturing. The long time period and diversified sample enable us to confront the difficulties, as well as to observe the firms’ technical efficiency over time.
Previous literatures mainly focus on the role of FDI or export itself as a determinant of efficiency level. Smith, Cin and Vodopivec (1997) find that foreign ownership improves firm performance most in Slovenia, which is consistent with the finding of Sinan, Jones and Mygind (2007) that foreign ownership produces the highest levels of efficiency compared to other ownership forms. Collier et al. (2000) investigate the relationship between export and firm level efficiency and confirm the learning-by-exporting effect. They point out that the most efficient firms are self-selected into exporting. For the firms with exporting history, an additional year of exporting raises efficiency in the next period controlling for other factors by 10% (Collier et al., 2000). This gives us strong reason to believe that export contributes to the efficiency level of a firm.
4
in this paper is a long and rich panel for a sample of firms that is representative of the Sub-Saharan African economies. Third, the stochastic approach enables us to distinguish between shifts in production function and changes in technical efficiency.
Empirical results demonstrate that both FDI and export have a significant positive impact on the efficiency level of domestic firms. The average score of firms’ technical efficiency with FDI is higher than that of firms without FDI. I also find other firm characteristics such as firm size and firm age are statistically significant to the efficiency level. Bigger firms tend to be more efficient and older domestic firms have lower efficiencies than the younger ones.
With respect to export behavior, exporting firms display a higher level of efficiency than the non-exporting firms. The foreign ownership structure positively affect both exporters and non-exporters. The impact of firm size is, however, different. For exporters, bigger firms are more efficient and for non-exporters, smaller firms are more efficient. African regional exporters obtain a higher level of efficiency than international exporters.
This paper is organized as follows: Section 2 discusses the stochastic frontier model. Section 3 presents the empirical specification and data. Section 4 describes the empirical results and section 5 will conclude.
2. STOCHASTIC FRONTIER MODEL
The approach of stochastic frontier technique is adopted in this paper to analyze firm’s technical efficiency (Aigner et al,. 1977). It constructs the frontier model by imposing the same technology across all firms in the sample and estimates the potential maximum output for a firm with a vector of production inputs. The actual firm output usually fall short of the frontier model. The deviation from the frontier model is defined as technical inefficiency, the difference between a firm’s optimal output and actual output. The error terms is a mixture of two components, which both of them have nonnegative and systematical distribution (Kumbhakar and Lovell, 2000). The general specification of a frontier model is as follows:
Yit = f(Xit, α)exp(εit) (1)
Where i and t are firm and year indexes; Y is the real output for a firm, X is the production inputs and α is the vector of parameters to be estimated. Error term εit is considered as a
5
to be identically and independently N(0, σv2) distributed across all firms. It represents the
shock that affects firm’s production level, such as luck or weather condition. The inefficiency term, uit is assumed to from a truncated-normal distribution with mean μ and variance σ2.
Both v and u are assumed to be distributed independently for different firms and years. According to Battese and Coelli (1995), the mean of the distribution can be modeled as a linear function of explanatory variables that determine the efficiency level. Those variables are included in the vector Zμ:
μit =Zμδ
(2)
δ is the corresponding vector of coefficients. Maximum-likelihood method can be applied to equation (1) and (2) for the estimates of the parameters in the frontier model and inefficiency function (Kumbhakar, Ghosh and McGuckin, 1991). With the Equations (1) and (2), technical efficiency (TE) for a firm i at year t can be calculated as:
TEit=exp (-uit)
(3)
The mean of the efficiency score can be predicted under conditional expectation. The technical efficiency index is equal to one if the firm has no inefficiency effect and it is less than one otherwise.
The estimation of the stochastic frontier model is as follows:
(1) All value are transferred into log form before fitting a frontier production model;
(2) The sign of the estimated parameters in the inefficiency function can be interpreted as the impact on the firm’s technical efficiency. If the sign is negative and statistically significant, it is taken as evidence of positive effect on firm’s efficiency. Likewise, if the sign is positive and significant, it may suggest negative effect on firm’s efficiency level.
3. DATA SOURCE AND EMPIRICAL SPECIFICATION
3.1Data source
6
time period starts from 1991 and ends in 2003, which is the longest period in the dataset; Firms in South Africa are only observed for two years, from 1997 to 1998; The time period for Kenya is from 1992 to 1999; Tanzania covers period of 1992-2000; And Nigeria has a six year time period, from 1998 to 2003. The dataset covers basic information of each establishment, such as identification code and sector classification. It also contains ownership information (foreign ownership), production information (output per worker, capital to labor ratio, profit rates and materials), employment information (monthly wages, average education of workers, average age of workers and individual level earning) and other information (decision to export, share of total output exported).
This unbalanced panel dataset consists 1439 manufacturing firms between 1991 and 2003 (with 10,359 observations). Although the length of the time period over which firms are observed differs across five countries, within each country firms are observable for the whole period. The problem of missing data exists in this dataset and those missing values are deleted from analysis. Remaining data is still enable us to investigate the main assumption in this paper. Data is collapsed by firm based on the original dataset.
3.2Production function
Assuming the Cobb-Douglas production function takes two inputs, capital K and labor L, the translog function form can be obtained by taking log of the production function on both sides. As stated by Kneller & Stevens (2003) and Kumbhakar & Wang (2005), the translog form does not impose constant elasticity of substitution. Thus it is preferred to the Cobb-Douglas function form. The log-linear form of production function is as follows: lnYit = β0 + βklnKit + βlllnLit + ½ βkk (lnKit) 2 + 1/2βll (lnLit)2 + βkl (lnKit * lnLit) +
βyrTrend + βyesqTrend2 + βyrk (Trend * lnKit) + βyrl (Trend * lnLit) + βc countries +
βyryears + (vit - uit),
(4)
Where Y denotes the firm’s actual output, and K, L denote the physical capital (measured by fixed assets) and labor force (measured by total employment), respectively. countries are country dummy variables, representing South Africa, Nigeria, Kenya, Ghana and Tanzania.
7
provided in the dataset but can be calculated as follows:
lnYit = lnLRLit * lnLit, and (5)
lnKit = lnLKLit * lnLit , (6)
Where lnLRLit is the log of real output per worker in US$ and lnLKLit is the real capital to
labor ratio. Followed the approach of Wang & Wong (2012), the time trend and the trend squared variables are included to allow for non-monotonic technical change. And to account for the possible non-neutral technical change the interaction terms between trend and production inputs are included as well (Wang & Wong, 2012).
3.3 Inefficiency function
Inefficiency function includes firm characteristic variables, such as foreign ownership (a measure of FDI), the total employment (a measure of firm size), firm age and decision to export (EXPORTS). The mean technical efficiency function is presented as follows:
μit = Zμδ = δ0 + δ1ANYFORit + δ2 lnLit+ δ3FMAGEit +δ4 EXPORTSit , (5)
Where lnLit is the log value of the total employees and is taken as a measure of firm size.
Based on the log value of total labor force, I obtain the total number of employees and find out that among all the observations, 736 observations (7%) report the number of employees less than five. And these observations are excluded from the sample. Since smaller firms in manufacturing sector in SSA are more labor intensive and have less capital inputs, excluding them will generate less outliers in production function and will not bias the results. Firm size is an important factor to attract foreign investment. Larger firms are more competitive in the market and have more potentials to be targeted by foreign investors, which in turn makes them more efficient than smaller firms. It is expected that firm size will improve firm’s efficiency level.
The key variable in this study is ANYFORit. It is a dummy variable for foreign
ownership. It equals to one if the share of foreign ownership in firm i is greater than 0% and it is zero otherwise. ANYFORit is taken as a measure of FDI. Sinani et al. (2007) find
evidence of foreign owned firms being the most efficient over time among all ownership groups. It is expected that having foreign ownership will have a positive effect on firm’s efficiency level.
8
long been recognized. According to Roberts and Tybout (1997), Clerides, Lach and Tybout (1998), Bernard and Jensen (1999), Aw, Chung and Roberts (2000), etc., exporting firms are larger, more productive and survive longer than non-export firms. Sinani et al. (2007) concluded two main reasons from the literature review that explains the positive correlation between firm productivity and export behavior. First, learning-by-doing only occurs through the international contacts. Exporters can acquire knowledge and expertise on product design or new method of production, which in turn improves their productivity. Second, the positive correlation between productivity and export, could simply suggest that only the most productive firms can survive in a highly competitive international environment (Sinani et al. 2007). In this paper, EXPORTSit is a dummy variable of firms’
export behavior. It is assigned to one if the firm exports and to zero otherwise. It is expected that exporting firms will have a higher level of technical efficiency.
The last variable included in the inefficiency function is firm age. It is measured by the time period between the year of starting production and the year of survey. Unlike other literatures, Mengistae (1998) find the relationship between age-size effects and technical efficiency is the other way around. Firms with bigger size and lived longer than others because they have proved to be more efficient. Lundvall and Battese (2000) conclude that the age effect is less systematic than the size effect and is insignificant in all sectors except textiles.
The potential impact of firm age on efficiency level is ambiguous.
4. EMPIRICAL RESULTS
4.1 Regression analysis
9
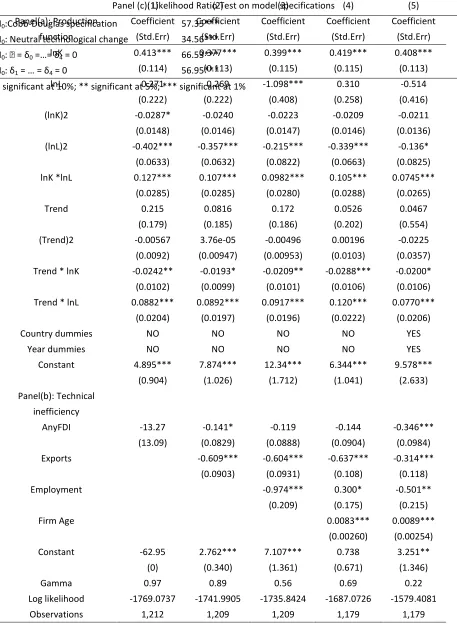
Empirical results are presented in Table 2. Four likelihood ratio tests are conducted to test both production and inefficiency functions. The first test is to compare the Cobb-Douglas form with the translog form. The null hypothesis of the Cobb-Douglas functional form is rejected at 1% level, indicating the translog form is preferred and a good representation of the data. Second, I show that the null hypothesis of neutral technical change is also rejected at 1% level. The coefficient on the interaction between trend and capital is positive and significant and the coefficient on the interaction between trend and labor is negative and also significant. These indicates that the technological change has been capital using and labor saving. Third, I choose to test the presence of inefficiency in the model with a null hypothesis of H0: γ= δ1 = δ2 = δ3 = δ4 = 0. When there is no inefficiency,
the traditional Ordinary Least Squares (OLS) will generate constant estimates. Result shows that there is inefficiency in the model and the maximum likelihood method is preferred to the OLS. Fourth, considering the low value of gamma, it is necessary to test whether the determinants included can explain the source of inefficiency. Rejecting the null hypothesis at 1% level indicates that my inefficiency factors do explain the source of inefficiency.
Table 2 includes five regressions, which are different in terms of the variables included in the inefficiency function. In model 1, only foreign ownership is included in the inefficiency function. Exports behavior is added in model 2. Same for the employment and firm age in model 3 and model 4. Model 5 includes all the determinant variables of the technical efficiency along with robustness check. The future empirical explanation is mainly based on the results from model 5. In Table 2, two panels are reported. Results in panel (a) are from the production function and panel (b) shows the results of the technical inefficiency function. The sign of the estimated parameters in the inefficiency function can be interpreted as the impact on firm’s technical efficiency. So a negative coefficient of a variable indicates that an increase in this variable will decrease inefficiency, or increase efficiency.
The definition of gamma is as follows: γ=σ2u /σ2, where σ2 =σ2u +σ2v (Battese and Coelli,
10
by the inefficiency function. In model 5, γ is 0.22 as the robustness check included in the model. Despite the low value of γ, it is still can be seen from the model that all determinants in the inefficiency function are significant at 1% level. This indicates that not much variations can be accounted for by the technical inefficiency, however the significance within the variations cannot be ignored.
The coefficient on the foreign ownership is negative and significant at 1 percent level, suggesting that having FDI will have a positive impact on domestic firms’ efficiency. The estimated coefficient on the exports is also negative and significant at 1 percent level, which implies exports help to improve the efficiency level of firms. Consistent with the earlier speculation, firm size, measured by total labor force, positively influence technical efficiency with coefficient negative and significant at 5 percent level. Firm age has a negative impact on technical efficiency, with positive coefficient significantly at 5 percent level. The estimated significant effect of technical efficiency factors is robust across countries and years.
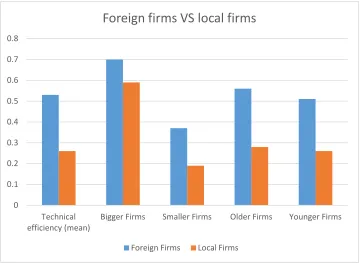
4.2 Foreign firms VS. Local firms
The average efficiency score of firms in this sample is 0.32, regardless of country and industry. The difference in technical efficiency between the two types of firms is presented in Table 3. The average technical efficiency is 0.53 for firms with foreign ownership and is 0.26 for firms without foreign ownership. This is consistent with the findings of Smith, Cin and Vodopivec (1997) and De Mello (1997) that foreign ownership increases efficiency more than other forms of private ownership. And reasons behind this is that foreign ownership can bring advanced technology, capital investment and better organization, which make firms more efficient.
11
0.19. Controlling for other firm characteristics, the size of firm affects the level of technical efficiency.
I then use the same method to compare different technical efficiency between older firms and younger firms. Firms with age above the mean are considered as older firms. Among the foreign firms, the average TE is 0.58 for older firms, which is slightly higher than that for younger firms, which equals 0.56. The result is the same for local firms. Overall, firms that exist longer tend to be more efficient, though the difference is small. Slightly surprising is that the previous estimated coefficient shows that firm age has a positive impact on technical inefficiency, or reduces efficiency, which means younger firms are more efficient. By summarizing TE the results show that older firms are in fact a bit more efficient than younger firms. The possible explanation would be that a 1 percent increase in firm age reduces a firm’s technical efficiency by 0.0089%, which is too small to differentiate TE between older firms and younger firms.
In general, regardless of firm age and size, foreign firms exhibit a higher level of technical efficiency compared to local firms.
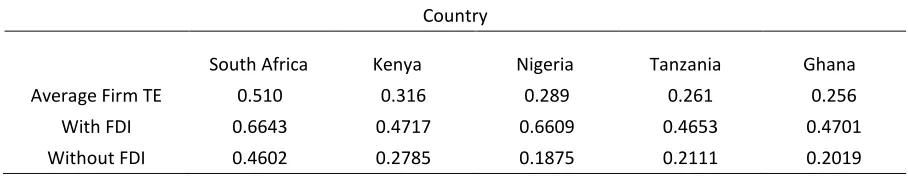
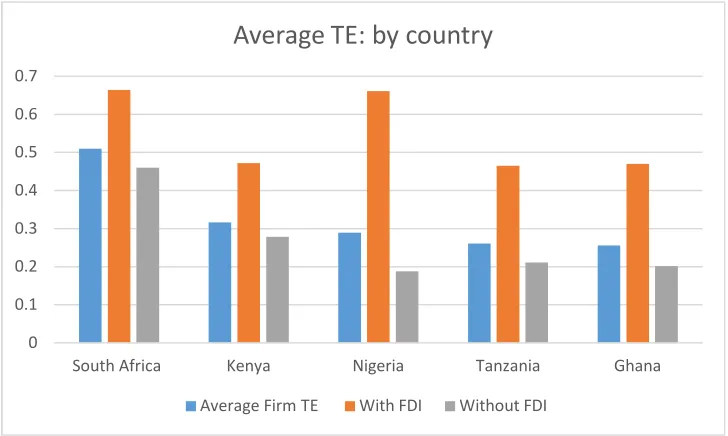
4.3 Average technical efficiency for country and sector
In Table 4, the average technical efficiency for different countries are provided. Firms in South Africa have the highest efficiency level (0.51), followed by Kenya (0.32) and Nigeria (0.29). Tanzania (0.26) and Ghana (0.26) are the least efficient in terms of average firm efficiency score. Next the mean technical efficiency for foreign and local firms are summarized for each country. Consistent with previous findings, the statement that foreign firms tend to more efficient than local firms holds true in five countries. Slightly surprising that the Nigerian foreign firms are almost as efficient as the South African foreign firms, as can be seen from Figure 2. Also the Nigerian local firms show the least efficient level across countries.
12
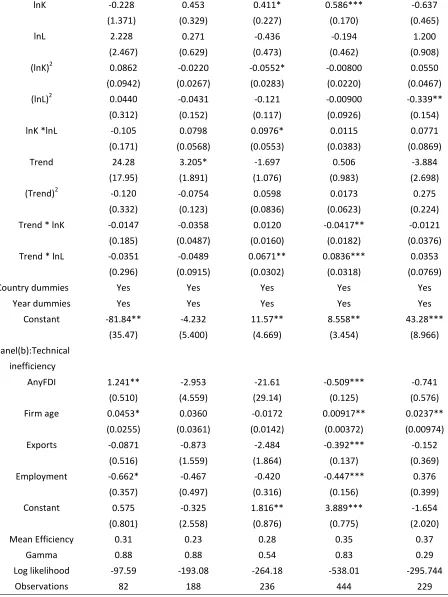
are included for different industry with robustness check. Mean technical efficiencies are reported at the bottom of the table.
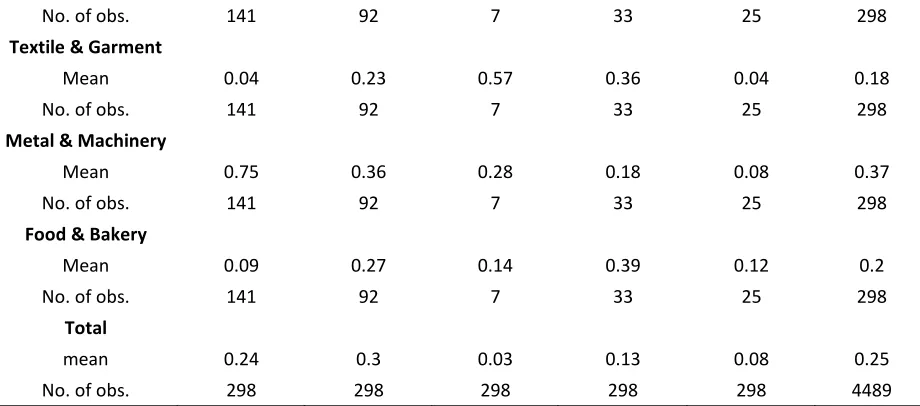
The results for the rest four industries are not very promising, due to the number of observations greatly reduced. The sign and significance level of coefficients on efficiency determinants vary from the previous findings. For instance, in the wood industry, the presence of foreign ownership has a negative impact on technical efficiency, which contradicts the previous findings that foreign ownership helps to efficiency. With a small sample size of 82 observations, the result is not reliable. None of the coefficients in model 2 (furniture) and 3 (textile and garment) are significant, although the signs are consistent. Noted that only for the industry of metal and machinery (model 4), coefficients on the variables of efficiency are significant and consistent with previous findings. Also this sector shows the second highest efficiency level, with average TE score equals 0.35. There is no substantial difference in technical efficiencies across sectors. Food and bakery obtain the highest average efficiency level at 0.37 and furniture has the lowest average technical efficiency at 0.23. The relationship between foreign ownership and technical efficiency is common across sectors too (Figure 1). In all sectors, firms with foreign ownership are much more efficient. Foreign firms in the textile and garment sector exhibit the highest level of technical efficiency at 0.58, followed by metal & machinery (0.54) and food & bakery (0.53).
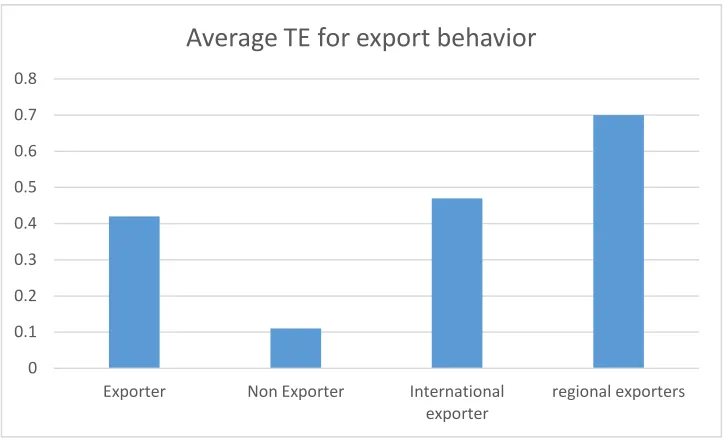
4.4 Exporter VS. Non exporters
Are exporting firms more efficient than the non-exporting firms? Table 6 shows overall one quarter of total observations are exporting firms and export participation varies greatly within countries and sectors. On average, 71 percent of firms in South Africa participates in export and only 9 percent of observations in Nigeria being of exporting firms. Wood shows the highest export propensity with 36 percent of observations in this sector doing exports and furniture has the lowest propensity (0.16). Although export behavior varies by country and sector, common characteristics of exporting firms can still be identified. Using the same dataset, Rankin, Soderborn and Teal (2004) find that exporters with higher level of labor productivity are larger, tend to be older and more likely to be foreign owned.
13
foreign ownership, firm size and firm age in the inefficiency function. Results are presented in the Table 7. Model 1 shows the results for exporters. For exporting firms, only foreign ownership is significant at 10% level. Firm size and age lose significance, but the signs remain consistent with previous results. In model 3, for international exporters, firm size becomes significant again, at 10% level. This is consistent with previous studies that firm size is more important for international exporters.
The difference of technical efficiency between exporters and non-exporters is presented in Figure 4. Overall, exporters are much more efficient than non-exporters, with average technical efficiency at 0.42. While the efficiency level for non-exporters is only at 0.11. Results from both models suggest that foreign ownership does matter for both exporters and non-exporters and it increases the level of efficiency. Firm size also matters but its influence is different. For exporters, the larger the firm is, the more efficient it tends to be. On the other hand, for non-exporters, smaller firms tend to be more efficient.
Export behavior varies even within the exporting firms, which can be divided into two groups: international, or export outside of Africa; and regional, export within Africa. In order to compare the two group’s efficiency level I drop 88 firms from the sample which do the regional and international export at the same time. Two dummy variables are specified in the frontier model: Exportnait takes the value 1 if firm only trade within Africa and 0
otherwise; Exportait takes the value 1 if firm exports internationally and 0 otherwise.
Figure 4 shows the average technical efficiency scores. Surprisingly the regional exporters have a higher level of technical efficiency at 0.7, while international exporters obtain a lower level of efficiency at 0.47. Foreign ownership, firm size and age significantly affect the international traders but they are statistically insignificant to the regional traders.
14
5.
CONCLUSION
Using data on a sample of manufacturing firms across five African countries over the period of 1991-2003, I investigate the relationship between the existence of foreign direct investment and domestic firms’ technical efficiency, applying stochastic frontier analysis. A major benefit of this approach is that the parameters of both production function and inefficiency function can be estimated simultaneously. Empirical results show that foreign firms are less inefficient than domestic firms, regardless of country and sector. With respect to other firm characteristics, firms with larger size tend to be more efficient and older domestic firms have lower efficiencies than the younger ones.
In terms of export behavior, exporting firms display a higher level of efficiency than the non-exporting firms. The foreign ownership structure positively affect both exporters and non-exporters. The impact of firm size is, however, different. For exporters, bigger firms are more efficient and for non-exporters, smaller firms are more efficient. African exporters obtain a higher level of efficiency than international exporters.
The mean technical efficiency over the sample period is 0.32. Comparing to other developing countries, the five Sub-Saharan African countries are still among the least efficient countries. The policy implications based on previous findings provide straight forward support for policies promoting foreign direct investment within the manufacturing sector. Other macro factors are vital for policy makers to attract FDI, such as political stability, government administration and trade policies. They are needed to develop a more competitive environment in the whole manufacturing sector.
15
ownership in the efficiency function and the results remain robust. Several studies adopting this method are able to prove that the endogeneity can be minimized. However, this method imposes high requirement for dataset and with the dummy variable of foreign ownership used in this paper, this method cannot be implemented. Issues stated above cannot be ignored but reveal the caveats regarding the long existing problem in mixed empirical results of FDI and from drawing inferences from its impact on firms’ development/countries’ economic growth, especially in studying the relationship between FDI and technical efficiency.
Reference
Aigner, D. J., Lovell, C. A. K., & Schmidt, P. (1977). "Formulation and estimation of stochastic frontier production function models". Journal of Econometric, 6(1), 21–37. Aitken, B. J. and Harrison, A. E. (1999). "Do domestic firms benefit from direct foreign
investment? Evidence from Venezuela", American Economic Review, 89, 605–18.
Alfaro, Laura. (2003). "Foreign Direct Investment and Growth: Does the Sector Matter?", Available at http://www.people.hbs.edu/lalfaro/fdisectorial.pdf.
Aw Bee-Yan, Sukkyn Chung and Mark J. Roberts. (2000). "Productivity and Turnover in the
Export Market: Micro-level Evidence from the Republic of Korea and Taiwan", The World Bank Economic Review, 14(1), 65-90.
Battese, G., & Coelli, T. (1995). "A model for technical inefficiency effects in a stochastic frontier production function for panel data". Empirical Economics, 20(2), 325–332. Bernard, Andrew B. and J. Bradford Jensen. (1999). "Exceptional Exporter Performance: Cause, Effect, or Both? ", Journal of International Economics, Vol. 47(1), 1-25.
16
Working Paper, No. 11299.
Chuang, Y. C. and Hsu, P. F. (2004). "FDI, trade, and spillover efficiency: evidence from China’s manufacturing sector", Applied Economics, 36, 1103–15.
Clerides, K. Sofronis, Saul Lach and James R. Tybout. (1998). "Is Learning by Exporting Important? Micro-Dynamic Evidence from Colombia, Mexico, and Morocco", Quarterly Journal of Economics, Aug: 903-947.
Collier, P. et al. (2000). "Exports and Firm-level Efficiency in African Manufacturing". University of Oxford. Department of Economics in its series Economics Series Working Papers. WPS/2000-16.
Djankov, S. and Hoekman, B. (2000). "Foreign investment and productivity growth in Czech enterprises", World Bank Economic Review, 14, 49–64.
Ghali, S. and Rezgui, S. (2006). "FDI Contribution to Technical Efficiency in The Tunisian Manufacturing Sector". Available at:
http://www.uneca.org/sites/default/files/page_attachments/sofiane_ghali_0.pdf Gorg, H. and Strobl, E. (2005). "Spillovers from foreign firms through worker mobility: an
empirical investigation", Scandinavian Journal of Economics, 107, 693–739.
Haddad, M. and Harrison, A. E. (1993). "Are there positive spillovers from foreign direct investment? Evidence from panel data for Morocco", Journal of Development Economics, 42, 51–74.
Iyer, Krishna G., Rambaldi Alicia N., and Tang, Kam Ki (2004). "Measuring Spillovers from Alternative Forms of Foreign Investment", working paper series from Centre for Efficiency and Productivity Analysis, University of Queensland.
Javorcik, B. S. (2004). "Does foreign direct investment increase the productivity of domestic firms? In search of spillovers through backward linkages", American Economic Review, 94, 605–27.
Kathuria, V. (2000). "Productivity spillovers from technology transfer to Indian manufacturing firms", Journal of International Development, 12, 343–69.
17
the presence of inefficiency". Economics Letters, 81(2), 223–226.
Konings, J. (2001). "The effects of foreign direct investment on domestic firms", Economics of Transition, 9, 619–33.
Kugler, M. (2006). "Spillovers from foreign direct investment: within or between industries?" Journal of Development Economics, 80, 444–77.
Kumbhakar, S., Ghosh, S., & McGuckin, T. (1991). "A generalized production frontier approach for estimating determinants of inefficiency in US dairy farms". Journal of Business and Economic Statistics, 9(3), 279–286.
Kumbhakar, S., & Lovell, C. (2000). "Stochastic frontier analysis". Cambridge, New York and Melbourne: Cambridge University Press.
Kumbhakar, S., & Wang, H.-J. (2005). "Estimation of growth convergence using a stochastic production frontier approach". Economics Letters, 88(3), 300–305.
Lumbila, K.N. (2005). "What makes FDI Work? A Panel Analysis of the Growth Effect of FDI in Africa". Africa Region Working paper Series No. 80.
Liang, F. H. (2007). "Does foreign direct investment improve the productivities of domestic firms? Technology spillovers within and between industries", Haas Berkeley Working Paper. Available at http://faculty. haas.berkeley.edu/fenliang/research/
spillover/FDIspillover.pdf (accessed 20 July 2007).
Lundvall, Karl & George E. Battese (2000). "Firm size, age and efficiency: Evidence from Kenyan manufacturing firms", The Journal of Development Studies, 36:3, 146-163.
Mengistae, Taye. (1998). "Age-Size Effects in Firm Growth and Productive Efficiency: The Case of Manufacturing Establishments in Ethiopia". Available at:
http://siteresources.worldbank.org/DEC/Resources/age-size.pdf
Nourzad, F. (2008). "Openness and the Efficiency of FDI: A Panel Stochastic Production Frontier Study". International Advances in Economic Research, 14: 23-35.
18
Decision to Export". American Economic Review, Vol. 87(4), pp. 545-64.
Sinani, E., Jones, D. C., & Mygind, N. (2007). "Determinants of Firm-level Technical Efficiency: Evidence Using Stochastic Frontier Approach". Frederiksberg: Department of International Economics and Management, Copenhagen Business School.
Smith Kerry, Beom-Cheol Cin, and Milan Vodopivec. (1997). "Privatization Incidence, Ownership Forms and Firm Performance: Evidence from Slovenia", Journal of Comparative Economics, 25 (2), 158-179.
Solow, R. (1957). "Technical change and the aggregate production function". Review of Economics and Statistics, 39(3), 312–320.
Suyanto, Salim R. (2013). "Foreign direct investment spillovers and technical efficiency in the Indonesian pharmaceutical sector: firm level evidence", Applied Economics, 45:3, 383-395.
Thangavelu, S. M. and Pattnayak, S. S. (2006). "Linkages and spillovers from foreign ownership in the Indian pharmaceutical firms", SCAPE Working Paper Series No. 2006/05.
Wijeweera, A., Dollery, B. and Villano, R. (2010). "Economic Growth and FDI Inflows: A Stochastic Frontier Analysis". The Journal of Developing Areas, Volume 43, pp. 143-158. Wang, Miao and Wong, M.C. Sunny. (2012). "International R&D Transfer and Technical
19
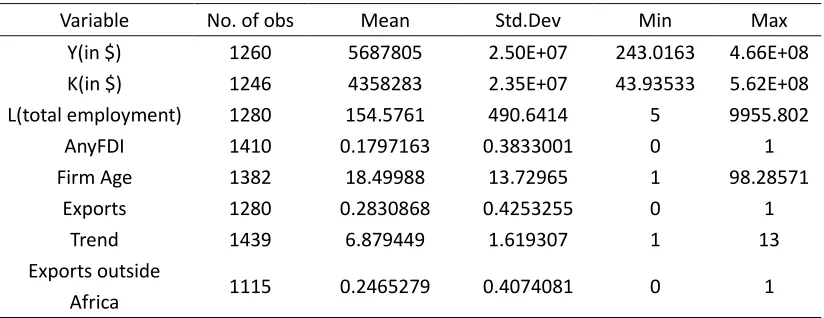
Table 1. Descriptive statistics
Variable No. of obs Mean Std.Dev Min Max
Y(in $) 1260 5687805 2.50E+07 243.0163 4.66E+08
K(in $) 1246 4358283 2.35E+07 43.93533 5.62E+08
L(total employment) 1280 154.5761 490.6414 5 9955.802
AnyFDI 1410 0.1797163 0.3833001 0 1
Firm Age 1382 18.49988 13.72965 1 98.28571
Exports 1280 0.2830868 0.4253255 0 1
Trend 1439 6.879449 1.619307 1 13
Exports outside
20
21
Note: Standard errors are in parentheses * significant at 10%; ** significant at 5%; *** significant at 1%
Table 2. Production function and technical inefficiency estimates-(b) Panel(a): Production function (1) Coefficient (Std.Err) (2) Coefficient (Std.Err) (3) Coefficient (Std.Err) (4) Coefficient (Std.Err) (5) Coefficient (Std.Err)
lnK 0.413*** 0.377*** 0.399*** 0.419*** 0.408*** (0.114) (0.113) (0.115) (0.115) (0.113)
lnL 0.271 0.269 -1.098*** 0.310 -0.514
(0.222) (0.222) (0.408) (0.258) (0.416)
(lnK)2 -0.0287* -0.0240 -0.0223 -0.0209 -0.0211 (0.0148) (0.0146) (0.0147) (0.0146) (0.0136) (lnL)2 -0.402*** -0.357*** -0.215*** -0.339*** -0.136*
(0.0633) (0.0632) (0.0822) (0.0663) (0.0825) lnK *lnL 0.127*** 0.107*** 0.0982*** 0.105*** 0.0745***
(0.0285) (0.0285) (0.0280) (0.0288) (0.0265)
Trend 0.215 0.0816 0.172 0.0526 0.0467
(0.179) (0.185) (0.186) (0.202) (0.554)
(Trend)2 -0.00567 3.76e-05 -0.00496 0.00196 -0.0225 (0.0092) (0.00947) (0.00953) (0.0103) (0.0357)
Trend * lnK -0.0242** -0.0193* -0.0209** -0.0288*** -0.0200* (0.0102) (0.0099) (0.0101) (0.0106) (0.0106) Trend * lnL 0.0882*** 0.0892*** 0.0917*** 0.120*** 0.0770***
(0.0204) (0.0197) (0.0196) (0.0222) (0.0206)
Country dummies NO NO NO NO YES
Year dummies NO NO NO NO YES
Constant 4.895*** 7.874*** 12.34*** 6.344*** 9.578*** (0.904) (1.026) (1.712) (1.041) (2.633)
Panel(b): Technical inefficiency
AnyFDI -13.27 -0.141* -0.119 -0.144 -0.346*** (13.09) (0.0829) (0.0888) (0.0904) (0.0984) Exports -0.609*** -0.604*** -0.637*** -0.314***
(0.0903) (0.0931) (0.108) (0.118)
Employment -0.974*** 0.300* -0.501**
(0.209) (0.175) (0.215)
Firm Age 0.0083*** 0.0089***
(0.00260) (0.00254)
Constant -62.95 2.762*** 7.107*** 0.738 3.251** (0) (0.340) (1.361) (0.671) (1.346)
Gamma 0.97 0.89 0.56 0.69 0.22
Log likelihood -1769.0737 -1741.9905 -1735.8424 -1687.0726 -1579.4081 Observations 1,212 1,209 1,209 1,179 1,179
Panel (c): Likelihood Ratio Test on model specifications
H0:Cobb-Douglas specification 57.35***
H0: Neutral technological change 34.56*** H0: ϒ = δ0 =…= δ4 = 0 66.53*** H0: δ1 = … = δ4 = 0 56.95***
22
Table 3. Foreign firms VS. Local firms
Foreign Firms Local Firms
Technical efficiency (mean) 0.53 0.26
log of employee (above mean) 0.7 0.59 log of employee (below mean) 0.37 0.19 Firm age (above mean) 0.56 0.28
Firm age (below mean) 0.51 0.26
Table 4. Country Efficiency Scores
Country
South Africa Kenya Nigeria Tanzania Ghana Average Firm TE 0.510 0.316 0.289 0.261 0.256
With FDI 0.6643 0.4717 0.6609 0.4653 0.4701 Without FDI 0.4602 0.2785 0.1875 0.2111 0.2019
Table 5. Production function and technical inefficiency estimates for sectors
Dependent variable: log of total output
Note: Standard errors are in parentheses * significant at 10%; ** significant at 5%; *** significant at 1% Panel(a):
Production function
(1)
WOOD
Coefficient (Std.Err)
(2)
FURN
Coefficiet (Std.Err)
(3)
TEX&GAR
Coefficient (Std.Err)
(4)
MET&MAC
Coefficient (Std.Err)
(5)
FOOD&BAK
23
Table 6. Export propensity: by country and sector
South Africa Kenya Nigeria Tanzania Ghana Total
Wood
Mean 0 0.07 0 0.06 0.64 0.15
No. of obs. 141 92 7 33 25 298
Furniture
Mean 0.11 0.08 0 0 0.12 0.1
lnK -0.228 0.453 0.411* 0.586*** -0.637
(1.371) (0.329) (0.227) (0.170) (0.465)
lnL 2.228 0.271 -0.436 -0.194 1.200
(2.467) (0.629) (0.473) (0.462) (0.908) (lnK)2 0.0862 -0.0220 -0.0552* -0.00800 0.0550
(0.0942) (0.0267) (0.0283) (0.0220) (0.0467) (lnL)2 0.0440 -0.0431 -0.121 -0.00900 -0.339**
(0.312) (0.152) (0.117) (0.0926) (0.154)
lnK *lnL -0.105 0.0798 0.0976* 0.0115 0.0771 (0.171) (0.0568) (0.0553) (0.0383) (0.0869)
Trend 24.28 3.205* -1.697 0.506 -3.884
(17.95) (1.891) (1.076) (0.983) (2.698)
(Trend)2 -0.120 -0.0754 0.0598 0.0173 0.275
(0.332) (0.123) (0.0836) (0.0623) (0.224) Trend * lnK -0.0147 -0.0358 0.0120 -0.0417** -0.0121
(0.185) (0.0487) (0.0160) (0.0182) (0.0376) Trend * lnL -0.0351 -0.0489 0.0671** 0.0836*** 0.0353
(0.296) (0.0915) (0.0302) (0.0318) (0.0769)
Country dummies Yes Yes Yes Yes Yes
Year dummies Yes Yes Yes Yes Yes
Constant -81.84** -4.232 11.57** 8.558** 43.28*** (35.47) (5.400) (4.669) (3.454) (8.966)
Panel(b):Technical inefficiency
AnyFDI 1.241** -2.953 -21.61 -0.509*** -0.741 (0.510) (4.559) (29.14) (0.125) (0.576)
Firm age 0.0453* 0.0360 -0.0172 0.00917** 0.0237**
(0.0255) (0.0361) (0.0142) (0.00372) (0.00974) Exports -0.0871 -0.873 -2.484 -0.392*** -0.152
(0.516) (1.559) (1.864) (0.137) (0.369) Employment -0.662* -0.467 -0.420 -0.447*** 0.376
(0.357) (0.497) (0.316) (0.156) (0.399) Constant 0.575 -0.325 1.816** 3.889*** -1.654
(0.801) (2.558) (0.876) (0.775) (2.020)
Mean Efficiency 0.31 0.23 0.28 0.35 0.37
Gamma 0.88 0.88 0.54 0.83 0.29
Log likelihood -97.59 -193.08 -264.18 -538.01 -295.744
24
No. of obs. 141 92 7 33 25 298
Textile & Garment
Mean 0.04 0.23 0.57 0.36 0.04 0.18
No. of obs. 141 92 7 33 25 298
Metal & Machinery
Mean 0.75 0.36 0.28 0.18 0.08 0.37
No. of obs. 141 92 7 33 25 298
Food & Bakery
Mean 0.09 0.27 0.14 0.39 0.12 0.2
No. of obs. 141 92 7 33 25 298
Total
mean 0.24 0.3 0.03 0.13 0.08 0.25
No. of obs. 298 298 298 298 298 4489
Table 7. Production function and technical inefficiency estimates for exporters, non-exporters and
international exporters
Panel(b): Technical inefficiency
(1) Exporters
(2) Non-exporters
(3)
International Exporters
25
(Std.Err) (Std.Err) (Std.Err)
AnyFDI -0.616* -0.356*** -0.852*
(0.3523) (0.1147) (0.5124)
Firm Size -0.303 1.048*** -0.8314*
(0.2602) (0.4025) (0.4900)
Firm Age 0.0065 0.01*** 0.0179
(0.0071) (0.003) (0.0126)
Constant 2.084 -0.6315 3.738
(1.341) (0.855) (2.321)
Gamma 0.26 0.88 0.072
Log likelihood -337.6 -1038.04 -149.42
Observations 277 768 125
Note: Standard errors are in parentheses * significant at 10%; ** significant at 5%; *** significant at
1%
Figure 1
0 0.1 0.2 0.3 0.4 0.5 0.6 0.7 0.8
Technical efficiency (mean)
Bigger Firms Smaller Firms Older Firms Younger Firms
Foreign firms VS local firms
26 Figure 2
Figure 3
0 0.1 0.2 0.3 0.4 0.5 0.6 0.7
South Africa Kenya Nigeria Tanzania Ghana
Average TE: by country
Average Firm TE With FDI Without FDI
0 0.1 0.2 0.3 0.4 0.5 0.6 0.7
Wood Furniture Texitiel & Garment
Metal & Machinary
Food & Bakery
Average TE: by sector
27 Figure 4
0 0.1 0.2 0.3 0.4 0.5 0.6 0.7 0.8
Exporter Non Exporter International exporter
regional exporters