DEMOGRAPHIC RESEARCH
VOLUME 33, ARTICLE 18, PAGES 525–534
PUBLISHED 9 SEPTEMBER 2015
http://www.demographic-research.org/Volumes/Vol33/18/ DOI: 10.4054/DemRes.2015.33.18
Descriptive Finding
The impact of demographic change on
intergenerational transfers via bequests
Emilio Zagheni
Brittney Wagner
©2015 Emilio Zagheni &Brittney Wagner.
This open-access work is published under the terms of the Creative Commons Attribution NonCommercial License 2.0 Germany, which permits use, reproduction & distribution in any medium for non-commercial purposes, provided the original author(s) and source are given credit.
2 Demographic forces shaping trends in transfers via bequests 527
3 Empirical evidence from the panel study of income dynamics 529
3.1 Recent trends in age of bequest recipients 530
3.2 Recent trends in size of bequests 531
4 Conclusions 532
5 Acknowledgements 533
Descriptive Finding
The impact of demographic change on intergenerational
transfers via bequests
Emilio Zagheni1 Brittney Wagner2
Abstract
BACKGROUND
Transfers in the form of bequests have important implications for the intergenerational transmission of inequality. Demographic change has relevant consequences for the timing and size of bequests. For example, longer life implies that people receive bequests when they are older. Conversely, increasing generational length reduces the average age at which people are given bequests.
OBJECTIVE
We analyze the consequences of demographic change in the United States on timing over the life course when individuals receive an inheritance and on the size of bequests.
METHODS
We evaluate trends in life expectancy at the mean age at childbearing as a proxy for timing at receipt of bequests. We complement formal demographic analysis with empirical estimates from the Panel Study of Income Dynamics (PSID) inheritance data for 1987−2010.
RESULTS
We find that the long-term trend of increasing age at receipt of bequests might have stalled, mainly because of changes in the timing of fertility. In the long term the upward trend in age at which people receive bequests may resume, as the expected linear gains in life expectancy will more than counteract recent increases in the mean age at childbearing.
CONCLUSIONS
We showed that demographic change affects the size of bequests and the timing over the life course when people receive them. As the need for economic resources varies over the life cycle, changes in the timing at receipt of bequests may have a differential
impact on wealth inequality and affect patterns of multigenerational transfers of resources.
1. Introduction
Intergenerational transfers in the form of bequests play an important role in the multigenerational transfer of wealth and income disparity. As such, it is necessary to grasp the patterns of the transmission of wealth across generations. Two important factors, the size of inheritances and the timing at which they are received, help us to understand who will benefit most from bequests and to what degree. Examining demographic change in both fertility and life expectancy provides relevant insights into the timing and size of bequests over time. Longer life implies that people will receive bequests when they are older, while increasing generational length suggests a reduction in the average age at which people are given bequests.
There are a number of factors that influence the giving and receiving of bequests as well as their significance in wealth accumulation and income disparity. Economic theory identifies and debates three motivating forces behind intergenerational monetary transfers: altruistic, strategic, and accidental (Hurd and Smith 2002). Demographic theory emphasizes the role of population age structure (Lee and Mason 2011; Sánchez-Romero, Ogawa, and Matsukura 2013). Bequests are also affected, in opposite directions, by factors such as increases in household wealth and shocks related to medical expenses (Hurd and Smith 2001).
Between 1989 and 2007, bequests accounted for approximately 40% of the wealth accumulated over the lifetime of 30% of households who could expect an inheritance. At any given cross section during this time period, around 21% of households in the United States had received a bequest. While this percentage increases among wealthier households, inheritances may account for a larger proportion of the wealth of those in lower income brackets, suggesting that bequests may play an equalizing role in wealth inequality (Wolff 2002; Wolff and Gittelman 2011).
2. Demographic forces shaping trends in transfers via bequests
Two main demographic forces affect the age at which individuals, on average, receive bequests. Improvements in mortality, which can be summarized in terms of increases in life expectancy, tend to raise the age at which people experience the death of their parents, all else being constant. Conversely, fertility postponement increases the length of generations. All else being constant, later fertility means that parents of children of a given age tend to be older over time. Thus, increases in the mean age at childbearing tend to reduce the age at parental death. When we consider increases in life expectancy and fertility postponement together, the net effect is ambiguous and depends on the relative strength of each of the two demographic drivers.
In order to understand the evolution of the average age at which people receive bequests, we use the tools of the formal demography of kinship (Goodman, Keyfitz, and Pullum 1974; Keyfitz and Caswell 2005). In particular, we consider the classic stable-population approximation for the probability that a girl of age a has a living mother:
M1(a)=𝑙(𝑙𝜇+𝑎(𝜇)) (1)
In equation 1 we use the same notation as in Keyfitz and Caswell (2005). The subscript
1 in M1(a) refers to generations. In this case the expression refers to the probability of
having a living mother (one generation before the child). If the subscript were equal to 2, then the expression would refer to the probability of having a living grandmother (two generations before the child), etc. μ is the mean age at childbearing and l(x) is the survival probability to age x. l(μ+a) is the probability that the mother will survive a
years past the mean age at childbearing. Conditional on child survival, M1(a) can be
thought of as a survival probability in a life table: it has to be equal to 1 when a is equal to zero (the mother is alive when she gives birth) and goes monotonically to zero. Therefore, the mean age at mother’s death, conditional on child survival, is the area under the M1(a) curve. In other words, it is the life expectancy at the mean age at
childbearing.
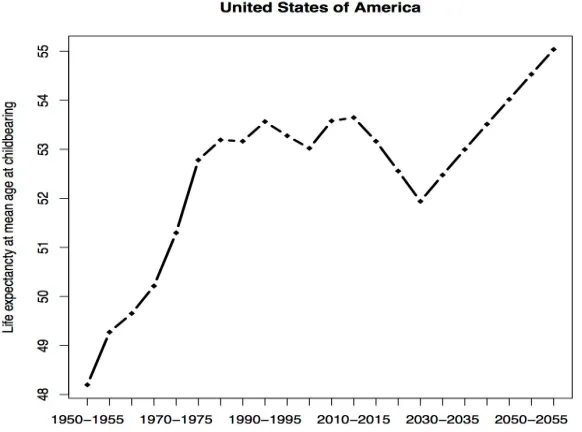
Figure 1: Estimates and projections of life expectancy at mean age at childbearing for the U.S.A.
Source: Own elaborations on data from the United Nations World Population Prospects, the 2012 Revision.
Figure 1 shows that eμ, the life expectancy at the mean age at childbearing,
The total fertility rate, which can be thought of as a proxy for family size, affects the amount of economic resources that individuals inherit. Large families imply that several people share inheritances, making the size that each individual receives relatively smaller. Reductions in fertility, when considered independently of other factors, would result in a relative increase in the size of inheritances. As fertility has decreased from about 3 children per woman in the 1950s to the current level of about 2 children per woman, we would expect that demographic change has had a positive impact on per-capita size of bequests received.
3. Empirical evidence from the panel study of income dynamics
In order to estimate changes in the age at which bequests are received, as well as their size, we use data from the Panel Study of Income Dynamics (PSID 2013). The PSID is a longitudinal study of individuals and families in the United States. Data collection began in 1968 with a nationally representative sample of 18,000 participants representing 5,000 families. They and their descendants have continued to be interviewed annually and biennially since that time.
The initial 1968 sample was comprised of an equal probability sample of households from the Survey Research Center 1960 sample and a sample of low-income families selected in 1967 by the Bureau of the Census for the Office of Economic Opportunity’s Survey of Economic Opportunity (SEO). In 1997 the total number of PSID households reached 10,000. Due to budget constraints, approximately two-thirds of the SEO sample was dropped. As such, weights were developed in 1968 to account for inconsistencies in the selection of the original sample and later adjusted for sample reduction and attrition. In this study, individual longitudinal weights are applied to each respondent for each respective year. Zero weights are assigned to three classes of participants: adult participants who joined the PSID by way of marriage or co-residency, children of non-sample adults who are unrelated to participants of the original sample, and members of the 1990 PSID Latino sample (Gouskova et al. 2008).
of the bequest, as inheritance data were provided by the head on behalf of the entire household. As such, we estimate trends in mean age at bequest receipt by subtracting one year from the household head’s age to account for the one-year lapse in the inheritance-reporting period. Bequest values are adjusted for inflation based on the 2010 Consumer Price Index.
3.1 Recent trends in age of bequest recipients
Figure 2 displays the mean age at which heads of household report receiving bequests, by gender and over time. The size of each data point is proportional to the percentage of heads of household who report receiving bequests. 95% confidence intervals are included for female- and male-headed household estimates. We observe little fluctuation in the mean age at which bequests were received between 1987 and 2010. This pattern holds for male-headed households with slightly more fluctuation among female-headed households. The average age at which bequests are received are similar among male and female-headed households, except in 1992-1996 and 1998-2002 when the mean age is higher for female-headed households. This variation may be due to the small sample size of female-headed households.
Figure 2: Mean age at receipt of bequests by year and gender (N=1122)
Note: Size of data points is proportional to the percentage of heads of household who report receiving bequests.
The empirical evidence from the Panel Study of Income Dynamics mirrors the expected trends that we predicted using formal demographic tools. The sample size is relatively small and the confidence intervals are fairly wide. Therefore, results should be interpreted with caution. However, we showed some evidence that over the past decade increases in the mean age at childbearing may have counteracted improvements in life expectancy, thus stalling the trend of increasing age at receipt of bequests.
3.2 Recent trends in size of bequests
In Figure 3 we show the mean size of bequests received, by gender and over time. The results are displayed for the years 1987 through 2010. The data show a general increase in the size of per-capita bequests received between 1987 and 2010, aligning with a decrease in the total fertility rate in the United States. It is important to note that many economic factors influence the size of bequests, including saving rates and patterns of wealth accumulation. Therefore, the interpretation of the importance of demographic factors for the size of bequests is not as straightforward as for the age at which people receive bequests.
Figure 3: Mean size of bequests by year and gender (N=1122)
In terms of gender, male-headed households closely follow the trajectory of the general population, whereas female-headed households do not display a discernible
pattern in the size of bequests received over time. In 1987−1991 the mean bequest
amount starts at similar levels for both males and females, with male-headed households receiving slightly larger bequests than their female counterparts. In 2008-2010, the gender disparity in size of bequests received widens in favor of male-headed households.
4. Conclusions
Using formal demographic methods and data from the Panel Study of Income Dynamics, this paper explores how changes in fertility, life expectancy, and the mean age at childbearing relate to the size of bequests in the United States and the profile of their recipients. Our findings suggest that the long-term trend of increasing age at receipt of bequests has stalled. The age at which people receive bequests has been increasing as a result of improvements in life expectancy during a period of relatively stable mean age at childbearing. However, fertility postponement has counteracted recent gains in life expectancy.
The size of per-capita bequests received has been increasing. One possibility is that this trend reflects less diffusion of funds among siblings and relatively higher proportions of people who reach ages characterized by higher risk of death. In the long term, other factors such as increased life expectancy at mean age at childbearing and, possibly, increased concentration of wealth in those age groups that are close to death, may potentially generate relative increases in the size of bequests and in the age at receiving bequests. Long-term trends will depend on a number of economic factors, such as growth, savings rates, and wealth accumulation. In this article we showed how a simple demographic model offers relevant insights and predictive power regarding trends in intergenerational transfers in the form of bequests. More complex models that include interactions of demographic factors and economic variables may provide additional information and include several future scenarios (see, for instance, Sánchez-Romero, Ogawa, and Matsukura 2013).
bequests. We did not test this hypothesis empirically, but future work could address it explicitly.
For this article we focused on the United States and we considered trends in averages. Similar methods, data, and analyses could be used to gain insights on the implications of global demographic trends in a comparative perspective. We expect future research to analyze trends for a large number of countries. We also believe that the evaluation of population heterogeneity for multigenerational transfers of resources is an important aspect that will need further investigation. We looked into differences in patterns for male-headed and female-headed households. Additional important elements of heterogeneity potentially include measures of wealth, educational attainment, and proxies for socio-economic status.
In our article we showed descriptive statistics and proposed a simple model to understand some of the demographic mechanisms behind observed trends. Our work is intended to stimulate further analyses of the relationship between bequests and demographic change. First, more data could be analyzed to evaluate the robustness of our empirical findings. For instance, relevant information could be extracted from the Health and Retirement Survey for the US, and from the Generations and Gender Survey for other countries. Second, the theoretical model could be extended to include the possibility of repeated inheritance events over the life course, differential mortality by sex, and transfers to spouses and step-kin. We believe that the combination of empirical data and demographic microsimulation may offer important insights into the complex dynamics of demographic change and patterns of transfers in the form of bequests.
5. Acknowledgements
References
Goodman, L.A., Keyfitz, N., and Pullum, T.W. (1974). Family formation and the frequency of various kinship relationships. Theoretical Population Biology 5(1):
1−27.doi:10.1016/0040-5809(74)90049-5.
Gouskova, E., Herringa, S.G., McGonagle, K., and Schoeni, R.F. (2008). Technical report: Panel Study of Income Dynamics, revised longitudinal weights 1993−2005. Ann Arbor, MI: Survey Research Center, Institute for Social Research.
Hurd, M.D. and Smith, J.P. (2001). Anticipated and actual bequests. In: Wise, D.A. (ed.). Themes in the economics of aging. Chicago: The University of Chicago Press: 357−392. doi:10.7208/chicago/9780226903330.003.0012.
Hurd, M.D. and Smith, J.P. (2002). Expected bequests and their distribution.
Cambridge: National Bureau of Economic Research (NBER working paper; WP-9142). doi:10.3386/w9142.
Keyfitz, N. and Caswell, H. (2005). Applied mathematical demography. New York: Springer.
Lee, R.D. and Mason, A. (eds.) (2011). Population aging and the generational
economy: A global perspective. Cheltenham: Edward Elgar Publishing Limited.
Panel Study of Income Dynamics, public use dataset (2013). Produced and distributed by the Survey Research Center, Institute for Social Research. Ann Arbor, MI: Survey Research Center, Institute for Social Research.
Sánchez-Romero, M., Ogawa, N., and Matsukura, R. (2013). To give or not to give: Bequest estimate and wealth impact based on a CGE model with realistic demography in Japan. Rostock: Max Planck Institute for Demographic Research (MPIDR working paper; WP-2013-012).
Wolff, E.N. (2002). Inheritances and wealth inequality, 1989−1998. Bequests, Savings, and Wealth Inequality 92(2): 260−264.