38
Available online at www.ijiere.com
International Journal of Innovative and Emerging
Research in Engineering
e-ISSN: 2394 - 3343 p-ISSN: 2394 - 5494
SYNTHESIS AND CHARACTERIZATION OF TiO
2
NANOPARTICLES BY SOLGEL METHOD AND ITS
EVALUATION OF ANTICANCER ACTIVITY
K.Manikandan
a*, A.JafarAhamed
b, A.Thirugnanasundar
c,
Department of Chemistry, Velalar College of Engineering and Technology (Autonomous), Erode-638 012, India. PG and Research Department of Chemistry, Jamal Mohamed College (Autonomous), Trichy-620 020, India.
Department of Chemistry, Erode Arts and Science College (Autonomous), Erode-638009, India.
Abstract
In this paper, the synthesis of titanium dioxide nanoparticles by solgel method using titanium (IV) isopropoxide has been discussed. The synthesised products have been characterized by X-ray Diffraction studies (XRD), Field Emission Scanning Electron Microscopy (FE-SEM), Elemental analysis (EDXA), Ultra Violet Visible Spectroscopy (UV-vis), Photoluminescence Spectra (PL), High Resolution Transmission
Spectroscopy (HRTEM) and Fourier Transform Infra Red Spectroscopy (FT-IR). The synthesized TiO2
nanoparticles shows anatase crystal structure, when calcinated at 500° C and 600° C for 5 hours and TiO2
nanoparticles changed to rutile structure temperature increased to 700° C. The average particle sizes range from 30 to 47 nm determined by Debye-Scherrer formula. Elemental analysis was done by EDXA analysis which confirms no impurities present in the sample. UV-visible analysis revealed that calcination temperature
increases, the band gap decreases from 2.95 to 2.79 eV. The luminescence property of the TiO2 nanoparticles
was analysed by the photoluminescence spectrum, which confirms that direct recombination between electrons in the conduction band and holes in the valence band. FTIR analysis shows the bending and
stretching mode of Ti-O-Ti. HRTEM TiO2 nanoparticles shows spherical or nearly spherical with
approximately particles size of 35 nm to 50 nm. The Anticancer activity of pure TiO2 calcinated at 500° C,
600° C and 700° C has been explored.
Key words: TiO2, Solgel method, XRD, SEM, HRTEM, Anticancer activity.
1. Introduction
Titanium dioxide is naturally occurring in oxide of Titanium and it is also called Titania. The non-toxic property, light absorption, high chemical stability, high refractive index are some of the properties of titanium dioxide and it has relatively low-cost of production [1-3]. Titanium dioxide has been widely used in paints as a pigment and filler [4], ointments, toothpaste etc [5-7]. Normally, TiO2 exist in three forms, Rutile (Tetragonal, a=b=3.78A°, c=9.5A°),
Anatase (Tetragonal, a=b=3.78A°, c=9.5A°) and Brookite (Rhombohedral, a=5.43A°, b=9.16A°, c=5.13A°) forms. The phase transitions take place between various phases of TiO2 under heat and pressure. All crystalline forms TiO2 consist of
[TiO6]2- octahedral structure. Anatase form of TiO2 has a wider optical band gap (3.2 eV), a higher fermi level, a smaller
electron effective mass, and high mobility of charge carriers. But rutile phase is highly stable phase at high temperature [8]. The edges and corners of this structure have different manners, but the overall stoichiometry as TiO2 [9, 10].
Transformation of anatase-to-rutile is usually occurs at 600° C to 700° C [11, 12] and this phase transformation is non-reversible. Because, rutile phase possess greater thermodynamic stability compared to anatase phase [13, 14]. Nanoparticles of titanium dioxide play an important role in the fields of photo catalyst material for degradation of organic contaminants [15]. Generally, Titanium dioxide (TiO2) is used as a photo catalyst and as a self disinfecting material for
39 from water and air. It is also used in self-cleaning and self sterilizing surfaces for places in medical centres. The available general medicine which is used in the cancer treatment kills the diseased cell and normal human cell. Now, the researchers in the field of molecular nanobiotechnology focused in understanding the problem related to toxicity and their impact in environment of nano ranged materials. The results obtained from this study helpful to cure the cancer in the future. The properties and performance of TiO2 mainly depends on crystalline structure, size, and the morphology of
the particles [17-19]. So, there has been a variety of researchers focusing on the preparation of nanoparticles of TiO2
using ethanol along with different acid and bases for various applications.
In this study, simple and new way of synthesizing nano particles of TiO2 using titanium (IV) isopropoxide,
ethanol and hydroxylamine hydrochloride has been discussed. There are various Techniques have been employed for the characterization such as X-ray Diffraction (XRD), Field Emission Scanning Electron Microscopy (FESEM), Energy Dispersive X-ray Spectroscopy (EDXA), Ultraviolet-visible Diffuse Reflectance Spectroscopy (UV-vis), Photoluminescence Analysis (PL), Fourier Transform Infra Red Spectroscopy (FT-IR), and High Resolution Transmission Electron Microscopy (HRTEM).
2. Experimental 2.1. Materials
Titanium iso propoxide (Sigma-Aldrich >97 % pure), ethanol (Hayman (German) 99.99 % pure), hydroxylamine hydrochloride (Sigma-Aldrich, 99 % pure) were used as precursors and is used without any further purification. Doubly distilled water was used for the whole synthesis process.
2.2 Physicochemical characterization
The X-ray diffraction pattern analysis for pure TiO2 nanoparticles was recorded by Lab X XRD6000 Shimadzu
model with Cu-Ka radiation. The structure and morphology of the nanoparticles were investigated by Field Emission Scanning Electron Microscope (FESEM) using FEI Quanta FEG 200-High Resolution Scanning Electron Microscope. The absorption spectra and optical band gap of the TiO2 nanoparticles samples were measured by using UV-Vis
spectrophotometer (JASCO U-670 Spectrometer) and the alcohol as a solvent. The spectrum was recorded between 200-800 nm. A Photoluminescence spectrum was recorded between 370-770 nm and it was carried out by using Horiba Jobnyvon model spectrophotometer and the alcohol is used a solvent. FTIR absorption spectrum was recorded by JASCO FP 8200 spectrophotometer. The particle size and lattice structure of the individual crystal was visualised by using High Resolution Transmission Electron Microscopy JE2100 (JEOL-200KV, LB6 filament) and EDXA analysis was carriedout to find the composition of TiO2 samples by using the detector attached with the same instrument.
2.3. Synthesis of pure TiO2 nanoparticles
Aqueous solution of titanium (IV) isopropoxide (purity > 99.9 %) analar grade (Sigma-Aldrich) was used as starting material. Solgel is the most simple and sophisticated method proposed by Byun et.al, [20] among the various methods for producing nanoparticles. The sol was prepared by mixing Titanium iso propoxide with of ethanol and dissolved in 1000 ml of deionised water at room temperature. The molar ratio of titanium isopropoxide is 1:8 respectively. Hydroxylamine hydrochloride was dissolved in100 ml of deionised water and added gradually to the Titanium isopropoxide sol. After 30 minutes of vigorous stirring, the suspension was centrifuged and precipitate obtained was washed with single step deionised water. After centrifugation, the precipitate was dried at 105° C till the samples were converted into dry powder. The prepared samples were calcinated at 500° C, 600° C and 700° C for five hours at a constant temperature of 2° C/min.
2.4Anticancer activity
2.4.1Methodology for Cell line
The human cervical cancer cell line (HeLa) was obtained from National Centre for Cell Science (NCCS), Pune and grown in Eagles Minimum Essential Medium containing 10 % fetal bovine serum (FBS). The cells were maintained at 37° C, 5 % CO2, 95 % air and 100 % relative humidity. Maintenance cultures were passaged weekly, and the culture
medium was changed twice a week.
2.4.2Cell treatment procedure
The monolayer cells were detached with trypsin-ethylene diamine tetra acetic acid (EDTA) to make single cell suspensions and viable cells were counted using a hemocytometer and diluted with medium containing 5 % FBS to give final density of 1x10⁵ cells/ml. One hundred microlitres per well of cell suspension were seeded into 96-well plates at
plating density of 10,000 cells/well and incubated to allow for cell attachment at 37° C, 5 % CO2, 95 % air and 100 %
relative humidity. After 24 hours the cells were treated with serial concentrations of the test samples. They were initially dispersed in phosphate buffered saline (PBS) and an aliquot of the sample solution was diluted to twice the desired final maximum test concentration with serum free medium. Additional four serial dilutions were made to provide a total of five sample concentrations. Aliquots of 100µl of these different sample dilutions were added to the appropriate wells already containing 100 µl of medium, resulting in the required final sample concentrations. Following sample addition, the plates were incubated for an additional 48 hours at 37° C, 5 % CO2, 95 % air and 100 % relative humidity. The
medium containing without samples were served as control and triplicate was maintained for all concentrations.
40 TiO2 nanoparticles calcinated at 500° C, 600° C and 700° C was taken for anticancer assay. In brief, the cells
were seeded into 4 wells of a 96-well micro titer plate at 2 × 10⁴ cells per well with 100 μl growth medium and then incubated for 24 hours at 37° C under 5 % CO2. Later, the medium was removed while fresh growth medium containing
different calcinated TiO2 nanoparticles at 100, 50, 25, 2.5, 0.25 μg/ml were added. After 3 days of incubation at 37° C
under 5 % CO2, the medium was removed while 0.1 mg/ml MTT [3-(4, 5-dimethyl thiazole-2yl) - 2, 5-diphenyl
tetrazolium bromide] reagent was then added. After incubation for 5 hours at 37° C, the MTT [3-(4, 5-dimethyl thiazole-2yl)-2,5-diphenyl tetrazolium bromide] reagent was removed before adding 100 μl DMSO to each well and gently shaken. The absorbance was then determined by microplate reader at 570 nm. Control wells received only the media without the test samples. The conventional anticancer drug, cisplatin, was used as a positive control in this study. The inhibition of cell growth by TiO2 nanoparticles was calculated as a percent anticancer activity using the following
formula: Percent anticancer activity = 100- Abs (sample)/Abs (control) x100.
2.4.4 MTT assay
3-[4, 5-dimethylthiazol-2-yl] 2, 5-diphenyltetrazolium bromide (MTT) is a yellow water soluble tetrazolium salt. A mitochondrial enzyme in living cells, succinate-dehydrogenase, cleaves the tetrazolium ring, converting the MTT to an insoluble purple formazan. Therefore, the amount of formazan produced is directly proportional to the number of viable cells.
After 48 hours of incubation, 15 µl of MTT (5 mg/ml) in phosphate buffered saline (PBS) was added to each well and incubated at 37° C for 4 hours. The medium with MTT was then flicked off and the formed formazan crystals were solubilised in 100 µl of DMSO and then measured with the absorbance at 570 nm using micro plate reader. The percentage cell growth was then calculated with respect to control as follows
% Cell growth = [A] Test / [A]control x 100.
3. Result and discussion 3.1 X-Ray diffraction studies
Figure 2 shows XRD patterns of TiO2 samples calcinated at 500° C, 600° C and 700° C prepared by solgel
method. From the XRD pattern, it is clear that the TiO2 is in its anatase form, when it is calcinated at 500° C, 600° C.
Phase transformation to rutile form is identified in XRD results when calcination temperature increased to 700° C. The obtained 2θ values and corresponding (hkl) planes are 25.3°(101), 38°(004), 48°(200), 54°(105), 63°(204), 69.23°(116),70.89°(220),75.38°(215) respectively for TiO2 samples calcinated at 500° C, 600° C (JCPDS Card
No.21-1272). When calcination temperature increases to 700° C, shows the slight shifting of peaks at 27.3°,36°,41.2°,54°,69° (in figure 2(c)) corresponding to the hkl values (110), (101), (111), (210), (112) (JCPDS Card No.88-1175) indicate that phase has been changed from anatase into rutile. The preferred peak for 2θ value 25.3° was observed with corresponding plane (101), which is the strongest peak among other peaks for all the TiO2 nanoparticles calcinated at temperatures of
500° C, 600° C which is not available when the calcination temperature increased to 700° C, supports the changes in phase from anatase to rutile. The peaks of the graph are in good agreement with the literature report by Akarsu et al [21]. The average size of the particles was calculated using Debye-Scherrer’s formula. Crystallite size = 0.9λ/βcosθ,
Where β is the full width at half-maximum (FWHMhkl) of an hkl peak at 2θ value, θ is the half of the scattering
angle. From the Debye-Scherrer’s formula, the calculated particle size of TiO2 nanoparticles is approximately about 30,
37 and 47 nm respectively.
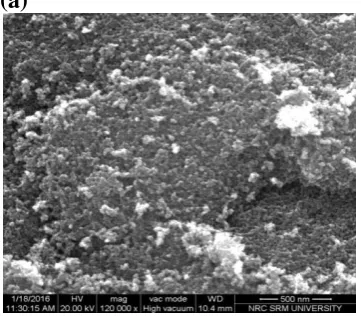
3.2 Field Emission Scanning Electron Microscope (FESEM)
Figure 3 shows FESEM pictures of the TiO2 nanoparticles. FESEM provides information about the surface
morphology. From the images, it has been confirmed that the grains of nanoparticles of TiO2 appear to be nearly
spherical and uniform sized particles and coherent together. However, the individual spherical particles are not clearly seen due to the nano-clusters formed during the growth.
3.3 Energy Dispersive Analysis by X-Rays (EDXA)
EDXA is used to analyze the chemical composition of a material. Figure 4 represents the EDXA of TiO2
nanoparticles prepared by solgel method. EDXA shows only peaks of titanium and oxygen. From figure 4(a, b and c), it is clear that TiO2 is free from impurities.
3.4 UV–Visible diffuse reflectance spectroscopy
The UV-Visible absorbance spectra of the TiO2 at different temperatures of 500° C, 600° C and 700° C are
shown in the figure 5 which shows the absorbance can be decreased at wavelength after 350 nm for intrinsic band gap absorbance of TiO2. This decrease in absorbance is due to electron transition from the valence band to the conduction
band and red shift in the absorbance edge was observed for TiO2 nanoparticles and is due to this change in surface
morphology, particles size [22] and also variation in the absorbance may be due to variation in the annealing temperature [23]. The band gap is determined by analysing the absorption of incident light by the nanomaterials. The band gap energy can be determined by extrapolation of the absorption edge onto the x-axis and by using the Planck’s equation, Eg=hC/λ
Where, Eg is the energy gap of pure TiO2 at absorption wavelength λ, h is the Planck’s constant, C is the
velocity of light. The calculated band gap value for TiO2 was calcinated at 500° C, 600° C and 700° C are 2.95 eV, 2,86
41 calcinated temperature 700° C shows lowest band gap (2.79 eV). In this temperature rutile phase is formed which has a bigger particle size [24].
3.5 Photoluminescence (PL) Study
The photoluminescence spectrum has been recorded for TiO2 nanoparticles prepared by solgel method and it is
shown in figure 6. The emission of first peak in the photoluminescence spectra obtained at three temperature of calcinations of TiO2 nanoparticles between 360 to 420 nm corresponds to the direct recombination between electrons in
the conduction band and holes in the valence band [25]. The presence of emission peaks in the visible region is due to the presence of defect levels below the conduction band. Similar peak has been observed in earlier work on TiO2 nano
particles [26]. The presence of broad peak in the visible region of PL spectrum indicates the presence of defect levels below the conduction band and the electronic transition takes place by defect levels such as oxygen vacancies in the band gap [27].
3.6 Fourier Transform Infrared Spectroscopy (FTIR)
An FTIR spectrum is used to determine the functional groups of titanium dioxide nanoparticles. In FTIR spectrum of titanium dioxide nanoparticles in which the peaks stretching vibration at 3523 cm-1 and bending vibration
1722.43 cm-1 in the spectra are due to –OH group shown in Figure 7. It shows peaks at 433 cm-1, 514 cm-1 to 700 cm-1
for bending and stretching mode of Ti-O-Ti. The samples after calcinations show that there was no peak at 2800 cm-1
which means that all organic compounds were removed from the titanium dioxide nanoparticles.
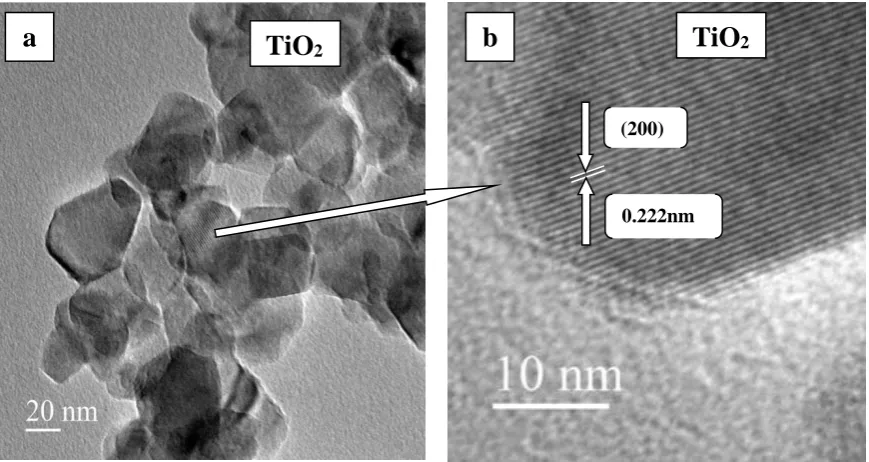
3.7 High Resolution Transmission Electron Microscopy (HRTEM)
The HRTEM was used to confirm the growth, distribution pattern of prepared nanoparticles and also confirm the size of nano particles by directly measured from the ruler of the images. In general, TiO2 nanoparticles have strong
tendency to agglomerates to form a larger particle. It can be confirmed by the TEM image of TiO2. The image 8 shows
that most of the TiO2 nanoparticles aggregates together and also spherical or nearly spherical and expand shaped particles
with approximately uniform size of 35 nm to 50 nm. This exhibit lattice fringes which was used to calculate d-spacing and found to be 0.222 nm. This d-spacing value has been compared with standard JCPDS data corresponds to the plane (200) of anatase.
3.8 Antcancer activity
The anticancer activity of the TiO2 nanoparticles at 500° C, 600° C, 700° C was used in anticancer assay [28,
29] method and cisplatin was used as standard. Figure 9 shows the percentage inhibition of TiO2 nanoparticles
calcinated at 500° C,600° C,700° C in 0.25, 2.5, 25, 50 and 100 μg/ml concentrations were increasing very small.
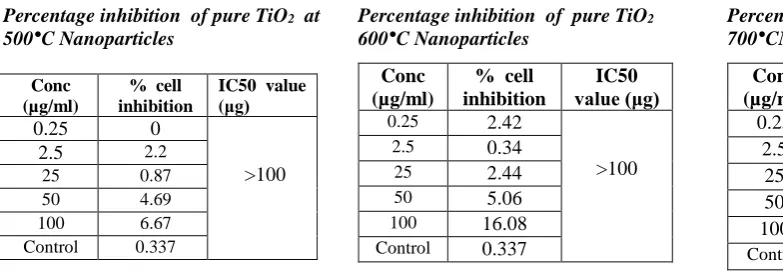
Percentage inhibition of pure TiO2 at 500°C Nanoparticles
Conc (µg/ml)
% cell inhibition
IC50 value (μg)
0.25 0
>100
2.5 2.2
25 0.87
50 4.69
100 6.67
Control 0.337
Percentage inhibition of pure TiO2 600°C Nanoparticles
Conc (µg/ml)
% cell inhibition
IC50 value (μg)
0.25 2.42
>100
2.5 0.34
25 2.44
50 5.06
100 16.08
Control 0.337
Percentage inhibition of pure TiO2 700°CNanoparticles
Conc (µg/ml)
% cell inhibition
IC50 value (μg)
0.25 0.77
>100
2.5 2.66
25 1.49
50 4.06
100 13.08
Control 0.337
Table 1 Percentage of inhibition and IC50 value for e TiO2 nanoparticles at various concentrations.
Table 1 shows the percentage of inhibition and IC50 value for TiO2 nanoparticles of different temperatures at
various concentrations. In this study, different temperature calcinated TiO2 nanoparticles were evaluated for preliminary
42
Figure 9 Percentage inhibitions of TiO2 nanoparticles at different temperatures
Conclusions
Titanium dioxide nanoparticles have been successfully synthesized with using of hydroxylamine hydrochloride as a hydrolysis catalyst. Anatase TiO2 is obtained by solgel method when calcinated at 500° C and 600° C for 5 hours
and converting it into rutile form when it is calcinated at 700° C for 5 hours. TiO2 nano particle size determined from
X-ray diffraction analysis is 30 nm, 37 nm and 47 nm. EDX Analysis shows that no impurities are present in the prepared TiO2 samples. UV-visible spectrum of TiO2 nanoparticles at three temperatures shows red shift in the absorbance edge
and is due to the change in surface morphology, particles size. The band gaps of nanoTiO2 measured by graphical method
are 2.95 eV, 2.86 eV and 2.79 eV. Photoluminescence study indicates that the strong emission peaks obtained in 383 nm, 385 nm and 385 nm region confirm direct recombination between electrons in the conduction band and holes in the valence band. High Resolution Transmission Electron Microscopy of TiO2 nanoparticles shows aggregate together and
also spherical or nearly spherical and expand shaped particles with approximately uniform size of 35 to 50 nm. FTIR spectrum analysis shows the peaks at 433 cm-1, 514 cm-1 to 700 cm-1 shows bending and stretching mode of Ti-O-Ti. The
results of anticancer activity of TiO2 at different temperatures show very small or no antitumor activity.
References
[1] P.V. Kamat, Photochemistry on nonreactive and reactive (semiconductor) surfaces, Chemical Review, 93(1) 267-300, 1999.
[2] A.Rammal, F.Brisach, M.Henry, C.R.Chimie, Hydrothermal synthesis of TiO2 anatasenanocrystals using
hexaprismatic-shaped oxo-carboxylate complexes, Comptes RendusChimie, 5(1), 59-66, 2002.
[3] Rubing Zhang, LianGao, Qinghong Zhang, Photodegradation of surfactants on the nanosized TiO2 prepared by
hydrolysis of the alkoxide titanium, Chemosphere, 54(3), 405-411, 2004.
[4] Krishnamurthy Prasad, D.V. Pinjari, A.B. Pandit, S.T. Mhaske, Phase transformation of nanostructured titanium dioxide from anatase-to-rutile via combined ultrasound assisted sol– gel technique, Ultrasonics Sonochemistry, 17(2), 409-415, 2010.
[5] Shuai Yuan, Wanhua Chen, Shengshui Hu, Fabrication of TiO2 nanoparticles /surfactant polymer complex film
on glassy carbon electrode and its application to sensing trace dopamine, Material Science Engineering C, 25(4), 479- 485, 2005.
[6] H.Juergen, Braun, AndrejsBaidins, Robert E. Marganski, TiO2 pigment technology: a review, Progress in
Organic Coatings, 20(2), 105-138, 1992.
[7] R.Zallen, M.P.Moret, The optical absorption edge of brookite TiO2, Solid state
Communications, 137(3), 154-157, 2006.
[8] K. Mogyorosi, I. Dekany, J. H. Fendler, Langmuir. 19(7), 2938, 2003.
[9] H.F.Mark, D.F.Othmer, C.G.Overberger, G.T.Seaberg (Eds), Encyclopedia of chemical Technology, John Wiley, New York, p.139, 1983.
[10] R.Weast, C Hand book of Chemistry and Physics, CRC Press Boca Raton FL, 1984.
[11] W.Czanderna, C.N. RamachandraRao, J.M. Honig, Transactions of the Faraday Society, 54,1069, 1958. [12] S.R.Yoganarasimhan, C.N.R.Rao, Transactions of the Faraday Society, 58, 1579, 1962.
TiO2 calcinated at 500°C
0.25 µg 2.5 µg
25 µg 50 µg
100 µg Control
TiO2 calcinated at 600°C TiO2 calcinated at 700°C
0.25 µg 2.5 µg 0.25 µg 2.5 µg
25 µg 50 µg 25 µg 50 µg
43 [13] D.J. Reidy, J.D. Holmes, M.A. Morris, Journal of the European ceramic society, 26(9), 1527, 2006.
[14] A.Navrotsky, O.J.Kleppla, Journal of the American Ceramic Society, 50(11) 626- 30.
[15] Desong Wang, Libin Xiao, QingzhiLuo, Xueyan Li, Jing An, YandongDuan, Highly efficient visible light TiO2
photocatalyst prepared by sol–gel method at temperatures lower than 300oC, Journal of Hazardous Materials,
192(1), 150-159, 2011.
[16] M.Alam Khan, M.ShaheerAkhtar, O-Bong Yang, Synthesis, characterization and application of sol–gel derived mesoporous TiO2 nanoparticles for dye-sensitized solar cells,Solar energy, 84(12), 2195-2201, 2010.
[17] L.Kavan, M.Gratzel, S.E.Gilbert, C.Klemenz, H.Scheel, Electrochemical and Photoelectrochemical Investigation of Single-Crystal Anatase, Journal of American Chemical Society. 118(28) 6716-6723, 1996. [18] R.Krol, A.Goossens, J.Schoonman, Mott‐Schottky, Analysis of Nanometer‐Scale thin‐Film Anatase TiO2,
Journal of Electrochemical Society, 144(5), 1723-1727,1997.
[19] G.C.Hadjipanayis, R.W.Siegel, eds., Nanophase Materials, Kluwer Academic Publishers, Dordrecht, NATO ASI Series, p. E 260, 1994.
[20] D.Byun, Y.Kim, K.Lee, P.Hofmann, Photocatalytic TiO2 deposition by chemical vapor deposition, Journal of
Hazardous Materials, 73(2),199-206, 2000.
[21] Murat Akarsu, Meltem Asilturk, Funda Sayilkan, Nadir Kiraz, Ertugrul Arpac, Hikmet Sayilk, A Novel Approach to the Hydrothermal Synthesis of anatase titania Nanoparticles and the Photocatalytic Degradation of Rhodamine B, Turkish Journal of Chemistry, 30(3), 333-343, 2006.
[22] T.S.Senthil, DongjinKima, N.Muthukumarasamy, Misook Kanga, Closely packed dense network rutile nanorods with gadolinium for efficient dye sensitized solar cells, Applied Surface Science, 313, 858–863, 2014. [23] S.V.Elangovan,V.Chandramohan, N.Sivakumar, T.S.Senthil, Synthesis and characterization of ZnO
nanoparticles at different molarity concentrations for photocatalytic applications. Desalination and water treatment, 1–8, 2015.
[24] Swapan. K.Das, K.Manas. Bhunia and Asim Bhaumik, Self-assembled TiO2 nanoparticles: mesoporosity,
optical and catalytic properties,Dalton Trans., The Royal Society of Chemistry, 39, 4382–4390, 2010.
[25] J.Liqiang, S.Xianojun, X.Baiqi, C.Weimin and F.Honggang, The preparation and characterization of La doped TiO2 nanoparticles and their photocatalytic activity, Journal of Solid State Chemistry, 177 3375-3382, 2004.
[26] R.Vijayalakshmi and V.Rajendran, Synthesis and characterization of nano-TiO2 via different methods,
Archives of Applied Science Research, 4(2), 1183- 1190, 2012.
[27] Y. Zhao, C.Z. Li, X. H. Liu, F. Gu, H. B. Jiang, W. Shao, L. Zhang, and Y. He, Synthesis and optical properties of TiO2 nanoparticles, Material Letter, 6, 79-83, 2007.
[28] T.Mosmann, Rapid colorimetric assay for cellular growth and survival: application to proliferation and cytotoxicity assays. Journal of Immunological Methods, 65, 55-63, 1983.
44
Figure1 Crystal structures of TiO2 rutile, anatase and brookite phase
20 40 60 80 100 100 200 300 400 500 600 700 800 In te n si ty ( C o u n ts )
Two theta(2)
(004) (215) (220) (116) (204) (105) (200) (101) (a)
10 20 30 40 50 60 70 80 90 200 400 600 800 1000 1200 1400 1600 1800 (215) (004) (111) (110) (b) (220) (112) (200) (105) (204) (101) (101) In te n si ty ( C o u n ts )
Two theta(2)
20 40 60 80 100
200 400 600 800 1000 1200 1400 1600 (c) In te n si ty ( C o u n ts )
Two theta(2)
(204) (112) (210) (111) (101) (110)
45
(a)
(b)
(c)
Figure3 FESEM images of TiO2 samples calcinated at (a) 500° C (b) 600° C (c) 700° C
(a)
(b)
(c)
46
200 300 400 500 600 700 800
0.0 0.2 0.4 0.6 0.8 1.0 A b so rb a n ce ( a .u .) Wavelength(nm)
TiO2 Calcinated at 500oC
TiO2 Calcinated at 600oC
TiO2 Calcinated at 700oC
Figure 5 UV-Vis diffuse reflectance spectra of TiO2 samples calcinated at 500° C, 600°C and 700° C
320 340 360 380 400 420 440
0 50 100 150 200 In te n si ty wavelength(nm) TiO
2 calcinated at 500 o
C
TiO
2 calcinated at 600 o
C
TiO
2 calcinated at 700 o
C
Figure 6 Photoluminescence spectrum of TiO2 samples calcinated at 500° C, 600° C and 700° C
4000 3000 2000 1000 0 10 20 30 40 50 60 70 80 90 100 % T ra n sm it ta n ce ( a .u .)
Wavenumber(cm-1)
TiO2 calcinated at 500o C TiO2 calcinated at 600o
C TiO2 calcinated at 700o
C
47
Figure 8 High Resolution Transmission Electron Microscopy image of TiO2 prepared by sol-gel method