Effect of pre-processing conditions on oil point pressure of sheanut
(Vitellaria paradoxa) kernel
N. A. Aviara
1*, C. G. Ojiofor
1, O. K. Owolarafe
2, B. S. Ogunsina
2and F. A. Oluwole
3(1. Department of Agricultural and Environmental Resources Engineering, University of Maiduguri, Maiduguri 600230, Nigeria;
2. Department of Agricultural and Environmental Engineering, Obafemi Awolowo University, Ile-Ife 220282, Nigeria; 3. Department of Mechanical Engineering, University of Maiduguri, Maiduguri 600230, Nigeria)
Abstract: Oil point pressure of sheanut kernel was determined under different pre-processing conditions of moisture content, heating temperature, heating time and particle size. Results show that the pressure decreased as moisture content increased from 4% to 6%, and thereafter, increased with further increase in moisture content. It equally decreased with increase in temperature and heating time. Highest oil point pressure value was 2.6389 MPa for coarse kernel particles at 4% moisture content heated at 50oC for 5 min, and 1.5554 MPa for fine particles at 10% moisture content heated at 50°C for 5 min. Lowest value for coarse and fine kernel particles was 0.929 MPa and 0.6380 MPa respectively and this was obtained at the conditions of 6% moisture content, 100oC and 15 min heating time. Analysis of Variance (ANOVA) showed that all the pre-processing variables and their interactions significantly affected the oil point pressure of at 1% level of significance. This was confirmed using response surface methodology. Multiple regression analysis yielded equations that expressed oil point pressure as a function of kernel moisture content, heating temperature and heating time. The models yielded coefficients that enabled oil point pressure of the kernel to be predicted with high coefficient of determination.
Keywords: sheanut, seed oil expression, oil seed processing, oil point pressure, moisture content
Citation: Aviara, N. A., C. G. Ojiofor, O. K. Owolarafe, B. S. Ogunsina, and F. A. Oluwole. 2020. Effect of pre-processing conditions on oil point pressure of sheanut (Vitellaria paradoxa) kernel. Agricultural Engineering International: CIGR Journal, 22(2): 172-185.
1 Introduction
Shea tree (Vittellaria) belonging to the family
Sapotaceae with sub species paradoxa and nilotica is a
perennial and deciduous tree which grows naturally
throughout the Guinea Savannah region. Shea trees in
Nigeria grow naturally in the wild and thrive almost
Received date: 2017-03-25 Accepted date: 2020-03-07
*Corresponding author: N. A. Aviara, Professor, Department of Agricultural and Environmental Resources Engineering, University of Maiduguri, Maiduguri, Nigeria. Tel: +234 803 492 2425. Fax: NIL. Email: [email protected].
exclusively in the North. In general, trees do not usually
yield fruit until they are 20 years old (Fleury, 2000).
However, once productive, they will continue to bear fruits
up until their 200th year. Shea tree is an important
economic crop because of the heavy demand for its butter
in the international market mainly as a substitute for cocoa
butter in the production of chocolate (Nikiema and Umali,
2007).
The tree is mainly important for its nut which contains a
kernel with an oil content ranging from 45% to 60%
(Opeke, 1992). The oil, known as shea butter, is used in the
products and butter substitutes. The kernel used for oil
expression is obtained from the nut by cracking with stones,
mortar and pestle. In the traditional process of extracting
the oil, the kernel is subjected to a series of operations
which include steeping, roasting, pounding or grinding, and
boiling (Maranz et al., 2004a, 2004b).
Technologies used for extracting vegetable oil including
shea butter are traditional boiling, mechanical pressing and
solvent extraction (USAID, 2004). However, shea butter
has been processed by indigenous traditional boiling
method which has been described as labour intensive
(Master and Puga, 1994). This has made the quality of
indigenous traditionally extracted shea butter variable
(FAO and CFC, 2005). Expressing oil from sheanut kernel
traditionally involves roasting of the kernels with sand and
ash before crushing in a local wooden mortar and thereafter
milled on grinding stone. The paste is boiled in water until
the fat begins to float on surface. After extraction, the butter
or oil is transferred into storage plastic or glass containers.
The above operations as presently carried out are labour
intensive and time consuming. There is therefore the need
to develop a machine that would efficiently express oil
from sheanut kernel.
Oil expression is a consolidation and compression
process as a result of applied pressure. There is reduction in
volume which causes the oil to seep out of the compressed
seed (Sivala et al., 1991). Seed oil expression has been
analysed as a drained consolidation process in terms of
stress-strain response of the seed bed and the dynamics of
oil flow (Faborode and Favier, 1997). Tunde-Akintunde et
al. (2001) noted that in Nigeria, small and medium scale
production of vegetable oil is carried out using either
mechanical expression (oil removal using machines) or
extraction (oil removal using solvents). However,
expression is preferred to extraction because it is not only
more economical but also yields an end product that is free
of dissolved chemicals, which makes it an inherently safer
process (Khan and Hanna, 1983).
The pressure at which oil comes out of the inter-particle
voids of an oil seed is known as oil point pressure. It
indicates the threshold pressure at which oil emerges from a
seed kernel during mechanical oil expression (Ajibola et al.,
2002). The oil point pressure determines the effectiveness
of an expression operation because subsequent flow and
yield of oil are triggered by pressure applied beyond the oil
point pressure (Olatunde and Owolarafe, 2011). Certain
pretreatment operations known to influence oil yield in
mechanical oil expression include heat treatment, moisture
conditioning and size reduction (Adeeko and Ajibola, 1990;
Ajibola et al., 1993, 2000; Dedio and Dornell, 1977;
Hamzat and Clarke, 1993; Oyinlola et al., 2004). Heat
treatment of oil seed has been observed to rupture the oil
bearing cells of the seed, coagulate the protein in the meal,
adjust the moisture level of the meal to optimum level for
oil expression, lower the viscosity and increase the fluidity
of the oil to be expelled and destroy mould and bacteria
thereby facilitating oil expression from the material
(Adeeko and Ajibola, 1990). The optimum heating
temperature for most oil seeds has been observed to be in
the range of 90oC -110oC at an average retention time of 20
min (FAO, 1989). Norris (1964) reported that size
reduction, heat treatment and application of pressure are
required for efficient oil expression from oil seeds with
large particle sizes. Dedio and Dornell (1977) found that
increasing the moisture content of flake seed from 8% to
16% decreased the oil yield.
Several investigations have been carried out on effect of
processing parameters on the oil point pressure of oil seeds.
These include studies on the oil point pressure of rape seed
(Sukumaran and Singh, 1989), sesame seed (Ajibola et al.,
2000), soyabean (Ajibola et al., 2002), locust bean
(Owolarafe et al., 2003), cashew kernels (Ogunsina et al.,
2008), melon seeds (Tunde-Akintunde 2010), neem seed
(Olatunde and Owolarafe, 2011), Indian almond kernels
(Aregbesola et al., 2012) and moringa oleifera seeds
(Aviara et al., 2015). Studies on the oil point pressure of
sheanut kernel, however, appear not to have been carried
out. The objective of this study, therefore, was to determine
the oil point pressure of sheanut kernel and investigate the
content, heating temperature and heating time on the oil
point pressure.
2 Materials and methods
2.1 Material procurement and preparation
The bulk quantity of sheanut used in this study was
procured from a farm in Saki, Saki-East Local Government
Area of Oyo State, Nigeria. The nuts were cleaned and
sorted to remove foreign materials. They were manually
cracked to obtain the kernels. A mortar and pestle was used
to reduce the kernel sizes, which were passed through
standard sieves to classify them into coarse and fine
aggregates. Coarse particle passed through 4.7 mm sieve
aperture while the fine particle passed through 2.36 mm
aperture. The coarse and fine particles appear as shown in
Figure 1.
(a) (b)
Figure 1 Sheanut kernel aggregates, a: coarse particle, b: fine particle
2.2 Moisture content determination and adjustment
The initial moisture content of the sheanut kernels was
determined by heating 30 g of the kernel in triplicates at
130oC for six hours (ASAE, 1982). The moisture content
was calculated using the following expression:
𝑀𝐶𝑤𝑏= 𝑀𝑎𝑀−𝑀𝑎 𝑏𝑥100
(1)
where; MC
wbis moisture content wet basis (%),
M
ais mass of sample prior to heating (g) and M
bis
mass of sample after heating (g).
The average value of the moisture content was
recorded.
In addition to samples at the initial moisture
content, kernels at three different moisture levels
were obtained through moisture adjustment which
was carried out by the addition of calculated amount
of water to the sample at the initial moisture content
to raise it to the required moisture level. The amount
of water that was added was determined using the
expression:
𝑀=𝑊2((100−𝑀𝑀2−𝑀12))
(2)
where: M is mass of water to be added (g),
W2is
mass of the sample (g), M
2is expected moisture
content (%) and M
1is initial moisture content (%).
Samples at different moisture levels were sealed in
labelled polyethylene bags and kept in a freezer under a
temperature of 10°C for 72 hours. This enabled the samples
to attain stable and uniform moisture contents (Adebona et
al., 1986; Singh et al., 2004; Aviara et al., 2015).
2.3 Heat treatment and duration
Samples of sheanut kernels at different moisture
contents in sample trays were heated in an oven at the
temperatures of 50°C, 70°C, 85°C and 100°C respectively,
each for the durations of 5, 10, and 15 minutes.
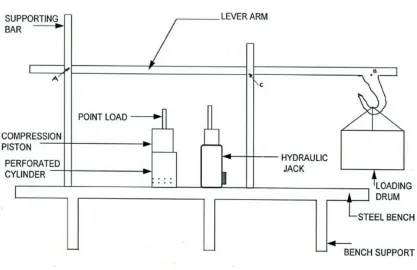
2.4 Oil point pressure determination
The oil point pressure of sheanut kernel was identified
using the method that was applied by Ajibola et al. (2002)
on soyabean, Owolarafe et al. (2003) on locust bean,
Tunde-Akintunde (2010) on melon seeds and Aviara et al.
(2015) on moringa oleifera seeds. Prior to the experiment,
the kernel samples were removed from the freezer and
allowed to equilibrate at ambient condition for 24 hours.
After this, the sample of either coarsely or finely ground
kernels at specified moisture level, heating temperature and
heating time was used to fill a cylindrical container which
had several 2 mm holes drilled at the base to allow oil
strips of tissue paper to enable the oil to be spotted when
the oil point was attained. The content of the perforated
cylinder was pressed using the laboratory press that is
diagrammatically presented in Figure 2. The lever which
served as a pressure transfer medium had a dead weight of
90 kg and an effective length of 3000 mm. The pressure
transferred from the lever arm to the sample in the test
cylinder through the point load and compression piston was
varied by moving the cylinder and its content along the
lever arm. The test cylinder was a 50 mm long galvanized
steel pipe with an internal diameter of 40 mm. The cylinder
had one of its ends closed with a 12 mm thick metal base
with 2 mm holes drilled at a pitch of 15 mm. The
compression piston was a solid steel cylinder, 70 mm long
and 39 mm in diameter. A 20 metric tonnes hydraulic jack
was used to raise and lower the lever bar for applying
pressure to the sample. The cylinder containing the sample
was placed under the compression piston. The jack was
released gently to allow the suspended lever arm to lower
down gradually to rest on the pressing ram and
compression piston. The jack was then used to lift the lever
arm in order to remove the cylinder and piston. After each
pressing operation, the tissue paper strips in the holes of the
cylinder were removed and examined for oil marks (which
was an indicator of whether the pressure at that point due to
the load was sufficient to bring oil out of the kernel or not.
The distance from this point to the support was measured
and converted to pressure using the principle of moment of
forces.
Figure 2 Laboratory oil expression press
2.5 Statistical analysis
The data obtained was subjected to Analysis of
Variance (ANOVA) in a completely randomized factorial
design using IBM SPSS statistics 20. Comparison of means
was carried out using Turkey’s test and Duncan’s Multiple
Range Analysis at the 99% confidence level. Response
Surface Methodology was applied using the Design Expert
software and multiple regression analysis was conducted to
establish the model that expresses the relationship existing
between the oil point pressure of sheanut kernel and the
3 Results and discussion
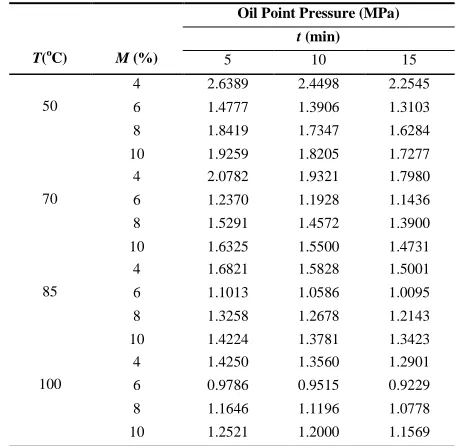
The results of the mean oil point pressure (P) of coarse
and finely ground sheanut kernel at different pre-pressing
conditions namely moisture content (M), heating
temperature (T) and heating time (t) are presented in Tables
1 and 2 respectively.
Table 1 Oil point pressure of coarsely ground sheanut kernel at
different moisture contents, temperatures and heating times
T(oC) M (%)
Oil Point Pressure (MPa)
t (min)
5 10 15
50
4 2.6389 2.4498 2.2545
6 1.4777 1.3906 1.3103
8 1.8419 1.7347 1.6284
10 1.9259 1.8205 1.7277
70
4 2.0782 1.9321 1.7980
6 1.2370 1.1928 1.1436
8 1.5291 1.4572 1.3900
10 1.6325 1.5500 1.4731
85
4 1.6821 1.5828 1.5001
6 1.1013 1.0586 1.0095
8 1.3258 1.2678 1.2143
10 1.4224 1.3781 1.3423
100
4 1.4250 1.3560 1.2901
6 0.9786 0.9515 0.9229
8 1.1646 1.1196 1.0778
10 1.2521 1.2000 1.1569
Table 2 Oil point pressure of finely ground sheanut kernel at
different moisture contents, temperatures and heating times
T (oC) M (%)
Oil point pressure (MPa)
t (min)
5 10 15
4 1.0934 1.0518 1.0202
50 6 0.8416 0.8197 0.7988
8 1.4224 1.3565 1.2970
10 1.5554 1.4582 1.3924
4 0.9931 0.9657 0.9380
70 6 0.7778 0.7582 0.7396
8 1.2352 1.1834 1.1345
10 1.3157 1.2735 1.2148
4 0.9125 0.8924 0.8658
85 6 0.7209 0.7032 0.6857
8 1.0918 1.0487 1.0121
10 1.1496 1.1082 1.0640
4 0.8409 0.8194 0.7974
100 6 0.6682 0.6534 0.6380
8 0.9761 0.9433 0.9114
10 1.0640 1.0330 1.0011
From Table 1, it can be seen that within the ranges of
processing conditions studied, the oil point pressure of
coarsely ground sheanut ranged from 0.9229 MPa at the
moisture content of 6%, heating temperature of 100°C and
heating time of 15 min to 2.6389 MPa at the moisture
content, heating temperature and heating time of 4.00%,
50°C and 5 min respectively.
Table 2 shows that oil point pressure of finely ground
sheanut kernel ranged from 0.6682 MPa at the moisture
content of 6%, heating temperature of 100°C and heating
time of 15 min to 1.5554 MPa at 10% moisture content,
50°C heating temperature and heating time of and 5 min.
3.1 Effect of pre-processing conditions on oil point
pressure of coarse aggregates of sheanut kernel
The response of the oil point pressure of coarsely
ground sheanut kernel to variation in moisture content and
heating time at 50oC is presented in Figure 3. The figure
shows that the oil point pressure of coarsely ground sheanut
kernel decreased with increase in moisture content from 4%
to 6% to a minimum value and thereafter increased with
further increase in moisture content for the heating times of
5, 10 and 15 min respectively. This may be an indication
that some level of moisture presence is necessary for the
transport of oil from the oil bearing cells and it suggests
that 4% moisture content might have been too low for oil to
flow out readily. This is in agreement with the findings of
other investigators (Adeeko and Ajibola, 1990; Ajibola et
al., 1993; Fasina and Ajibola, 1989; Owolarafe et al., 2003)
on oil expression from groundnut, sesame seed, conophor
nut and locust bean, respectively. The increase in oil point
pressure after a moisture level was attained could be due to
the cushioning effect of mucilage developed at higher
moisture levels. The mucilage must have consumed some
of the energy generated by pressure applied during the
compression of the material to force the oil out of the cells,
thereby increasing the oil point pressure (Ajibola et al.,
2002; Tunde-Akintunde, 2010). Similar trend of oil point
pressure with moisture content to that which is shown in
Figure 3 was exhibited by the coarsely ground kernel at the
heating temperatures of 70oC, 85oC and 100oC respectively.
Oil point pressure decreased with increase in heating
obtained by Sukumaran and Singh (1989), Ajibola et al.
(1993), Ajibola et al. (2002), Owolarafe et al. (2003),
Ogunsina et al. (2008), Tunde-Akintunde (2010),
Aregbesola et al. (2012), Aviara et al. (2015) on rape seed,
conophor seed, sesame seeds, soya bean, locust bean,
cashew nut, melon seed, Indian almond kernels and
moringa oleifera seeds respectively. The decrease in oil
point pressure with increase in heat treatment can be
attributed to the fact that heating for long periods results in
moisture adjustment (Olatunde and Owolarafe, 2011),
reduction of viscosity, which enabled the oil to flow easier
from the cell structure (Tunde-Akintunde, 2010) and
protein coagulation which is one of the factors necessary
for oil expression (Khan and Hanna, 1983; Adeeko and
Ajibola, 1990).
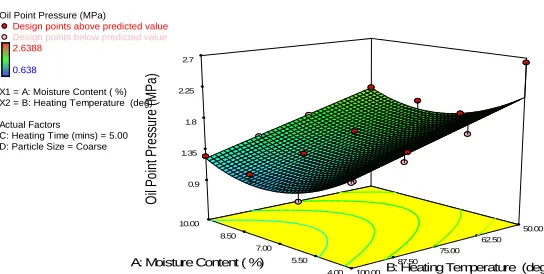
The response of oil point pressure to heating
temperature and moisture variation at the heating time of 5
min for coarsely ground sheanut kernel is presented in
Figure 4. The figure reveals that the oil point pressure of
coarsely ground sheanut kernel decreased with increase in
heating temperature at constant heating time. Similar trend
of oil point pressure with heating temperature and moisture
content to that which is shown in Figure 4 was exhibited by
the kernel at the heating times of 10 and 15 min. The
response of the oil point pressure of coarsely ground
sheanut kernel to heating time and heating temperature at
4% moisture content (Figure 5) shows that oil point
pressure decreased with increase in heating time. Similar
trend of oil point pressure with heating time to that which is
shown in Figure 5 was exhibited by the kernel at the
moisture contents of 6%, 8% and 10% respectively.
Figure 3 Response surface of oil point pressure of coarsely ground sheanut kernel to moisture content and heating time at 50oC
Figure 4 Response surface of oil point pressure of coarsely ground sheanut kernel to heating temperature and moisture content at 5 min
Design-Expert® Software
Oil Point Pressure(MPa)
Design points above predicted value Design points below predicted value 2.6388
0.638
X1 = A: Moisture Content (%) X2 = C: Heating Time(mins)
Actual Factors
B: Heating Temperature (deg) = 50.00 D: Particle Size = Coarse
4.00 5.50
7.00
8.50
10.00 5.00 7.50
10.00 12.50 15.00 1.3
1.65 2 2.35
2.7
Oi
l P
oi
nt
P
res
sur
e(
M
P
a)
A: Moisture Content (%)
C: Heating Time(mins)
Design-Expert® Software
Oil Point Pressure (MPa) Design points above predicted value Design points below predicted value 2.6388
0.638
X1 = A: Moisture Content ( %) X2 = B: Heating Temperature (deg)
Actual Factors
C: Heating Time (mins) = 5.00 D: Particle Size = Coarse
4.00 5.50 7.00 8.50 10.00
50.00 62.50 75.00 87.50 100.00 0.9
1.35 1.8 2.25 2.7
Oi
l P
oi
nt
P
res
sur
e
(M
P
a)
Figure 5 Response surface of oil point pressure of coarsely ground sheanut kernel to heating time and heating temperature at 4% moisture content
3.2 Effect of pre-processing conditions on oil point
pressure of fine aggregates of sheanut kernel
The oil point pressure of finely ground sheanut kernel at
50oC (Figure 6) decreased remarkably with increase in
moisture content from 4% to 6% to a minimum value and
thereafter increased notably with further increase in
moisture content for the heating times of 5, 10 and 15 min
respectively. Similar trend of oil point pressure with
moisture content to that which is shown in Figure 6 was
exhibited by the kernel at the heating temperatures of 70oC,
85oC and 100oC respectively.
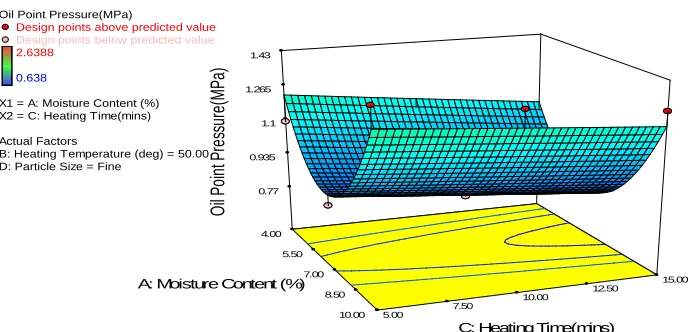
The response of oil point pressure of finely ground
sheanut kernel to heating temperature and moisture
variation at the heating time of 5 min is presented in Figure
7. This figure shows that the oil point pressure decreased
with increase in heating temperature at constant heating
time. Similar trend of oil point pressure with heating
temperature and moisture content to that which is shown in
Figure 7 was exhibited by the kernel at the heating times of
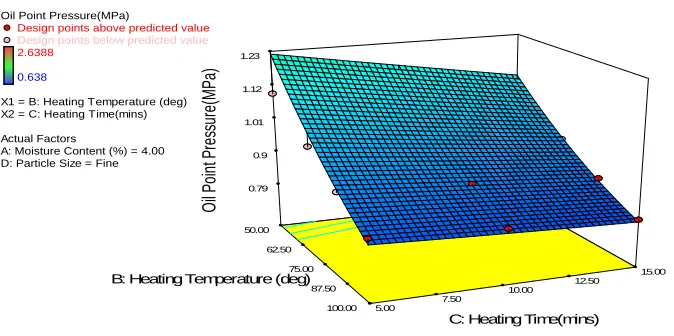
10 and 15 min. The response of the oil point pressure of
finely ground sheanut kernel to heating time and heating
temperature at 4% moisture content presented in Figure 8
shows that oil point pressure decreased with increase in
heating time. Similar trend of oil point pressure with
heating time to that which is shown in Figure 8 was
exhibited by the kernel at the moisture contents of 6%, 8%
and 10% respectively.
Design-Expert® Software
Oil Point Pressure(MPa)
Design points above predicted value
Design points below predicted value
2.6388
0.638
X1 = B: Heating Temperature (deg) X2 = C: Heating Time(mins)
Actual Factors
A: Moisture Content (%) = 4.00 D: Particle Size = Coarse
50.00
62.50
75.00
87.50
100.00 5.00
7.50
10.00
12.50
15.00 1.2
1.575 1.95 2.325 2.7
Oi
l P
oi
nt
P
res
sur
e(
M
Pa
)
B: Heating Temperature (deg)
C: Heating Time(mins)
Design-Expert® Software
Oil Point Pressure(MPa)
Design points above predicted value
Design points below predicted value
2.6388
0.638
X1 = A: Moisture Content (%) X2 = C: Heating Time(mins)
Actual Factors
B: Heating Temperature (deg) = 50.00 D: Particle Size = Fine
4.00
5.50
7.00
8.50
10.00 5.00
7.50 10.00
12.50
15.00 0.77
0.935 1.1 1.265
1.43
Oi
l P
oi
nt
P
res
sur
e(
M
Pa
)
A: Moisture Content (%)
Figure 6 Response surface of oil point pressure of finely ground sheanut kernel to moisture content and heating time at 50oC
Figure 7 Response surface of oil point pressure of finely ground sheanut kernel to heating temperature and moisture content at 5 min
Figure 8 Response surface of oil point pressure of finely ground sheanut kernel to heating time and heating temperature at 4% moisture content
3.3 Effect of particle size on oil point pressure of
sheanut kernel
The effect of particle size on the oil point pressure of
sheanut kernel at different processing conditions considered
namely; moisture content (M), heating temperature (T) and
heating time (t) are presented in Figures 9, 10 and 11.
Figure 9 shows the variation of oil point pressure of sheanut
kernel with particle size and moisture content at the heat
temperature and heating time of 50oC and 5 min
respectively. From this Figure, it can be seen that the oil
point pressure of coarsely ground sheanut kernel was higher
than that of the fine particle at each moisture content.
Similar trend to that observed in Figure 9 was exhibited by
the kernel at other temperature and heating time levels.
The variation of oil point pressure of sheanut kernel
with particle size and heating temperature at the moisture
content of 4% and heating time of 5 min is presented in
Figure 10. The figure shows that the oil point pressure of
coarsely ground sheanut kernel was higher than that of the
fine particle size at each heating temperature. Similar result
was observed at other levels of moisture content and
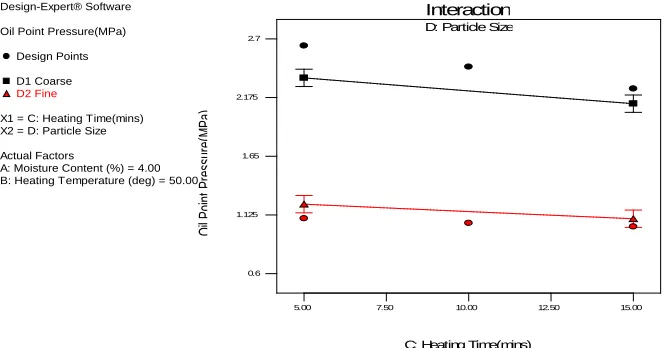
heating time. Figure 11 shows the variation of oil point
pressure of sheanut kernel with particle size and heating
time at the moisture content and heating temperature of 4%
and 50oC respectively. From the figure, it can be seen that
the oil point pressure of coarsely ground sheanut kernel was
Design-Expert® Software
Oil Point Pressure (MPa)
Design points above predicted value
Design points below predicted value
2.6388
0.638
X1 = A: Moisture Content ( %) X2 = B: Heating Temperature (deg)
Actual Factors
C: Heating Time (mins) = 5.00 D: Particle Size = Fine
4.00 5.50 7.00 8.50 10.00
50.00 62.50 75.00 87.50 100.00 0.6
0.925 1.25 1.575 1.9
Oi
l P
oi
nt
P
res
sur
e
(M
P
a)
A: Moisture Content ( %) B: Heating Temperature (deg)
Design-Expert® Software
Oil Point Pressure(MPa)
Design points above predicted value Design points below predicted value 2.6388
0.638
X1 = B: Heating Temperature (deg) X2 = C: Heating Time(mins)
Actual Factors
A: Moisture Content (%) = 4.00 D: Particle Size = Fine
50.00 62.50
75.00
87.50 100.00 5.00
7.50 10.00 12.50
15.00 0.79
0.9 1.01 1.12 1.23
Oi
l P
oi
nt
P
res
sur
e(
M
Pa
)
B: Heating Temperature (deg)
higher than that of the fine particle at each heating time.
Similar trend was observed at other moisture content and
heating temperatures.
Figure 9 Variation of oil point pressure of sheanut kernel with particle size for different moisture contents at 50oC heating temperature and heating time of 5 min
Figure 10 Variation of oil point pressure of sheanut kernel with particle size for different heating temperatures at 4% moisture content and heating time of 5 min
Figure 11 Variation of oil point pressure of sheanut kernel with particle size for different heating times at 4% moisture content and heating temperature of 50oC
Design-Expert® Software
Oil Point Pressure(MPa)
Design Points
D1 Coarse D2 Fine
X1 = A: Moisture Content (%) X2 = D: Particle Size
Actual Factors
B: Heating Temperature (deg) = 50.00 C: Heating Time(mins) = 5.00
D: Particle Size
4.00 5.50 7.00 8.50 10.00
Interaction
A: Moisture Content (%)
O
il
P
oi
nt
P
res
sur
e(
M
P
a)
0.6 1.125 1.65 2.175 2.7
Design-Expert® Software
Oil Point Pressure(MPa)
Design Points
D1 Coarse
D2 Fine
X1 = B: Heating Temperature (deg) X2 = D: Particle Size
Actual Factors
A: Moisture Content (%) = 4.00 C: Heating Time(mins) = 5.00
D: Particle Size
50.00 62.50 75.00 87.50 100.00
Interaction
B: Heating Temperature (deg)
O
il
P
oi
nt
P
res
sur
e(
M
P
a)
0.6 1.125 1.65 2.175 2.7
Design-Expert® Software
Oil Point Pressure(MPa)
Design Points
D1 Coarse D2 Fine
X1 = C: Heating Time(mins) X2 = D: Particle Size
Actual Factors
A: Moisture Content (%) = 4.00 B: Heating Temperature (deg) = 50.00
D: Particle Size
5.00 7.50 10.00 12.50 15.00
Interaction
C: Heating Time(mins)
O
il
P
oi
nt
P
res
sur
e(
M
P
a)
3.4 ANOVA for coarse particle size of sheanut kernel
The ANOVA of oil point pressure with pre-processing
conditions for coarse particle size kernel is presented in
Table 3. From this table, it can be seen that oil point
pressure varied significantly with coarse particle moisture
content (M), heating temperature (TE) and heating time (t)
at 1% level of significance. The interactions between the
pre-processing conditions namely M×TE, M×t and TE×t
showed significant effect on oil point pressure at 1% level
of significance. This implies that oil point pressure was
significantly affected by all the pre-processing parameters
studied.
Table 3 ANOVA of sheanut kernel oil point pressure with
pre-processing conditions for coarse particle size
Source Type III Sum of
Squares
Df Mean
Square
F Sig.
Corrected
Model
20.252a 47 0.431 375.208 0.000
Intercept 309.713 1 309.713 2.697E5 0.000
M 8.672 3 2.891 2.517E3 0.000
TE 9.625 3 3.208 2.794E3 0.000
T 0.574 2 0.287 249.834 0.000
M ×TE 1.219 9 0.135 117.909 0.000
M × t 0.071 6 0.012 10.237 0.000
TE×t 0.077 6 0.013 11.197 0.000
M×TE×t 0.015 18 0.001 0.743 0.759
Error 0.110 96 0.001
Total 330.075 144
Corrected Total
20.362 143
Note: Dependent variable: P, R Squared=0.995 (Adjusted R Squared=0.992),
M=moisture content (%), TE=temperature (°C), t =heating time (minutes)
Table 4 Multiple range comparison of coarsely ground sheanut
kernel oil point pressure with respect to moisture content
M N Subset
1 2 3 4
Tukey HSDa 6 36 1.1479
8 36 1.3959
10 36 1.4901
4 36 1.8323
Sig. 1.000 1.000 1.000 1.000
Duncana 6 36 1.1479
8 36 1.3959
10 36 1.4901
4 36 1.8323
Sig. 1.000 1.000 1.000 1.000
Note: Means for groups in homogeneous subsets are displayed, based on observed
means. Error term is Mean Square (Error) = 0.001. a. Uses Harmonic Mean Sample
Size = 36.000
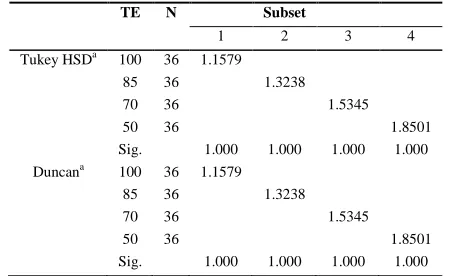
Table 5 Multiple range comparison of coarsely ground sheanut
kernel oil point pressure with respect to heating temperature
TE N Subset
1 2 3 4
Tukey HSDa 100 36 1.1579
85 36 1.3238
70 36 1.5345
50 36 1.8501
Sig. 1.000 1.000 1.000 1.000
Duncana 100 36 1.1579
85 36 1.3238
70 36 1.5345
50 36 1.8501
Sig. 1.000 1.000 1.000 1.000
Note: Means for groups in homogeneous subsets are displayed, based on observed
means. Error term is Mean Square (Error) = 0.001. a. Uses Harmonic Mean Sample
Size = 36.000
Table 6 Multiple range comparison of sheanut kernel oil point
pressure with respect to heating time of coarse particle size of
sheanut
T N Subset
1 2 3
Tukey HSDa 15 48 1.3900
10 48 1.4651
5 48 1.5446
Sig. 1.000 1.000 1.000
Duncana 15 48 1.3900
10 48 1.4651
5 48 1.5446
Sig. 1.000 1.000 1.000
Note: Means for groups in homogeneous subsets are displayed, based on observed
means. Error term is Mean Square (Error) = 0.001. a. Uses Harmonic Mean Sample
Size = 48.000
The Tukey and Duncan separations of mean oil point
pressure with respect to moisture content, heating
temperature and heating time for coarsely ground sheanut
kernel are shown in Tables 4, 5 and 6 respectively. From
Table 4, it can be seen that the oil point pressure of the
coarsely ground sheanut kernel at 4% moisture content was
highest and significantly different from that of kernels at
10% moisture which was in turn different from that of 8%.
The lowest value of oil point pressure occurred at 6%
moisture content. Oil point pressure of coarsely ground
sheanut kernel (Table 5) decreased with increase in heating
temperature with the value at 50oC being significantly
highest and different from others and that of 100oC was
lowest. Table 6 shows that the oil point pressure of coarsely
time with the value at 5 min being highest and different
from that of 10 min. Oil point pressure was lowest at 15
min.
3.5 ANOVA for fine particle size of sheanut kernel
The ANOVA of oil point pressure with pre-processing
conditions for fine particle size kernel is shown in Table 7.
From this table, it can be seen that oil point pressure (P)
varied significantly with fine particle size moisture content
(M), heating temperature (TE) and heating time (t) at 1%
level of significance. The interactions between all the
processing conditions namely M×TE, M×t, TE×t and M
×TE×t showed significant effect on oil point pressure at
1% level of significance as well. This implies that oil point
pressure was significantly different for all the ranges of
pre-processing parameters studied.
Table 7 ANOVA of sheanut kernel oil point pressure with
processing conditions for fine particle size
Source
Type III Sum of
Squares Df
Mean
Square F Sig.
Corrected
Model
7.534a 47 0.160 301.921 0.000
Intercept 145.433 1 145.433 2.739E5 0.000
M 5.091 3 1.697 3.196E3 0.000
TE 2.000 3 0.667 1.255E3 0.000
T 0.097 2 0.049 91.711 0.000
M×TE 0.289 9 0.032 60.558 0.000
M×t 0.012 6 0.002 3.635 0.003
TE×t 0.019 6 0.003 6.027 0.000
M×TE× 0.026 18 0.001 2.728 0.001
Error 0.051 96 0.001
Total 153.018 144
Corrected
Total
7.585 143
Note: Dependent variable: P, R Squared=0.993 (Adjusted R Squared=0.990),
M=moisture content (%), TE=temperature (°C), t =heating time (minutes)
The Tukey and Duncan separations of mean oil point
pressure with respect to moisture content, heating
temperature and heating time for finely ground sheanut
kernel are shown in Tables 8, 9 and 10 respectively. Table 8
shows that the oil point pressure of the finely ground
sheanut kernel at 4% moisture content was highest and
significantly different from that of the kernels at 10%
moisture which was in turn different from that of 8%. The
lowest value of oil point pressure occurred at 6% moisture
content. Oil point pressure of finely ground sheanut kernel
(Table 9) decreased with increase in heating temperature
with the value at 50oC being significantly highest and
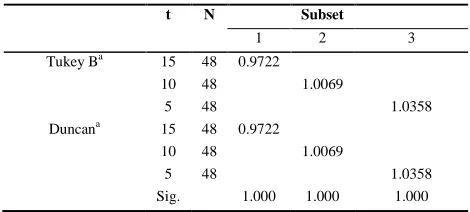
different from others and that of 100oC was lowest. The oil
point pressure of finely ground sheanut kernel (Table 10)
also decreased with increase in heating time with the value
at 5 min being highest and different from 10 min. Oil point
pressure was lowest at 15 min heating time.
Table 8 Multiple range comparison of finely ground sheanut
kernel oil point pressure with respect to moisture content
M N Subset
1 2 3 4
Tukey Ba 6 36 0.7338
4 36 0.9325
8 36 1.1344
10 36 1.2192
Duncana 6 36 0.7338
4 36 0.9325
8 36 1.1344
10 36 1.2192
Sig. 1.000 1.000 1.000 1.000
Note: Means for groups in homogeneous subsets are displayed, based on observed
means. Error term is Mean Square (Error) = 0.001. a. Uses Harmonic Mean Sample
Size = 36.000
Table 9 Multiple range comparison of finely ground sheanut
kernel oil point pressure with respect to heating temperature
TE N Subset
1 2 3 4
Tukey Ba 100 36 0.8622
85 36 0.9379
70 36 1.0441
50 36 1.1756
Duncana 100 36 0.8622
85 36 0.9379
70 36 1.0441
50 36 1.1756
Sig. 1.000 1.000 1.000 1.000
Note: Means for groups in homogeneous subsets are displayed, based on observed
means
Error term is Mean Square (Error) = 0.001. a. Uses Harmonic Mean Sample Size =
36.000
Table 10 Multiple range comparison of sheanut kernel oil point
pressure with respect to heating time of fine particle size of
sheanut
t N Subset
1 2 3
Tukey Ba 15 48 0.9722
10 48 1.0069
5 48 1.0358
Duncana 15 48 0.9722
10 48 1.0069
5 48 1.0358
Note: Means for groups in homogeneous subsets are displayed, based on observed
means. Error term is Mean Square (Error) = 0.001. a. Uses Harmonic Mean
Sample Size = 48.000
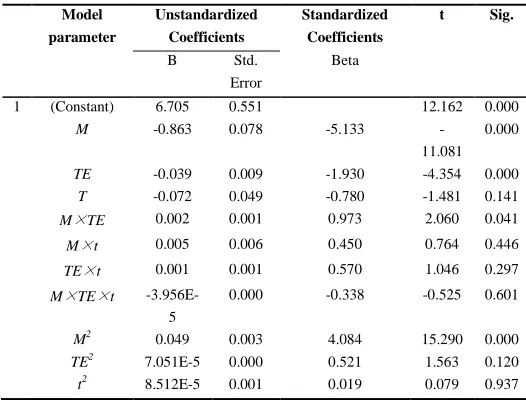
3.6 Modeling of oil point pressure of sheanut kernel on
pre-processing parameters
The result of multiple regression analysis carried out to
express the oil point pressure (P) as a function of the
pre-processing parameters of moisture content (M), heating
temperature (T), heating time (t) for coarsely ground
sheanut kernel is presented in Table 11. From the table, it
can be seen that the analysis yielded coefficients with
which the function that can be used to adequately predict
the oil point pressure of coarsely ground sheanut kernel on
the basis of pre-processing parameters was established. The
model (Equation 3) is expressed as follows:
P= 6.705 – 0.863M – 0.039TE – 0.072t + 0.002M×TE
+ 0.005M×t + 0.001TE×t – 3.965×10⁻⁵M×TE×t +
0.049M2 + 7.051×10⁻⁵TE2 + 8.512×10⁻⁵t2
R2= 0.85 (3)
where: P is oil point pressure (MPa), M is moisture
content (%), TE is heating temperature (oC) and t is heating
time (min).
Table 11 Coefficients for the regression analysis on oil point
pressure of coarse particle size of sheanut kernel
Model
parameter
Unstandardized
Coefficients
Standardized
Coefficients
t Sig.
B Std.
Error
Beta
1 (Constant) 6.705 0.551 12.162 0.000
M -0.863 0.078 -5.133
-11.081 0.000
TE -0.039 0.009 -1.930 -4.354 0.000
T -0.072 0.049 -0.780 -1.481 0.141
M×TE 0.002 0.001 0.973 2.060 0.041
M×t 0.005 0.006 0.450 0.764 0.446
TE×t 0.001 0.001 0.570 1.046 0.297
M×TE×t
-3.956E-5
0.000 -0.338 -0.525 0.601
M2 0.049 0.003 4.084 15.290 0.000
TE2 7.051E-5 0.000 0.521 1.563 0.120
t2 8.512E-5 0.001 0.019 0.079 0.937
Note: a Dependent Variable: P. where: M is moisture content (%), TE is heating
temperature (oC) and t is heating time (min)
A t-test of coefficients showed that the constant, TE2, t
and t2 terms did not make statistically significant
contribution to the predictive function of the equation. The
terms M, TE and M2 however, made significant
contribution to the equation at 1% level of significance.
This model can be used to optimize the sheanut oil
expression process and design and control the oil
expression equipment.
Table 12 Coefficients for the regression analysis on oil point
pressure of fine particle size of sheanut kernel
Model
parameter
1(Constant) M
TE
t
M×TE
M×t
TE×t
M×TE×t
M2
TE2
t2
Unstandardized
Coefficients
Standardized
Coefficients
t Sig.
B Std.
Error
Beta
1.371 0.407 3.365 0.001
-0.084 0.058 -0.817
-1.457 0.147
-0.002 0.007 -0.139
-0.259 0.796
0.010 0.036 0.185 0.289 0.773
-0.001 0.001 -1.196
-2.093 0.038
-0.003 0.004 -0.552
-0.775 0.440
0.000 0.000 -0.228
-0.346 0.730
3.757E-5 0.000 0.525 0.674 0.501
0.018 0.002 2.437 7.536 0.000
1.988E-5 0.000 0.241 0.597 0.552
0.000 0.001 -0.041
-0.144 0.886
Note: a Dependent Variable: P. where: M is moisture content (%), TE is heating
temperature (oC) and t is heating time (min)
Table 12 shows the result of multiple regression
analysis carried out to express the oil point pressure (P) as a
function of the pre-processing parameters of moisture
content (M), heating temperature (T), heating time (t) for
finely ground sheanut kernel. From the table, it can be seen
that the analysis yielded coefficients with which the
function that can be used to adequately predict the oil point
pressure of finely ground sheanut kernel on the basis of
pre-processing parameters was established. The model
(Equation 4) is expressed as follows:
P= 1.371 - 0.084M – 0.002TE + 0.010M×TE –
0.003M×t + 3.757×10⁻⁵M×TE×t + 0.018M2 + 1.988×
10-5TE2vvvv R2=0.78 (4)
where: P is oil point pressure (MPa), M is moisture
content (%), TE is heating temperature (oC) and t is heating
time (min).
TE2, t and t2 terms did not make statistically significant
contribution to the predictive function of the equation. The
M2 term however, made significant contribution to the
equation at 1% level of significance. This model can be
used to optimize the sheanut oil expression process and to
design and control the oil expression equipment.
4 Conclusions
This study revealed that the oil point pressure of
sheanut (Vitellaria paradoxa) kernel is affected
significantly by moisture content, heating temperature and
heating time. The oil point pressure of the kernel decreased
with increase in moisture content from 4% to 6% to a
minimum value and thereafter increased with further
increase in moisture content for both coarse and fine
particle kernels. Oil point pressure decreased with increase
in heating temperature and heating time. For coarse
particles, oil point pressure ranged from 0.9229 MPa at the
moisture content of 6%, heating temperature of 100°C and
heating time of 15 min to 2.6389 MPa at the moisture
content, heating temperature and heating time of 4.00%,
50°C and 5 min respectively. In the fine particles, oil point
pressure ranged from 0.6682 MPa at the moisture content
of 6%, heating temperature of 100°C and heating time of 15
min to 1.5554 MPa at the moisture content, heating
temperature and heating time of 10%, 50°C and 5 min
respectively. The relationship existing between the oil point
pressure and pre-processing parameters was adequately
expressed by multiple regression models. The models
yielded coefficients that are significant and useable in the
optimization and control of sheanut kernel oil expression
process.
Oil point pressure of sheanut kernel was greatly
affected by particle size. The highest oil point pressure
recorded was for coarse particles while finely ground
sheanut kernel recorded the lowest oil point pressure.
The results suggest that in oil expression from sheanut
kernel, high oil yield could be obtained by processing both
coarse and fine particles at low moisture levels.
References
Adebona, M. B., A. O. Ogunsua, C. O. Babalola, and M. O. Ologundede. 1986. Handling, Processing and Preservation of Tetracarpidium Crop, Proceedings of the 1st National Symposium. Food Processing SFST, pp36-45. Obafemi Awolowo University, Ile-Ife, Nigeria, 3-5 March.
Adeeko, K. A., and O. O. Ajibola. 1990. Processing factors affecting yield and quality of mechanically expressed groundnut oil. Journal of Agricultural Engineering Research, 45: 31–43. Ajibola, O. O., D. A. Okunade, and O. K. Owolarafe. 2002. Oil point
pressure of soybean. Journal of Food Process Engineering, 25(5): 407–416.
Ajibola, O. O., O. K. Owolarafe, O. O. Fasina, and K. A. Adeeko. 1993. Expression of oil from sesame seeds. Canadian Agricultural Engineering, 35: 83–88.
Ajibola, O. O., S. O. Adetunji, and O. K. Owolarafe. 2000. Oil point pressure of sesame seed. Ife Journal of Technology, 9(1&2): 57-62.
Aregbesola, O. A., G. A. Olatunde, S. S. Esuola, and O. K. Owolarafe. 2012. Oil point pressure of Indian almond kernels. International Agrophysics, 26:225–228.
ASAE Standards. 1982. S352.1. Moisture measurement-grains and seeds. St. Joseph, MI: American Society of Agricultural Engineers.
Aviara, N. A., W. B. Musa, O. K. Owolarafe, B. S. Ogunsina, and F. A. Oluwole. 2015. Effect of processing conditions on oil point of Moringa oleifera seed. Journal of Food Science and Technology, 52(7): 4499-4506.
Dedio, W., and D. G. Dorrell. 1977. Factor affecting the pressure extraction of oil from flaxseed. Journal of the American Oil Chemists’ Society, 54(8): 313–315.
Faborode, M. O., and J. F. Favier. 1997. New insight into the Mechanics of Seed-Oil Expression. Journal of Agricultural Engineering and Technology, 5: 9-24.
FAO. 1989. Traditional food plants. FAO Food and Nutrition Paper, Food and Agricultural Organization of the United Nations, Rome, 42, pp.593.
FAO and CFC. 2005. International Workshop on Processing and Marketing of Shea Products in Africa. Proceeding of a Workshop held by the Food and Agriculture Organization of the United Nations, the Common Fund for Commodities and the Centre de suivi ecologique; Technical Paper no. 21. CFC (Netherlands), Dakar (Senegal), FAO, Rome (Italy).
Fleury, J. M. 2000. The butter tree. International Development Research Centre Reports, Ottawa, Canada, 10, 6-9.
Hamzat, K. O. and B. Clarke. 1993. Prediction of oil yield from groundnuts using the concept of quasi-equilibrium of oil yield. Journal of Agricultural Engineering Research, 55(1): 79-87. Khan, L. M., and M. A. Hanna. 1983. Expression of oil from oilseeds
– a review. Journal of Agricultural Engineering Research, 28(6): 495–505.
Maranz, S., W. Kpikpi, Z. Wiesman, A. De Saint-Sauveur, and B. Chapagain. 2004a. Nutritional values and indigenous preferences for Shea fruits (Vitellaria Paradoxa C.F. Gaertn. F.) in African Agroforestry Parklands. Journal of Economic Botany, 58(4): 588-600.
Maranz, S., Z. Weisman, J. Bisgaard, and G. Bianchi. 2004b. Germplasm resources of Vitellaria paradoxa based on variation in fat composition across the distribution range. Agroforestry Systems, 60: 71-76.
Masters, E. T., and A. Puga. 1994. Conservation of woodland of Butryospermum paradoxum for local conservation and development. Co-operative office for Volunteers of Uganda, Kampala, 44.
Nikiema, A., and B. E. Umali. 2007. Vitellaria paradoxa C.F. Gaertn. In: van der Vossen, H. A. M. and Mkamilo, G.S. (Editors). Wageningen, Netherlands: PROTA FOUNDATION,14: Vegetable oils/Oléagineux. [CD-Rom].
Norris, F. A. 1964. Extraction of Fat and Oil. Bailey’s industrial Oil and Fat. New York: Wiley Press.
Ogunsina, B. S., O. K. Owolarafe, and G. A. Olatunde. 2008. Oil point pressure of cashew (Anacardium occidentale) kernels. International Agrophysics, 22(1): 53–59.
Olatunde, G. A., and O. K. Owolarafe. 2011. Effects of processing conditions on oil point of neem seed. Proceedings of the Nigerian Institution of Agricultural Engineers Conference, 23: 412-420.
Opeke, L. K. 1992. Tropical Tree Crops. 3rd ed. Ibadan: Spectrum Books Limited.
Owolarafe, O. K., A. T. Adegunloye, and O. O. Ajibola. 2003. The Effects of some processing conditions on oil point pressure of locust bean. Journal of Food Process Engineering, 26(5): 489– 497.
Oyinlola, A., A. Ojo and L. O. Adekoya. 2004. Development of a laboratory model screw press for peanut oil expression. Journal of Food Engineering, 64:221–227.
Singh, K. K., D. Wiesenborn, N. Kangas, and K. Tostenson. 2004. Screw pressing characteristics of dehulled crambe seed. Transactions of the ASAE, 47(1): 199-204.
Sivala, K., N. G. Bhole, and R. K. Mukherjee. 1991. Effect of moisture content on rice bran oil expression. Journal of Agricultural Engineering Research, 50: 81–91.
Sukumaran, C. R., and B. P. N. Singh. 1989. Compression of a bed of rapeseeds – the oil point. Journal of Agricultural Engineering Research, 42(2): 77–88.
Tunde-Akintunde, T. Y. 2010. Determination of oil point pressure for melon seeds. Journal of Food Process Engineering, 33(1): 179-189.
Tunde-Akintunde, T. Y., B. O. Akintude, and J. C. Igbeka. 2001. Effects of processing factors on yield and quality of mechanically expressed soya bean oil. Journal of Agricultural Engineering and Technology, 9: 39–45.