IJPAR |Vol.5 | Issue 4 | Oct - Dec -2016
Journal Home page: www.ijpar.com
Research article Open Access
Development and validation of RP-HPLC method for simultaneous
estimation of allopurinol and alphalipoicacid in bulk and tablet dosage form
1
S.Revathi*, A.Gopi Reddy
1,
K.Narendra Naidu
1, Dr.V.Kiran kumar
2.
1
Sana College of Pharmacy, JNTUH, Kodad, Nalgonda,Telangana,India.
2
Unity College of Pharmacy, Bhongiri, Nalgonda, Telangana,India.
*Corresponding Author: S.Revathi
Email: [email protected]
ABSTRACT
A new simple ,Rapid selective , precise and accurate gradient reversed phase high performance liquid chromatographic method (RP-HPLC )method has been developed And validated for simultaneous estimation of allopurinol and alphalipoic acid in bulk and tablet dosage form. Chromatographic analysis was performed on a c-18 column (250×4.6×5 µ)at ambient temperature .the column used was as BDS in Isocratic mode, with mobile phase containing tetrabutylammoniumhydroxide buffer and acetonitrile(70:30v/v) Adjusted to Ph 6.6 with dilute orthophosphoric acid solution . The flow rate was 0.8 Ml/min and effluents were monitored at 230nm. The retention times of allopurionol and alpha lipoicacid were found to be 2.33 min and 6.32 min, respectively. The method was validated as per ICH guidelines. The recoveries of allopurinol and alpha lipoic acid were found to be 98.53 to 100.03 and 98.5 to 99.9% respectively. The proposed method was found to be accurate reproducible and consistent. It was successfully applied for the analysis of these drugs in marketed formulations and could be effectively used for the routine analysis of formulations containing any one of the above drugs or a combination, without any alteration in the chromatographic conditions.
Keywords:
Allopurinol, Alphalipoicacid , RP-Hplc, Validation.INTRODUCTION
The present study has been undertaken in order to develop a new simple, rapid, efficient and reproducible RP-HPLC method for the analysis of Allopurinol and Alpha Lipoic acid [1].
An attempt was made in a stepwise manner to device a simple, rapid, selective, validated and sophisticated method, like, High Performance
Liquid Phase Chromatography (Reverse Phase) for Allopurinol and Alpha Lipoicacid [2].
Allopurinol is a drug used primarily to
metabolite, oxypurinol, inhibit the enzyme xanthine oxidase, blocking the conversion of the oxypurines hypoxanthine and xanthine to uric acid [6]. Elevated concentrations of oxypurine and oxypurine inhibition of xanthine oxidase through negative feedback results in a decrease in the concentrations of uric acid in the serum and urine
[7]. Allopurinol also facilitates the incorporation of hypoxanthine and xanthine into DNA and RNA, leading to a feedback inhibition of de novo purin synthesis and a decrease in serum uric acid concentrations as a result of an increase in nucleotide concentration [8].
1H, 2H, 4H-pyrazolo [3, 4-d] pyrimidin-4-one
Lipoic acid (LA), also known as α-lipoic acid and alpha lipoic acid (ALA) and thiotic acid is an organosulfur compound derived from octanoic acid. Lipoic Acid is generally involved in oxidative decarboxylations of keto acids and is presented as a growth factor for some organisms. Lipoic acid exists as two enantiomers, the R-enantiomer and the S-enantiomer. Normally only the R-enantiomer of an amino acid is biologically active, but for lipoic acid the S-enantiomer assists in the reduction
of the R-enantiomer when a racemic mixture is given. Some recent studies have suggested that the S-enantiomer in fact has an inhibiting effect on the R-enantiomer, reducing its biological activity substantially and actually adding to oxidative stress rather than reducing it. Furthermore, the S-enantiomer has been found to reduce the expression of GLUT-4s in cells, responsible for glucose uptake, and hence reduce insulin sensitivity.
5-(1,2-dithiolan-3-yl)pentanoic acid.
Different analytical methods have been reported in the literature for the assay of allopurinol and alpha-lipoic acid in bulk and tablet dosage form and includes spectrophotometry, TLC, HPLC, HPTLC, LCMS. The present study was to establish a simple, sensitive and low cost RP-HPLC method for simultaneous estimation of allopurinol and
MATERIALS AND METHODS
Reagents
Reagents used Water(HPLC grade), Sodium Acetate(Sodium Acetate), Methanol(HPLC Grade), Potassium Phosphate(AR Grade), Acetonitrile(HPLC
Grade),Ammonium acetate(Ammonium
acetate),Triethylamine(AR Grade).
Drugs
Allopurinol and Alpha Lipoic acid drugs (Gift Samples obtained from Chandra labs, Hyd), Aluno A (100+100)(Allopurinol-100 mg Lipoic Acid-100 mglabel claims).
Instruments
UV-Visible Spectrophotometer (Nicolet evolution 100), HPLC (Shimadzu (LC 20 AT VP), Ultra sonicator (Citizen, Digital Ultrasonic Cleaner), pH meter (Global digital), Electronic balance (Shimadzu), HPLC Column (Inertsil ODS 3V(250x4.6mm) 5µm), Syringe(Hamilton).
Mobile phase
A mixture of 55 volumes of Phosphate Buffer pH3.5 and 45 volumes of Acetonitrile was prepared. The mobile phase was sonicated for 10min to remove gases.
Preparation of Phosphate Buffer 20mm
2.72gm of potassium di hydrogen phosphate (KH2PO4) was weighed and dissolved in 1000ml of water and volume was made up to 1000ml with water. Adjust the pH to 3.5 using ortho phosphoric acid. The buffer was filtered through 0.45µ filters to remove all fine particles and gases.
Preparation of standard stock solution of
ALLOPURINOL
10 mg of ALLOPURINOL was weighed and transferred in to 100ml volumetric flask and dissolved in methanol and then make up to the mark with methanol and prepare 10 µg /ml of solution by diluting 1ml to 10ml with methanol.
Preparation of standard stock solution of
ALPHA LIPOIC ACID
10mg of ALPHA LIPOIC ACID was weighed in to 100ml volumetric flask and dissolved in Methanol and then dilute up to the mark with methanol and prepare 10 µg /ml of solution by diluting 1ml to 10ml with methanol.
Preparation of mixed standard solution
Weigh accurately 100 mg of Allopurinoland100 mg of AlphaLipoicacid in 100 ml of volumetric flask and dissolve in 10ml of mobile phase and make up the volume with mobile phase. From above stock solution 100 µg/ml of Allopurinol and 100 µg/ml of AlphaLipoicacid is prepared by diluting 1ml to 10ml with mobile phase. This solution is used for recording chromatogram
Assay
Preparation of samples for Assay
Preparation of mixed standard solution
Weigh accurately 100 mg of Allopurinoland100 mg of AlphaLipoicacid in 100 ml of volumetric flask and dissolve in 10ml of mobile phase and make up the volume with mobile phase. From above stock solution 100 µg/ml of Allopurinol and 100 µg/ml of AlphaLipoicacid is prepared by diluting 1ml to 10ml with mobile phase. This solution is used for recording chromatogram
Preparation of standard stock solution
Standard stock solutions of ALLOPURINOL and ALPHA LIPOIC ACID (μ/ml) were prepared by dissolving 2.5 mg of ALLOPURINOL and 100 mg of ALPHA LIPOIC ACID in 100 ml of mobile phase. After that filtered the solution using 0.45-micron syringe filter and Sonicated for 5 min. and dilute 100ml with mobile phase.
Tablet sample
Method validation
System suitability
Standard solutions were prepared as per the test method and injected into the chromatographic system. The system suitability parameters like theoretical plates, tailing factor, retention time resolution and asymmetric factor were evaluated.
Accuracy
Accuracy of the method was determined by Recovery studies. To the formulation (preanalysed
sample), the reference standards of the drugs were added at the level of 80%, 100%, 120%. The recovery studies were carried out three times and the percentage recovery and percentage mean recovery were calculated for drug is shown in table. To check the accuracy of the method, recovery studies were carried out by addition of standard drug solution to pre-analyzed sample solution at three different levels 80%, 100%, 120%.
FIG-1: HPLC Chromatogram of Allopurinol and Alpha lipoic acid.
Precision
Method precision
For precision same concentration solution of Allopurinol and Alpha lipoicacid was injected 6times and observed for any peculiar change in the areas and % RSD was calculated for each drug
Limit of Detection
Where, σ = the standard deviation of the response S = the slope of the calibration curve The slope S may be estimated from the calibration curve of the analyte.
Observation
The LOD for this method was found to be 1.64 µg/ml & area 104.53 for ALLOPURINOL and
18.21 µg/ml &area 104.71 for ALPHA LIPOIC ACID
Limit of Quantification
Where,
σ = the standard deviation of the response S = the slope of the calibration curve
The slope S may be estimated from the calibration curve of the analyte.
Observation
Robustness
Robustness is generally done by changing the parameters like flow rate and organic phase of the mobile phase.
Ruggedness
The ruggedness of the method was studied by the determining the analyst to analyst variation by performing the Assay by two different analysts
Acceptance criteria
The % Relative standard deviation of Assay values between two analysts should be not more than 2.0%.
Assay
Twenty micro litres of sample and standard solutions were injected separately into the chromatographic system and the peak areas for the analyte peaks were measured. The % content of each drug was calculated
Table-1 Assay results
ALLOPURINOL ALPHA LIPOIC ACID
Standard Area Sample Area Standard Area Sample Area
Injection-1 8416.477 8796.606 670.532 744.549
Injection-2 8401.247 8486.572 789.759 727.439
Injection-3 8405.335 8424.324 718.683 723.860
Injection-4 8429.709 8362.688 767.403 779.117
Injection-5 8374.071 8612.064 761.668 788.958
Average Area 8405.368 8536.451 741.609 752.7846
Tablet average weight 625 625
Standard weight 100 100
Sample weight 625 625
Label amount 100 100
std. purity 99.2 99.3
Amount found in mg 100.75 100.80
Assay(%purity) 100.75 100.80
Table-2 Results for system suitability of ALLOPURINOL
Injection Retention time (min) Peak area Theoretical plates (TP) Tailing factor (TF)
1 2.440 8732.758 4236 1.848
2 2.433 8496.782 4230 1.879
3 2.443 8434.962 4240 1.869
4 2.443 8424.539 4240 1.869
5 2.443 8442.276 4292 1.809
6 2.440 8752.046 4236 1.848
Mean 2.4403 8547.227 - -
SD 0.0039 153.354 - -
Table-3 Results for system suitability of ALPHA LIPOIC ACID
Injection Retention time (min) Peak area Theoretical plates Tailing factor Resolution
1 6.277 714.994 3897 1.048 11.288
2 6.313 712.967 3729 1.047 11.228
3 6.280 725.037 3013 1.083 11.383
4 6.307 711.707 3721 1.013 11.180
5 6.353 723.164 3777 1.062 11.409
6 6.277 741.715 3789 1.063 11.195
Mean 6.301 721.597 - - -
SD 0.030 11.269 - - -
%RSD 0.47 1.56 - - -
Table-4 Linearity Preparations
Preparations
Volume from standard stock transferred in ml
Volume made up in ml (with mobile phase)
Concentration of solution(µg /ml)
ALLOPURINOL ALPHA LIPOIC ACID
Preparation 1
0.6 10 60 60
Preparation 2
0.8 10 80 80
Preparation 3
1.0 10 100 100
Preparation 4
1.2 10 120 120
Preparation 5
1.4 10 140 140
Table-5 linearity of ALLOPURINOL
S.No. Conc.(µg/ml ) Area
1 60 5546.444
2 80 6742.300
3 100 8163.224
4 120 9160.542
Table-6 linearity of ALPHA LIPOIC ACID
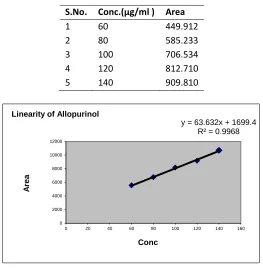
S.No. Conc.(µg/ml ) Area
1 60 449.912 2 80 585.233 3 100 706.534 4 120 812.710 5 140 909.810
Fig. 2: Linearity graph of ALLOPURINOL
Fig. 3: Linearity graph of ALPHA LIPOIC ACID
Table-7 Recovery results for ALLOPURINOL
Recovery level
Accuracy ALLOPURINOL Average
%Recovery Amount
taken(mcg/ml)
Area Average
area
Amount
recovered(mcg/ml)
%Recovery
80% 100 8381.268 8386.559 99.51 99.51
98.93%
100 8389.732
100 8388.677
100% 120 9596.193 9652.471 118.24 98.54
120 9691.402
y = 63.632x + 1699.4 R² = 0.9968
0 2000 4000 6000 8000 10000 12000
0 20 40 60 80 100 120 140 160
A
re
a
Conc Linearity of Allopurinol
y = 5.7364x + 119.2 R² = 0.9954
0 100 200 300 400 500 600 700 800 900 1000
0 20 40 60 80 100 120 140 160
A
re
a
120 9669.818
120% 140 10528.417 10554.907 138.27 98.76
140 10582.873
140 10553.432
Table-8 Recovery results for ALPHA LIPOIC ACID
Recovery level
Accuracy ALPHA LIPOIC ACID Average
%Recovery Amount
taken(mcg/ml)
Area Average area
Amount
recovered(mcg/ml)
%Recovery
80% 100 729.979 720.578 98.50 98.50
98.79%
100 712.701
100 719.054
100% 120 842.827 835.360 118.23 98.53
120 830.429
120 832.824
120% 140 949.944 942.123 139.11 99.36
140 943.091
140 933.335
Table-9 Results for Method precision of ALLOPURINOL and ALPHA LIPOIC ACID
ALLOPURINOL ALPHA LIPOIC ACID
S.No. Rt Area S.No. Rt Area
1 2.440 8732.758 1 6.277 714.994
2 2.433 8496.782 2 6.313 712.967
3 2.443 8434.962 3 6.280 725.037
4 2.443 8424.539 4 6.307 711.707
5 2.443 8442.276 5 6.353 723.164
6 2.440 8752.046 6 6.277 741.715
avg 2.4403 8547.227 avg 6.301 721.597
stdev 0.0039 153.354 stdev 0.030 11.269
%RSD 0.16 1.79 %RSD 0.47 1.56
y = 63.632x + 1699.4 R² = 0.9968
0 2000 4000 6000 8000 10000 12000
0 20 40 60 80 100 120 140 160
A
re
a
Fig. 4 & 5: Calibration graphs of ALLOPURINOL&ALPHA LIPOIC ACID
Table-10 Results for calibration graph
ALLOPURINOL ALPHA LIPOIC ACID
S.No. Concentration µg/ml Peak Area Concentration µg/ml Peak Area
1 60 5546.444 60 449.912
2 80 6742.300 80 585.233
3 100 8163.224 100 706.534
4 120 9160.542 120 812.710
5 140 10700.547 140 909.810
S.D. 31.6 2015 31.623 182
Slope 63.6 5.73
Table-11 Result of Robustness study
Parameter
ALLOPURINOL ALPHA LIPOIC ACID
Retention time(min) Tailing factor Retention time(min) Tailing factor
Flow Rate 0.8 ml/min 1.0 ml/min 1.2 ml/min
2.930 2.440 2.070
1.872 1.848 1.759
7.393 6.277 5.237
1.070 1.048 1.096
Wavelength 210nm 212nm 214nm
2.413 2.440 2.417
1.818 1.848 1.818
6.123 6.277 6.123
1.033 1.048 1.068
Table-12 Results for Ruggedness
ALLOPURINOL %Assay ALPHA LIPOIC ACID %Assay
Analyst 01 99.86 Analyst 01 100.16
Analyst 02 99.02 Anaylst 02 102.15
%RSD 0.20 %RSD 0.21
y = 5.7364x + 119.2 R² = 0.9954
0 100 200 300 400 500 600 700 800 900 1000
0 20 40 60 80 100 120 140 160
A
re
a
RESULTS AND DISCUSSION
To develop a new RP-HPLC method, several mobile phase compositions were tried. A satisfactory separation with good peak symmetry was obtained with C‐18 (150mm X 4.6mm, i.d., 5μm,) column using mobile phase containing tetra butyl ammonium hydroxide buffer (pH 6.6): acetonitrile (70:30) v/v at a flow rate of 0.8 ml/min. Quantification was achieved at UV detection at 230 nm based on peak area. The retention time for alloperinolandalphalipoicacid were found to be 2.33 min and6.32 min respectively. The optimized method was validated as per ICH guidelines.
System suitability parameters like retention time, resolution, tailing and plate count were shown uniformity and %RSD was less than 1 and the results are given in and from the obtained results we can say that the system is suitable for analysis.
A linearity range was 250-750 μg/ml with correlation coefficient 0.998 was observed for both the drugs. In linearity plot the graph with three different concentrations versus areas to construct the linear regression equation and to calculate the value of correlation co-efficient. Linear correlation was found to be y = 63.63x + 169.9 for alloperinol and y = 5.736x + 119.2 for alphalipoicacid and calibration curve
The precision of the proposed method was carried in terms of the repeatability and the %RSD values was found to be 1.79 for allopurinol & 1.56 for alphalipoic acidwhich reveal that the proposed method is precise. Precision studies were tabulated. The study of robustness in the present method shows no significant changes either in the peak area or Rt. Rubustness data is tabulated.
The method accuracy was evaluated by recovery studies. The percentage recovery of alloperinol and alphalipoicacid was found to be99.51% and 98.5 for 80% level; 98.53% and 98.5% for 100% level; 100.03% and 99.9.% for 150% level and results was shown.
Method specificity was concluded by those figures are alloperinol and alphalipoicacidstandard chromatogram and other one is formulation. There is no placebo and excipients peaks interference with standard and analytic peak so it proves method is selective.
SUMMARY AND CONCLUSION
A method was developed on trial & error basis by changing the variables wherever required. Finally a method was optimized and the conditions were determined. Method was developed by using RP HPLC Method During this optimization at every trial a new combination of mobile phase was tried to overcome the drawbacks of the previous run. Finally the method was optimized at trial 8, the optimized method was using Phosphate buffer pH 3.5: Acetonitrile (55:45v/v) at 212 nm and validated as per ICH guidelines. The method was validated for system suitability, linearity, precision, accuracy, specificity, robustness, LOD and LOQ. The system suitability parameters were within limit, hence it was concluded that the system was suitable to perform the assay. The method shows linearity between the concentration range of 60-140µg/ml for Allopurinol and 60-60-140µg/ml for Alpha Lipoic acid. The % recovery of were found to be in the range of 98.0 % - 102.0 %. As there was no interference due to mobile phase, the method was found to be specific. The method was robust as observed from insignificant variation in the results of analysis by changes in Flow rate and wavelength variation separately and analysis being performed by different analysts. The present method is validated and the results are better than previous methods which are performed on these drugs. Hence it can be concluded that the proposed method was a good approach for obtaining reliable results and found to be suitable for the routine analysis of Allopurinol and Alpha lipoic acid in Bulk drug and Pharmaceutical formulation.
REFERENCES
[1]. A recent book provides a comprehensive treatment of the theory of high-performance gradient chromatography: Lloyd R. Snyder and John W. Dolan (2006). High-Performance Gradient Elution: The Practical Application of the Linear-Solvent-Strength Model. Wiley Interscience.
[3]. Pacher, P.; Nivorozhkin, A; Szabó, C "Therapeutic Effects of Xanthine Oxidase Inhibitors: Renaissance Half a Century after the Discovery of Allopurinol". Pharmacological Reviews58(1), 2006, 87– 114. doi:10.1124/pr.58.1.6. PMC 2233605. PMID 16507884.
[4]. "WHO Model List of EssentialMedicines". World Health Organization. October 2013. Retrieved 22, 2014. [5]. B. Rajkumar, T. Bhavya, A. Ashok Kumar* Reverse Phase Hplc Method Development and Validation for the
Simultaneous Quantitative Estimation Of Alpha Lipoic Acid And Allopurinol In Tablets. Int J Pharm PharmSci, 6(1), 307-312
[6]. Nandini R. Pai and Seema S. Sawant* A simple and validated RP-HPLC method for the estimation of methylcobalamin and Alphalipoic acid in soft gelatine capsule dosage form. Der Pharmacia Sinica, 4(5), 2013, 46-53
[7]. J.Anil Mohan, B.Rajkumar, T.Bhavya, A.Ashok Kumar* Rp-Hplc Method Development and Validation For The Simultaneous Quantitative Estimation Of Pregabalin, Mecobalamin And Alpha Lipoic Acid In Capsules. Int J Pharm PharmSci, 6(1), 2013, 270-277