473
Int. J. Data Envelopment Analysis (ISSN 2345-458X)
Vol.2, No.3, Year 2014 Article ID IJDEA-00236,7 pagesResearch Article
A Neural Network Model to Solve DEA Problems
S. Dolatabadi
*a, H. Rezai Zhiani
a(a) Department of Mathematics, Islamic Azad University, Mashhad Branch, Mashhad, Iran
Received 25 April 2014, Revised 15 June 2014, Accepted 18 August 2014 Abstract
The paper deals with Data Envelopment Analysis (DEA) and Artificial Neural Network (ANN). We believe that solving for the DEA efficiency measure, simultaneously with neural network model, provides a promising rich approach to optimal solution.In this paper, a new neural network model is used to estimate the inefficiency of DMUs in large datasets.
Keywords: Data Envelopment Analysis (DEA), Neural Networks.
1. Introduction
Data envelopment analysis (DEA), occasionally called frontier analysis, was first put forward by Charnes, Cooper and Rhodes in 1978 [1]. It is a performance measurement technique which can be used for evaluating the relative efficiency of decision-making units (DMU's) in organizations. The major advantages of DEA are its allowing the relative efficiency to change over time and requiring no prior assumption on the best solution frontier; therefore, lots of businesses or organizations have applied DEA to find their operating performances for further making decisions on the efficiency improvement. Those inefficient DMUs can be identified and proposed to make up their input resources and/or generated benefits. The identification has been performed widely by linear programming (LP) technique [2,3,4]; yet, the serious dependence on the number of DMUs causes the LP technique to a longer DEA computation time. To overcome this limitation, an alternative approach seems to be needed.
DEA for a large dataset with many inputs/outputs would require huge computer resources in terms of memory and CPU time. This paper proposes a neural network Data Envelopment Analysis to address
* Corresponding author: [email protected]
this problem for the very large scale datasets now emerging in practice. Neural network requirements for computer memory and CPU time are far less than that needed by conventional DEA methods and can therefore be a useful tool in measuring the efficiency of large datasets.
This paper explores an alternative algorithm using a neural network to estimate the efficiency of DMUs (and inefficiency of DMUs) in large datasets. This method offers considerable computational savings. We use a neural network model as a solution tool in measuring the efficiency (and inefficiency) of large datasets simultaneously.
The paper unfolds as follows. The DEA models are explained in Section 2. Section 3 describes a new neural network algorithm for DEA (NNDEA). Finally, simple numerical examples are provided for the sake of illustration.
2. Data envelopment analysis (DEA) models
DEA is a non-parametric approach for measuring relative efficiency that produces a single aggregate measure of relative efficiency among comparable units (called DMUs) that is a function of the inputs and outputs of processes operating at the DMUs. DEA defines relative efficiency as the ratio of the sum of weighted outputs to the sum of weighted inputs:
Sum of weighted outputs DEA efficiency=
Sum of weighted inputs
The more output produced for a given amount of resources, the more efficient (i.e., less wasteful) is the process. The problem is how to weight each of the individual input and output variables, expressed in their natural units; solving for these weights is the fundamental essence of DEA.
The following derivations of the DEA linear programming formulation follow that of Charnes et al. [1]. The efficiency of the rth DMU, wr , can be obtained by solving the following linear DEA formulation.
Model: Charnes et al. Modified Data Envelopment Analysis Model (DEA Model)
1
1
1 1
(1)
. .
1 (2)
0 1,..., (3)
, 1,..., , 1,...,
J r j jr
j I
i ir i
J I j jk i ik j i
j i
M ax w u O
s t
v I
u O v I k K
u v
i I j J
i= 1,..., I inputs used at DMU,
j= 1,..., J outputs produced at DMU,
k= 1,..., r, . . . , K DMUs. Parameters:
Ojk = amount of the jth output for the kth DMU,
Iik = amount of the ith input for the kth DMU.
Decision variables:
u j = the weight assigned to the jth output,
vi = the weight assigned to the ith input.
The typical DEA solution process consists of sequentially solving DEA model for each DMU. The DEA model solution process needs to be modified to allow for the DEA efficiencies of all the DMUs to be calculated in one linear program. We define a new variable dr as the level of inefficiency of
DMU r (dr =1 − wr). The DEA model to solve all for all DMUs simultaneously is expanded in the
following manner [6]:
Model: Simultaneous DEA (SDEA)
1
1
1 1
(1 ) (4)
. .
1 , (5)
1 , (6)
0 ; ; (7)
, , ,
r r
r r
I ri ir i
J
rj jr r j
J I rj jk ri ik j i
rj ri
M ax d w
s t
v I r
u O d r
u O v I k r k r
u v
j i r
Where
Decision variables:
urj = the weight assigned to the jth output for DMU r,
vri = the weight assigned to the ith input for DMU r.
To allow for the simultaneous solution of the DEA model for all DMUs, the objective function (4) now maximizes the sum of the efficiencies. The constraints in (5) require the sum of DMU r’s weighted
inputs to be equal to 1. The constraints in (6) define efficiency as the sum of DMU r’s weighted outputs.
sum of weighted inputs.
3. New NN-DEA Model
In this section we demonstrate a neural network model to estimate the inefficiency of DMUs (and efficiency of DMUs) in large datasets.
We transform SDEA model to a neural network model [5]. In general, if the penalty method is applied to solve SDEA model, we can obtain an unconstrained optimization problem:
6
2 2
1 1 1,
Min ( ) ( ) ( ( ( )) ( ( )) ) (8)
2
K K
ir r 6 + k,r r r i k k r
L
P x E x h x h x
where L is a positive number, K is the total number of DMUs, r=1,…,K and
1
[ ,..., ], [ ,..., ]
[ , , ]
[ ]
[ ,..., ] , [ ,..., ]
( ) (1 )
r r1 rI r r1 rJ r r r r
T r
T T
r 1r Ir r 1r Jr K
r r
V v v U u u
x V U d
X x
I I I O O O
E X d
1
2
3
4
5
6
6 ,
. 1
1 .
. 1
1 .
. .
r r r r r r r r r r r r r r r r
r r
k r r k r k
h V I
h V I
h U O d
h U O d
h U
h V
h U O V I k r
0 ( ) 0
( ) {0, ( )} ( 1, , 6 ) , ( 1,... )
( ) ( ) 0
0 ( ) 0
( ) {0, ( )} ( 1, , ) , ( 1,... ) ,
( ) ( ) 0
ir r ir r ir r
ir r ir r
6 + k,r r 6 + k,r r 6 + k,r r
6 + k,r r 6 + k,r r
h x
h x Max h x i r K
h x h x
h x
h x Max h x k K r K r k
h x h x
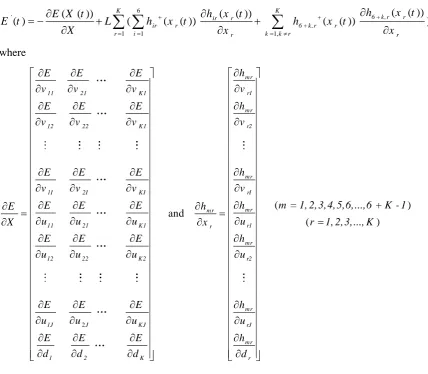
6 '
1 1 1,
( ( )) ( ( ))
( ( ))
( ) ( ( ( )) ( ( )) ) (9)
K K
6 + k,r r ir r
ir r 6 + k,r r
r i r k k r r
h x t
h x t
E X t
E t L h x t h x t
X x x
where 2 a11 21 K1 12 22 K1
1I 2I KI 11 21 K1 12 22 K2
1J J KJ
1 2 K
E E E
v v v
E E E
v v v
E E E
v v v
E E E
E
u u u
X
E E E
u u u
E E E
u u u
E E E
d d d
( ) nd ( ) mr r1 mr r2 mr rI mr mr r1 r mr r2 mr rJ mr r h v h v h v
m = 1, 2, 3,4, 5,6,...,6 + K - 1 h
h
u r 1, 2, 3,..., K
x h u h u h d
Proposition 1. If for any L (8) has an optimal solution, and if for system (9) we can find a state variable x(t) such that the neural network (9) is asymptotically stable at x*, then the optimal solution to (8) will be the equilibrium state of (9). [5]
Proposition 2. Under the penalty method, P(x) of (8) is a Lyapunov function of system (9). [5]
4. Numerical Example
Consider table 1 for 3 DMUs.
Table 1. Input/Output Data For Example
DMU I1 I2 O
1 1 1 1
2 2 1 1
3 3 2 1
Max
. .
1 2 3
11 12 21 22 31 32 11 1
21 2 31 3
11 11 12 11 11 12
21 21 22 21 21 22 31 31 32
(1 - d ) + (1 - d ) + (1 - d )
s t
v + v 1
2v +v = 1
3v + 2v = 1
u + d = 1
u + d = 1
u + d = 1
u - (2v +v ) 0
u - (3v + 2v ) 0
u - (v + v ) 0
u - (3v + 2v ) 0
u - (v +v )
, , , , , , , ,
31 31 32
11 21 31 11 12 21 22 13 23
0
u - (2v +v ) 0
u u u v v v v v v
For measure inefficiency (and efficiency) of DMUs we apply NN-DEA model (9) and use Euler method for solving our neural network. Thus we have following neural network model for this example:
3 6 3
'
1 1 1,
( ( )) ( ( ))
( ( ))
( ) ( ( ( )) ir r ( ( )) 6 + k,r r )
ir r 6 + k,r r
r i r k k r r
h x t
h x t
E X t
E t L h x t h x t
X x x
We selectL 1000,
0.000001and use Euler method with n = 3000 iteration for solving aboveneural network and obtain state variable X(t). The state variable X*(t) (or optimal solution of SDEA
model) is d1* 0,d2*0.0000001,d3* 0.5000005 and
2 3
1 2 3
[0.9999990,0.000001], [0.000001, 0.9999980], =[0.000001,0.4999985]
=[1.000000] , =[0.9999990] , =[0.4999995]
* * *
1
* * *
V V V
U U U
Thus DMU1 and DMU2 is efficient and DMU3 is inefficient.
5. Conclusions
of DMUs in large datasets. We use a new NN-DEA to find the optimal efficiency among multiple DMUs of a DEA problem.
6. References
[1] Charnes, A., Cooper, W.W, and Rhodes, E., Measuring the efficiency of decision making units, European Journal of Operations Research, vol.2, no.6, 1978, pp.429-44.
[2] Seiford, L.M. and Thrall, R.M., Recent developments in DEA: the mathematical Programming approach to frontier analysis. Journal of Econometrics, vol.46, 1990, pp.7-38.
[3] Bowlin, W.F., Measuring Performance: An Introduction to Data Envelopment Analysis (DEA), Journal of Cost Analysis, Fall, 1998, pp.3-27.
[4] Bouchard, G., Girard, S., Iouditski, A., and Nazin, A., Some linear programming methods for frontier estimation, Applied Stochastic Models in Business and Industry, vol.21, no.2, 2005, pp.175-185.