Copyright to IJIRSET www.ijirset.com 509
Evaluation of Efficiency in DEA Models
Using a Common Set of Weights
Shinoy George1, Sushama C M2
Assistant Professor, Dept. of Mathematics, Federal Institute of Science and Technology , Angamaly, Kerala, India1
Associate Professor, Dept. of Mathematics, National Institute of Technology Calicut, Kerala, India2
ABSTRACT:Data Envelopment Analysis is a well-known OR technique for evaluating the relative efficiency of a set of similar decision making units (DMUs).In the classical DEA models, each DMU assigns weights to the factors so as to maximize efficiency. This is unacceptable, since the same factors have widely different weights for each DMU. So, in order to discriminate efficient and non-efficient DMUs properly, a common set of weights need to be used. In this paper, a multiobjective programming model is developed to derive a common set of weights. Solution methodology uses fuzzy programming. The method is illustrated through an example in which data sets are taken from the previous research on DEA’s discriminating power and weight restriction.
KEYWORDS: DEA , set of common weights, multiobjective programming, fuzzy programming
I. INTRODUCTION
Data Envelopment Analysis is a well-known OR technique for evaluating the relative efficiency of a set of similar decision making units (DMUs). The number of applications of DEA is large covering fields as diverse as finance, health, education, manufacturing, transportation etc. Conventional DEA models are based on Linear Programming and consider continuous inputs and outputs.
Copyright to IJIRSET www.ijirset.com 510 The efficiency score of a unit is defined as the ratio of a weighted sum of its outputs to a weighted sum of its inputs and it is measured on a bounded ratio scale. The weights for inputs and outputs are estimated to the best advantage for each unit so as to maximize its relative efficiency. The underlying mathematical model is a linear program, which is given in either the multiplier form or in its dual form, the envelopment form. The former makes explicit use of the efficiency ratio while the latter provides an explicit representation of the envelope formed by the efficient frontier as well as the orientation with which the assessments are made (i.e. input or output oriented model). In terms of the multiplier form, an output multiplied by the corresponding weight is called virtual output. The sum of the virtual outputs over all the output dimensions, which forms the numerator of the efficiency ratio, is called total virtual output. Analogous are the definitions for inputs. The efficiency of a unit is thus obtained by the ratio of the total virtual output to the total virtual input.
The two basic DEA models are the CCR model [1] and the BCC model [2].These two models differentiate on the returns to scale assumed. The former assumes constant scale whereas the latter assumes variable returns-to-scale.
The main characteristic of this model (known as the CCR or engineering ratio model)is the transformation, for each DMU, of the situation multiple output/multiple input into a ratio virtual output/virtual input. This ratio yields an efficiency measure that is a function of a set of multipliers, which are the decision variables of a fractional programming model (then transformed into a linear programming model). The extension of the CCR model for the case of variable returns to scale was proposed in the BCC model, in which an additional constraint guarantees that each DMU under evaluation is compared with a convex combination of the other DMUs
.
II. THE BASIC DEA MODEL
Consider a set of n decision making units(DMUs) of similar inputs and outputs. Let there be m inputs and s outputs. In the Classical DEA(CCR) model [3]. for evaluating the efficiency of a DMU, denoted by DMUo. Is as follows
Subject to constraints
( I )
,
Where j is the DMU index, J=1,2,….,n, r the output index,r=1,2,…,s,I the input index, i=1,2,….,m, the value of the rth output for the jth DMU, the value of the ith input for the jth DMU, the weight given to the rth output , the
weight given to the ith input, and is the relative efficiency of DMUo, under evalution.
III.COMMON WEIGHT APPROACH IN DEA AND MULTIOBJECTIVE PROGRAMMING
Copyright to IJIRSET www.ijirset.com 511 Many models for deriving common weights [5]. are available and continue to be explored as such models are interesting both from theoretical and practical view points. ( a common set of weights means that only one frontier hyperplane generates a compromised solution; all DMUs lie beneath the hyperplane and agree with the final status.) Common weights derived by mulibojective linear programming (MOLP) [6-7] for a DEA model are theoretically supported by the concept of Pareto efficiency.DEA and MOLP both search for set non-inferior solutions. Thus characterizing the DEA model by multi objective programming is natural reasonable and appropriate . Li and Reeves [8] presented a multiobjective model that considers two additional efficiency measures: minimizing the sum of the DMU distances to frontier(minisum) and minimizing the sum of the largest distance (minimax), in addition to maximizing classical efficiency in DEA.
Subject to the constraints ( II )
IV.METHODOLOGY
By solving model (II), a set of weights is obtained for inputs and outputs. The model suggested is a multiobjective programming problem which is developed as follows.
Let be the efficiency of the jth DMU. That is, .
The proposed MOPP model is
where j =1,2,…,n Subject to the constraints
Where , and are taken from the results of the three models suggested above as the maximum and minimum values of the factor weights.
To convert the above model onto a fuzzy programming model the following definition of fuzzy set [9] is considered. Let X be a non-empty set. A fuzzy set A in X is characterized by its membership function
Copyright to IJIRSET www.ijirset.com 512 The MOPP can be converted to fuzzy programming model by defining membership functions for the efficiencies of different DMUs.
Let
and
,
where efficiency values are obtained by solving model(II). Define membership function for efficiencies of the DMUs
which is converted to the following fuzzy programming model
Subject to the constraints
Let
Then the model becomes Subject to the constraints
………….
and where r=1,2,…,s ; k= 1,2,….,m.
This model can be rewritten as Subject to the constraints
, j= 1,2,….,n.
and where r=1,2,…,s ; k= 1,2,….,m.
In order to facilitate the solution procedure of this nonlinear programming problem, it is divided into the following two problems by fixing minimum value for as well as maximum value for
Problem I
Subject to the constraints
, j= 1,2,….,n.
, where r =1,2,…,s
Problem II
Copyright to IJIRSET www.ijirset.com 513 Subject to the constraints
, j= 1,2,….,n.
where i= 1,2,….,m.
Solving Problem I and Problem II , a set of common weight for the efficiencies can be obtained.
V.EXAMPLE
(Efficiency evaluation of six nursing homes).[10]( Sexton 1986) considered a case of six nursing homes whose input and output data for a given year are described in Table 1, where the input and output variables are defined as follows: StHr (x1) staff hours per day, including nurses, physicians.etc.
Supp (x2) supplies per day, measured in thousands of rupees
MCPD (y1) total Medicare-plus Medicaid-reimbursed patient days (0,000) PPPD (y2) total privately paid patient days(0,000)
Table 1 Data of Example 1
DMU
INPUT OUTPUT
StHr (x1) Supp (x2) MCPD (y1) PPPD (y2)
A 1.50 0.2 1.40 0.35
B 4.00 .07 1.40 2.10
C 3.20 1.2 4.20 1.05
D 5.20 2.0 2.80 4.20
E 3.50 1.2 1.90 2.50
F 3.20 0.7 1.40 1.50
The results of classical DEA method, solved by LP, are given in Table 2. Using model (II), we obtained the results shown in Tables 3,4,5, corresponding to the three criteria, respectively.
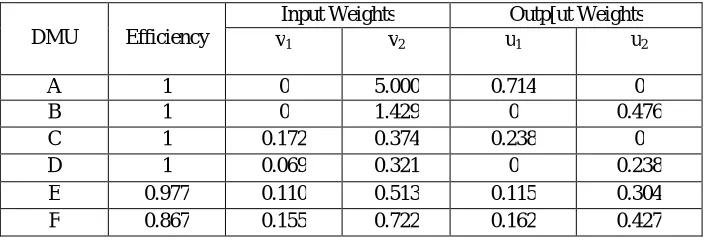
Table 2 Classical DEA results of Example
DMU Efficiency
Input Weights Outp[ut Weights
v1 v2 u1 u2
A 1 0 5.000 0.714 0
B 1 0 1.429 0 0.476
C 1 0.172 0.374 0.238 0
D 1 0.069 0.321 0 0.238
E 0.977 0.110 0.513 0.115 0.304
Copyright to IJIRSET www.ijirset.com 514 Table 3: Minimizing d0 DEA results of Example
DMU Efficiency
Input Weights Outp[ut Weights
v1 v2 u1 u2
A 1 0.517 1.121 0.505 0.837
B 1 0.138 0.642 0.144 0.380
C 1 0.172 0.374 0.082 0.279
D 1 0.080 0.292 0.115 0.184
E 0.977 0.110 0.513 0.115 0.304
F 0.867 0.155 0.722 0.162 0.427
Table 4 : Minimax DEA results of Example
DMU Efficiency
Input Weights Outp[ut Weights
v1 v2 u1 u2
A 1 0.449 1.634 0.457 1.029
B 0.953 0.153 0.556 0.156 0.350
C 0.883 0.132 0.481 0.135 0.303
D 1 0.080 0.292 0.082 0.184
E 0.974 0.127 0.463 0.129 0.291
F 0.846 0.174 0.633 0.177 0.399
Table 5: Minsum DEA results of Example
DMU Efficiency
Input Weights Outp[ut Weights
v1 v2 u1 u2
A 1 0.517 1.121 0.505 0.837
B 0.864 0.181 0.393 0.177 0.293
C 0.830 0.114 0.530 0.119 0.314
D 1 0.069 0.321 0.072 0.190
E 0.977 0.110 0.513 0.115 0.304
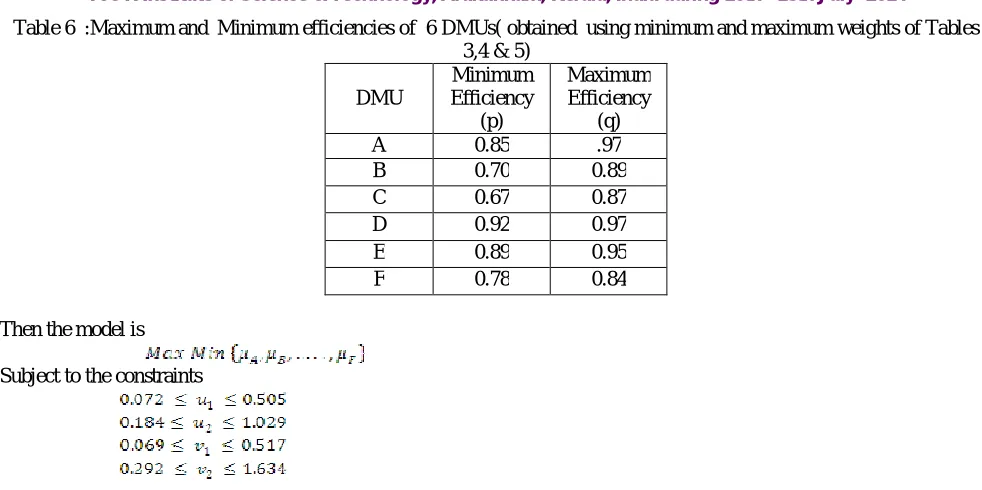
Copyright to IJIRSET www.ijirset.com 515 Table 6 :Maximum and Minimum efficiencies of 6 DMUs( obtained using minimum and maximum weights of Tables
3,4 & 5)
DMU
Minimum Efficiency
(p)
Maximum Efficiency
(q)
A 0.85 .97
B 0.70 0.89
C 0.67 0.87
D 0.92 0.97
E 0.89 0.95
F 0.78 0.84
Then the model is Subject to the constraints
Solution obtained is with u1 =0.0896, u2 =0.1857, v1 =0.0690 and v2=0.2920.This
implies, the efficiency values of the DMUs’ A, B, ….,F are respectively the maximum values of efficiencies. Thus the suggested model was able to provide a set of common weights u1 = 0.0896 , u2 = 0.1857 , v1 =0.0690 and v2 = 0.2920
corresponding to which each of the DMUs attains their maximum efficiencies.
VI.CONCLUSION
In this paper , a multiobjective programming model is developed for deriving a set of commom weights for the inputs and outputs. Unlike other DEA models, this model not only evaluates the efficiency scores of the DMUs but suggests common sets of weights which gives these efficiency scores. In practical situations, this is useful as it provides an insight into the importance of inputs as well as outputs as far as the performance of the organizations are concerned.
REFERENCES
[1]. Chanes A, Cooper WW and Rhodes E.Measuring efficiency of decision making units. European Journal of operations Research; 2:429-444, 1978 [2 ]. Charnes A , Cooper WW , Lewin AY and Seiford LM. Data Envelopment Analysis ; Theory, Methodology and Applications.Kluwer Academic Publisher,Boston, 1994.
[3]. Charnes A, Cooper WW and Wei QL and Huang ZM. Cone ratio data envelopment analysis and multi-objective programming. International Journal of Systems science 20:1099-1118, 1989.
[4]. S Saati. Determining a common set of weights in DEA by solving a linear programming. Journal of Industrial Engineering International.4;51-56, 2008.
[5]. Kao C and Hung. Data envelopment analysis with common weights: The compromise solution approach. Journal of Operational Research Society, 56: 1196-1203,2005.
[6].. Steuer RE. Multiple Criteria Optimization: Theory, Computation and Application. Krieger publishing: Florida., 1986.
[7]. YW Chen, M Larbani and YP Chang. Multiobjective data envelopment analysis.Journal of Operational Research society. 60:1556-1566, 2009. [8]. Li XB and Reeves GR. A multiple criteria approach to data envelopment analysis. European Journal of Operations Research 115: 507-517, 1999. [9]. George J Klir and Bo Yuao. Fuzzy sets and Fuzzy logic: Theory and Applications. Phi Learning, New Delhi, 11-33, 2009.