Research Report No.4
December, 1962
Measured crop performance
CORN
1962
GUY L. JONES, Professor
In Charge of Variety Testing
J.
L. TRAMEL, Graduate Assistant
E.
t,
JONES, Agricultural Research Supervisor
G. C. OLIVER, Agricultural Research Assistant
Department of Crop Science
N. C. State College
INTRODUCTION.
• • • •
EXPERIMENTAL PROCEDURE •
Agencies Sponsoring Entries.
Location of Tests
. . . • •
Cultural Practices .
RESULTS • • • • • • • • •
Three Year Average Performance •
Two Year Average Per formance .
One Year Average
Perfo~ance4
4
6
9
3
NORTH CAROLINA
CORN YIELD, TRIALS 1962
INTRODUCTION
Mechanic.1 harvesting is becoming increasingly important in the
hand-ling of corn; this has placed great emphasts on the amount of corn the
grower takes from the field at harvest and not necessarily what the
potential yield of the hybrid may be.
The breeder is cognizant of the
impact of machanica1 harvesting on corn and is striving to produce hybrids
with low ear placement and strong stalks that can be
harv~stedsuccess-fully with mechanical equipment.
A top performing hybrid is one that
will consistently give high returns to the grower.
It must have good
yield and standabi1ity as well as other desirable characteristics.
Per-formance information from several locations over a period of years is
desirable in order to properly evaluate a hybrid.
However, it i$ not
until the hybrid has been planted under farm conditions that it really
receives its most thorough evaluation.
The data presented in this report provide information on the
per-formance of commercial and experimental hybrids grown in various
geographic areas of the State.
Information of this nature serves as a
guide to corn breeders in their development of hybrids for the different
areas.
It also provides a guide to agricultural workers and to growers
in choosing a hybrid to plant.
For a hybrid to be eligible for sale in North Carolina, it must
have been tested in at least one area of the State within the past five
years.
The hybrid must also meet certain minimum standards as set by
the Hybrid Corn Committee.
Results of the North Carolina Official Corn Trials for the 1962
season are presented in this report.
Summaries of the results of tests
EXPERIMENTAL PROCEDURE
Commercial and experimental hybrids developed by public and private
agencies are included in this program.
One requirement for inclusion is
quantitative data from experiments in which the proposed entry is compared
with recognized hybrids.
These data must reveal meritorious performance
in order for a hybrid to qualify for the test.
Entering Hybrids
The commercial hybrids and experimenta1s included in these trials
are entered by their respective companies because they believe them to
have good performance records.
Any individual or firm may make
app1ica-tion for having hybrids tested.
A fee is charged on an entry per area
basis.
Personnel of the testing program may also include entries about
which further information is desired.
Early in February each year, rules governing the tests for the
ensu-ing year are distributed to all previous participants and to those who
make inquiry.
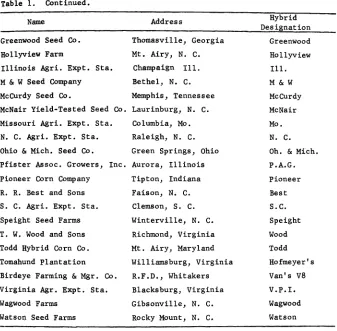
Agencies sponsoring entries in the 1962 tests are shown in Table 1.
Table 1.
Name and address of sponsoring agencies in the 1962 North
Carolina Corn Performance Trials along with designation
used to identify the hybrids in the trials.
Name
Ag. Alumni - Purdue Univ.
Beam's Farm
Britt, Woodrow
Cargill Inc.
Coker Pedigreed Seed Co.
Davis, Frank W.
DeKalb Agri. Assn., Inc.
~dmund
and Son Seed Co.
Funk Brothers Seed Co.
Address
Lafayette, Ind.
Lawndale,
N.
C.
Chadbourn
Minneapolis, Minn.
Hartsville, S. C.
Blackstone, Va.
DeKalb, Illinois
Chadbourn, N. C.
Bloomington, Illinois
Hybrid
Designation
AA
B
&
B
Britt
Cargill
Coker
US 578
. DeKalb
Edmund
5
Table 1.
Continued.
Name
Address
Hybrid
Designation
Greenwood Seed Co.
Thomasville, Georgia
Hollyview Farm
Mt. Airy, N. C.
Illinois Agri. Expt. Sta.
Champaign
Ill.
M
&
W Seed Company
Bethel, N. C.
McCurdy Seed Co.
Memphis, Tennessee
McNair Yield-Tested Seed Co. Laurinburg, N. C.
Missouri Agri. Expt. Sta.
Columbia, Mo.
N. C. Agri. Expt. Sta.
Raleigh, N. C.
Ohio
&
Mich. Seed Co.
Green Springs, Ohio
Pfister Assoc. Growers, Inc. Aurora, Illinois
Pioneer Corn Company
Tipton, Indiana
R. R. Best and Sons
Faison, N. C.
S. C. Agri. Expt. Sta.
Clemson, S. C.
Speight Seed Farms
Winterville, N. C.
T. W. Wood and Sons
Richmond, Virginia
Todd Hybrid Corn Co.
Mt. Airy, Maryland
Tomahund Plantation
Williamsburg, Virginia
Birdeye Farming
&
Mgr. Co.
R.F.D., Whitakers
Virginia Agr. Expt. Sta.
Blacksburg, Virginia
Wagwood Farms
Gibsonville, N. C.
Watson Seed Farms
Rocky Mount, N. C.
Field-Plot Technique
Greenwood
Hollyview
Ill.
M&W
McCurdy
McNair
Mo.
N.
C.
Oh.
&
Mich.
P.A.G.
Pioneer
Best
s.c.
Speight
Wood
Todd
Hofmeyer's
Van's VB
V.P.I.
Wagwood
Watson
The State is divided into five geographical areas according to soil
type, maturity zone, and climatic conditions.
The various areas and
co-operators are shown in Figure 1.
Where feasible, three or more
locations with four replications were used in each area.
In each of the
two mountain areas, (Areas I and II)
where the acreage of corn is less,
one location with six replications was used.
Four locations were used in
Area III.
The Person County site had severe water damage and was
LOCATION OF NORTH CAROLINA
CORN YI
ELD'
TRIALS 1962
AREA I NORTHERN MOUNI'AINS
CO-OPERATORS 1962
1/
AREA V NORTHERN COASTAL PLAIN
AREAIV
SOUTHERN COASTAL PLAIN
~
I - Northern Mountains
Upper Mountain Research Station, Dana G. Tugman, . Superintendent,
Ashe County, Laurel Spring, N. C.
~
II - Southern Mountains
Mountain Research Station, M. R. Whisenhunt, Superintendent,
Haywood County, Waynesville, N. C.
Area III - Piedmont
--- Farm of William A. Hains, Pine Hall, N. C., Stokes County
Agricultural Agent S. B. Brandon and assistants, co-operating.
Farm of Ira J. Wolfe, Huddle Mills, N. C., Person County
Agricultural agent W. J. Reams and assistants, co-operating.
Farm of Clyde Wood, Vale, N. C., Lincoln County
Agricultural Agent G. A. Soudemire and assistants, co-operating.
Farm of D. G. Harwood, New London, N. C., Stanly County
Agricultural Agent V. A. Huneycutt and assistants, co-operating.
Area
IV - Southern Coastal Plain
Farm of Alton Potter, Winnabow, N. C., Brunswick County
Agricultural Agent A. S.
Kno~lesand assistants, co-operating.
Farm of W. G. Sullivan, Mt. Olive, N. C., Duplin County
Ag~icultural
Agent V. L. Reynolds and assistants, co-operating.
Farm of Roger Johnston, Kinston, N. C., Lenior County
Agricultural Agent F. J. Koonce and assistants co-operating.
Farm of Lambert Lewis, Penbrook, N. C., Robeson County
Agricultural Agent
o.
P. Owens and assistanm co-operating.
~
V - Northern Coastal Plain
Farm of W. L. Sawyer, Camden, N. C., Camden County
Agricultural Agent S. A. Tuten co-operating.
Farm of J. J. Johnston, Scotland Neck, N. C., Halifax County
Agricultural Agent C. D. Peedin and assistant co-operating
Farm of Henry Winslow, Williamston, N. C. Martin County
Argicultural Agent D. W. Brady and assistant co-operating
The Official Variety Testing Program recognizes the co-operative spirit
and civic-minded service rendered by the farmers who have furnished,
prepared and cultivated the land for these trials.
The Agricultural workers in their respective areas contribute much to
the success of these tests by aiding in the location of test sites,
by
7
presented.
There were four location of four replications each in Area IV.
Area V had three locations and there was a full and short season test at
each.
The practice in the Northern Coastal Plain area, where short season
corns are grown on many farms, is toward planting high populations and
fertilizing heavy.
It seemed desirable to compare these corns
und~r
this
type of management to determine their response.
The short season test
therefore was divided into three replications with normal population
and fertilizer and three with high populations and high fertilizer.
The
three replications of the normal population test were planted 12 inches
in the drill and the high populations test was planted 8 inches in the
drill.
Soil tests were made and fertilization was' applied in accordance
with recommendations.
An
additional 50 pounds of liquid nitrogen at
topdressing time was applied on each of the high population, high
fertilization plots.
Depending upon the number of entries, the following experimental
designs were used:
A 5 x 6 and 7 x 8 triple rectangular lattice, a
7 x 7 triple lattice and a 5 x 5 balanced lattice.
Yield data were
analysed by locations and combined over locations within an area.
Only
the combined data are shown.
In order t·o more nearly simulate farm conditions of planting
single kernels were planted 12 inches apart in the row and were not
thinned.
All tests were planted with a hand planter.
RoW width of the
various tests ranged from 40 to 48 inches.
The plots were two rows wide
and 14 feet long with 13 kernels planted per row, except for the high
population, short season test, which had 19 kernels per row.
A mixed fertilizer was applied at prep1anting and the plots were
level.
The test in Martin County received an additional 100 pounds of
anhydrous ammonia immediately following planting.
Simazine was used as
a herbicide on most tests at planting.
At layby, herbicides were applied
in the form of liquid nitrogen and 2-4D to control late grass and weeds.
Excellent weed control was obtained in the Duplin County test; however,
due to dry weather following the application of the simazine, poor weed
control was obtained in the other tests.
Cultural practices for each of
the tests are shown in Table 2.
Planting, collecting data, and harvesting
were directly supervised by personnel of the North Carolina Agricultural
Experiment Station.
All tests, except the two mountain areas, were harvested with a
picker-sheller
c~mbine.A two row picker-sheller was slightly modified for
harvestin individual plots.
Grain from individual plots was caught as it
came from the elevator and weighed.
The combine was stopped at the end
of each plot for a short interval of time in order for the machine to
clean out between plots prior to weighing the corn from the plot.
The
machine appeared to give very satisfactory results.
A sample of corn
was taken from each plot for moisture determination.
A picker-sheller
was used to more nearly simulate the conditions under which these corns
would be harvested on farms.
The only corn harvested was that which came
through the picker-sheller.
If the machine failed to pick up a stalk due
to lodging, this corn was not harvested.
Seasonal Conditions
The 1962 growing season in North Carolina was generally favorable
for the production of corn except in the Piedmont area.
At planting
time, it was dry,
~articularlyin the Piedmont, and a poor stand was
obtained at the Stanly and Lincoln County locations.
The Stanly County
Table 2.
Cultural practices used on the corn tests.
Area and
Cooperator
Fertilizer
Lbs/A
II
Top
Herbicide-
Dressing
Pre emerge
Lbs/A
Row
Spacing
In.
Date of
Planting
Date of
Harvest
Top dressed with liquid nitrogen and
1/2
pint
2-4-D/A
for late weed control
On the Sullivan and Lewis farms 3/4 1bs. of Lorox was also used.
350
10-20-20
Simazine
100 1iq. nit.
40"
600
5-10-10
Simazine
100 1iq. nit.
42"
600, 5-10-10
Simazine
100 1iq. nit.
40"
500, 5-10-10
100 1iq. nit.
48"
250-5-10-10
250-10-10-10
Simazine
100 1iq. nit.
42"
450-5-10-10
Simazine
100 1iq. nit.
42"
500-5-10-10
Simazine
100 1iq. nit.
42"
400-6-6-12
Simazine
100 1iq. nit.
42"
600-5-10-10
140 1iq. nit.
40"
575-5-10-10
100 1iq. nit.
42"
Area I
Upper Mt. Res. StaG
Dana G. Tugman
Area II
Lower Mt. Res. StaG
M. R. Whisenhunt
Area III
Clyde Wood, Lincoln County
Wi1iam A. Hains, Stokes County
Area IV
Alton Potter, Brunswick County
W. G. Sullivan, Duplin County
Roger Johnston, Lenior County
Lambert Lewis, Robeson County
21
Area
V-W. L. Sawyer, Camden County
J. J. Johnston, Hailfax County
Henry Winslow, Martin County
!I
500-6-6-12
Simazin
100 1bs.
Anhydrous Ammonia
100 1iq. nit.
42"
May 11
Oct. 22
May 9
Oct. 23
April 25
Oct. 17
May 16
Oct. 24
r
April 24 '
Oct. 8
April 18
Oct. 4
\0April 17
Oct. 3
April 17
Oct. 5
April 19
Sept. 19
April 20
Sept. 14
Short Season
Oct. 2
Full Season
April 18
Sept 12
Short Season
Sept 20
Full Season
at all farms except Sawyer.
10
was planted during a very dry period and a packing rain one week later
caused a poor stand in certain areas of the field and adjustments for
stand were made.
The Person County test was dry at
planti~gresulting
in a poor s'tand.
Heavy rains
(20
inches in
4
weeks) following this
drowned the test and it was abandoned.
The corn yield was good at all
locations; however, at the Stokes County test in the piedmont, there was
severe bird damage to many of the hybrids.
These are footnoted in the
table and the decrease in yield in some of them was very high as a
result of the bird damage.
There was excessive rain which affected the tests in the Northern
and Southern Coastal Plain at about the time the plants came into
tassel causing some lodging; however, this was a short period of excess
moisture causing relatively little injury to the tests.
All trials
were planted between April
17 and May 16.
All harvesting was completed
between the dates of September
12 and October 24..
Weather conditions
for harvesting were unusually good.
There was very little wind or rain
during this period; consequently, lodging was at a minimum in most tests.
The short season tests were ready to be harvested about ten days to
two weeks earlier than they were harvested) but harvesting was delayed
until the combine arrived and was modified for use.
Dat~/
Data were collected on each plot at each location on yield, stand,
moisture, lodging, ear height, ears per 100 stalks, exposed ear tips,
and quality.
Statistical analyses were made on each of the above
~/
St'atistical analyses were made in the Statistical Laboratory under the
supervision of John
o.
Rawlins and Frank Verlinden.
This assistance
11
listed characters for individual locations and combined over locations
within an area.
The C. V. and L. S. D. are listed at the bottom of the
various 'columns of the 1962 tables.
Only the summary data by areas are
shown for 1962.
Comparisons of hybrids should only be made within areas
and not between areas.
The percentage data presented in this report were not transformed
and the L. S. D. and C. V. values listed are for the untransformed data.
This resulted in the C. V.'s and L. S. D.'s being rather high for per
cent lodged and per cent ear tips exposed.
Stand and Yield Adjust.ments
All plots having less than a 70 per cent stand were adjusted to 70
per cent of the maximum stand for statistical analysis.
Any plot having
a.stand of 70 per cent or above was not adjusted.
Yield adjustments were made by determining the average yield per
plant of the particular variety in unadjusted plots and multiplying
this value by the adjusted number of plants.
Yield
Weight of shelled corn was obtained by harvesting and weighing
each plot of four replications of each entry at each location tested in
Areas III, IV, and V full season corns and three replications in the
short season tests in Area V.
Six replications were harvested in Areas
I and II.
Areas I and II were harvested by hand and weights of ear
corn were converted to shelled corn basis.
All plot yields were adjusted
to 15.5 per cent moisture.
~
Stand per cent was determined by counting the number of plants per
plot and dividing by 26 for the normal population tests and 38 for the
12
Moisture at Harvest
Moisture content of grain at harvest is an index of maturity.
Moist-ure percentage was determined from samples obtained from each plot at
each location except in Areas I and II where the sample was taken on
'three replications.
Samples were obtained by taking a sample from each
plot immediately after the grain was weighed.
The samples were placed in
waterproof plastic coated paper bags and analyzed shortly thereafter on a
Tag Heppenstall moisture meter.
Lodging
Lodging is a term used to describe stalks that are broken, leaning,
or fallen to the ground.
All plants broken below the ear or leaning more
than 45° are considered lodged.
Data were taken on each plot and a
lodging per cent calculated.
Ear Height
Ear height was determined by measuring the distance from the ground
to the node where the ear is attached to the stalk.
Ears Per 100 Stalks
The number of ears per 100 stalks is a measure of prolificacy and
indicates whether a hybrid tends to be a single-ear or prolific type.
Ears per plot were counted in each replication at every location prior
to harvest.
Ears per plot divided by plants per plot give the number
of ears per plant.
This figure multiplied by 100 gives the number of
ears per 100 stalks.
A fallacy in this method is that the count is made
without shucking the corn out so some undeveloped ears are counted.
Exposed Ear Tips
The number of exposed ear tips were counted in each plot.
This
number divided by the total number of ears. per plot gives per cent exposed
13
Quality
Quality readings are based primartly on ear rot damage.
The
follow-ing scale was used to determine ratfollow-ing:
Rating
1
2
3
4
5
Per Cent of
Damage Per Plot
o -
10
10 - 20
20 - 30
30 - 40
40 - 50
The data were taken on each plot on the shelled corn, except in Areas I
and II.
It was calculated for each area and reported to one decimal place.
Diseases
The reaction of hybrids to the major corn diseases (including the
common leaf blights) is evaluated yearly.
It is difficult to make
adequate comparisons of hybrids over a period of successive years due
to the fact that all hybrids are severely damaged during years of severe
disease development.
Preliminary observations indicate little difference
in reaction of hybrids to the common leaf blight present in the Coastal
Plain Area.
Insect Damage
Weevils and other stored grain insects often cause kernel damage to
ears of corn before they are harvested.
The tests included in this
report were all harvested relatively early; therefore, stored insect
damage was negligible.
RESULTS
Data are presented by areas for three year, two year and one year
performance.
Hybrids are divided into four groups in the tables,
commercial yellow and white, and experimental yellow and white.
There
hybrids differ in yield, maturity, lodging, disease and insect res'istance,
grain quality and other fac·tors.
Hybrids that are outstanding in one or
more characteristics may be inferior in others and should, therefore, be
selected on the basis of overall performance.
Hybrids tested more than one. year have a more accurate estimate of
their general performance since they have been tested under more diverse
environments.
Growers should select a top performing hybrid for
plant-ing.
A top performer is not necessarily the highest yielder, but it
should have a high yield, mature within the desired time, stand upright
at harvest, and also be reasonably good in other agronomic characteristics.
All hybrids yielding above the mean of the test would be considered
reasonably good performers.
The 1962 tests for all areas, except Area III, were good and the
performance should be representative of the hybrids.
Comparisons can be
made directly in these summary tables except for Area III, the Piedmont
test.
Two of the four tests in Area III were abandonded.
The Stanly
County test had a very poor stand due to dry weather at planting and the
Person County test drowned due to excess water damage in mid-summer.
The
data from the other two tests reported herewith are not necessarily
representative.
The Stokes County test had a good stand and was
consid-ered a very good test; however, there was severe bird damage to the ears
prior to harvest.
This damage was more evident on the hybrids that had
exposed ear tips.
The Lincoln County test had a broken stand in certain
areas of the field.
However, the corn in the test waS very good, 'but
the poor stand in certain areas of the field affected the yield
of
these
15
place the hybrids in their true perspective.
The data from Area III is
reported for relative information only and should not be considered as
conclusive.
The entries with bird damage are footnoted and this should
be considered in an evaluation of the data.
Short season corn is early maturing and is usually sufficiently
dry to be harvested and marketed in late August and early September.
This type supplies an early (August and September) market demand, and
the production of it has been limited primarily to the northeastern
counties.
The short season corn is grown for two specific purposes;
(1) early market and (2) hogging off.
The keeping quality of the
short season hybrids is usually
inferio~,and unless the grower
exercises extra precautions, the quality and feed value are likely to
deteriorate rapidly from insect damage.
Short season hybrids are
usually less suitable for storing on the farm because of this rapid
deterioration.
For general farm storing and feeding, full season corn is more
likely to preserve its quality and usually is damaged less by insects.
Full season corn requires from two to three weeks longer than short
season hybrids to reach maturity and to become sufficiently dry to
harvest and store.
Usually, full season corn is dry enough to be
16
Table 3.
Comparison of hybrids for certain characteristics
Northern Mountains - Area I
Three-Year Average - 1960-1961-1962
Hybrid
Yield
Stand
Moisture Lodged
Height
Ear
Ears/100
Ear Tips
Exposed
Quality
Designation
Bus/A
%
%
%
Inches
Stalks
%
Commercial Hybrids
Yellow Entries
DeKalb 805
125
97
20.3
5
50
106
15
1.6
V"P.I. 648
108
92
30.0
7
50
117
60 .
3.0
Mean of Test
107
92
29.7
11
47
121
25
2.4
DeKalb 640
105
92
29.8
8
53
119
14
2.1
Wood V-26Y
104
87
29.0
15
47
120
24
2.0
DeKalb 633
102
92
29.0
12
46
111
19
3.1
U.S. 282
101
92
31.3
22
61
130
29
2.1
Table 4.
Comparison of hybrids for certain characteristics
Southern Mountains - Area II
Three-Year Average - 1960-1961-1962
Hybrid
Yield
Stand
Moisture Lodged
Ear
Ears/lOO
Ear Tips
Designation
Bus/A
%
%
%
Height
Stalks
Exposed
Quality
rnches
%
Conunerci.a1 Hybrids
Yellow Entries
DeKalb A-71S
122
95
23.1
4
52
124
61
2.3
McNair 304A
119
94
25.0
1
48
129
19
2.1
Pioneer 309A
117
95
25"9
2
48
131
12
2.5
U.S. 282
114
90
25.1
9
58
120
38
1.7
Mean of Test
114
93
24.7
3
47
123
29
g
V.P.I. 648
99
91
. 23.7
2
48
110
62
2.2
17
Table 5.
Comparison of hybrids for certain characteristics
Piedmont - Area III
Three Year Average - 1960, 1961, 1962
Hybrid
Yield
Moisture
Lodged
Ear
Ears/100
Ear Tips
Designation
Bus/A
%
%
Height
Stalks
Exposed
Quality
Inches
%
Commercial Hybrids
Yellow Entries
NC 270
102
20.8
4
53
132
7
1.5
Coker 67
101
19.1
1
55
160
1
1.4
Dixie 82
98
19.3
7
60
144
2
2.2
Pioneer 309B
98
17.3
3
47
132
4
1.3
Wagwood 100
97
19.1
3
48
122
8
2.1
McNair 444'
97
18.4
5
54
146
3
1.6
Funk ,G-710AA
96
18.0
3
53
138
6
1.7
Mean of
~~
18.0
4
52
.!-..!2
~
~
NC 42
95
18.6
10
59
131
2
1.6
NC 27
95
17.4
6
56
140
2
1.6
NC 288
94
19.1
4
56
132
2
1.6
Pioneer 312A
94
15.8
3
44
113
8
2.4
DeKalb 925
92
16.7
6
48
109
7
1.7
Speight D-4
90
18.2
3
50
140
4
1.6
NC 46
82
16.8
5
47
119
6
2.3
White Entries
Coker 911
102
18.1
2
52
141
4
1.7
Dixie 29
95
17.6
7
56
144
2
1.6
Table 6.
Comparison of hybrids for certain characteristics
Southern Coastal Plain - Area IV
Three Year Average - 1960, 1961, 1962
Hybrid
Yield
Moisture
Lodged
Ear
Ears/100
Ear Tips
Designation
Bus/A
%
%
Height
Stalks
Exposed
Quality
Inches
%
Commercial Hybrids
Yellow Entries
Coker 71
105
20.2
30
49
152
2
1.4
Coker 67
102
19.3
31
48
154
1
1.4
Dixie 18
102
19.5
39
58
147
1
1.4
~
of Test
100
19.1
36
46
137
3
~
NC 270
99
21.1
36
46
124
5
2.2
Dixie 82
98
18.9
39
50
146
1
2.1
McNair 444
97
18.0
41
47
134
2
1.9
Britt 33
95
18.6
39
50
132
2
2.4
Edmund 121
95
21.0
35
43
120
3
2.3
Pioneer 309B
92
18.0
33
40
127
4
1.9
NC 288
91
19.9
37
49
134
0
1.9
NC 27
90
18.3
43
50
137
3
2.2
NC 46
82
17.4
37
38
116
8
2.2
White Entries
Coker 811A
107
18.7
30
45
166
1
1.7
Coker 911
103
18.4
36
46
144
4
1.5
Coker 811
98
20.6
33
50
160
1
1.7
Table 7.
Comparison of hybrids for certain characteristics
Northern Coastal Plain - Area V
Three Year Average - Regular
S~ortSeason - 1960, 1961, 1962
Yield
Moisture
Lodged
Ear
Ears/100
Ear Tips
Hybrid
Height
Exposed
Quality
Designation
Bus/A
%
%
Inches
Stalks
%
Commercial. Hybrids
Yellow Entries
McNair 304A
110
21.9
16
41
123
9
1.8
Wood V-51A
105
20.2
39
47
125
24
2.1
Pioneer 345-A
104
17.6
12
39
110
26
2.6
DeKa1b 803
102
19.3
14
42
102
5
1.8
Mean of Test
100
19.5
18
41
113
16
.hQ
-NC 46
97
20.2
25
41
122
11
2.0
Speight D-8
96
20.6
14
40
119
6
1.5
V.P.I. 648
96
20.2
13
42
105
34
2.0
DeKa1b 633
96
19.1
11
40
108
11
2.3
DeKa1b 837
95
19.4
28
38
107
23
2.3
Wood V-26Y
88
19.0
13
38
100
20
2.1
White Entries
Pioneer 503
104
18.8
21
46
105
12
1.8
Wood V-125W
100
19.3
26
46
111
9
2.'1
Table 8.
Comparison of hybrids for certain characteristics
Northern Coastal Plain - Area V
Three Year Average - Full Season - 1960, 1961, 1962
Hybrid
Yield
Moisture
Lodged
Ear
Ears/100
Ear Tips
Designation
Bus/A
%
%
Height
Stalks
Exposed
Quality
Inches
%
Commercial Hybrids
Yellow Entries
McNair 444
106
20.3
25
54
142
3
1.8
DeKa1b 1225
105
21.9
26
61
139
2
2.0
Dixie 82
103
22.9
29
57
149
1
1.9
Mean of Test
102
21.9
26
53
134
4
b.Q
NC 288
101
22.2
27
55
129
2
2.0
Speight D-4
100
21.3
29
50
140
3
1.7
NC 270
100
24.0
28
52
121
4
2.1
DeKa1b 1051
100
21.2
18
57
105
13
2.5
NC 42
99
21.5
33
54
136
3
2.0
NC 27
98
21.0
33
55
143
3
2.2
White Entries
Coker 911
111
21.2
24
51
153
3
1.8
19
Table 9.
Comparison of hybrids for certain characteristics
Northern Mountains - Area I
Two-Year Average - 1961-1962
Hybrid
Yield
Stand
Moisture Lodged
Ear
Ears/100
Ear Tips
Designation
Bus/A
%
%
%
Height
Stalks
Exposed
Quality
Inches
%
Commercial Hybrids
Yellow Entries
DeKalb 805
127
99
29.6
2
49
102
16
1.8
Ho11yview 100
117
97
30.1
7
52
139
22
2.2
Pioneer 345A
116
96
26.2
5
46
110
54
2.5
V.P.I. 648
107
92
29.4
3
52
120
76
3.6
DeKalb 640
105
95
29.2
2
55
123
20
2.2
Wood V-26Y
104
91
28.9
12
45
124
25
2.0
Mean of Test
104
93
29.2
5
50
ll1
30
~
McNair 304A
97
94
30.1
8
55
143
7
2.5
DeKalb 633
96
90
28.2
5
45
111
21
3.1
u.S. 282
92
94
31.9
12
61
122
32
2.4
DeKalb 427
83
90
25.1
10
36
117
45
4.0
Experimental Hybrids
Yellow Entries
McNair 302A
112
94
33.2
4
56
144
18
2.5
DeKalb X 92-213
96
89
29.2
0
43
116
19
3.0
Table 10.
Comparison of hybrids for certain characteristics
Southern Mountains - Area II
Two-Year Average - 1961-1962
Hybrid
Yield
Stand
Moisture Lodged
Ear
Ears/100
Ear Tips
Designation
Bus/A
%
%
%
Height
Stalks
Exposed
Quality
Inches
%
Conunercia1 Hybrids
Yellow Entries
Wagwood 200
128
96
26.8
2
54
180
2
3.0
DeKalb 805
127
97
23.4
4
45
100
12
2.6
DeKalb A-715
124
97
23.5
4
51
132
61
2.2
Pioneer 309B
123
92
25.3
2
49
146
6
2.5
Pioneer 309A
122
96
26.3
2
50
139
9
2.5
Coker 15
121
91
23.6
2
54
154
4
2.0
~
of Test
120
~
24.4
3
48
132
21
2.4
McNair 304A
116
94
24.2
1
50
142
6
2.2
V.P.I. 648
115
91
24.6
2
50
116
55
2.5
U.S. 282
114
93
24.1
9
56
132
36
2.0
Experimental Hybrids
Yellow Entries
McNair 302A
128
97
24.5
2
51
123
29
2.2
Table 11. Comparison of hybrids for certain characteristics Piedmont - Area III
Two Year Average - 1961-1962
Hybrid Yield Stand Moisture Lodged
H:~;ht
Ears /100 Ear TipsExposed Quality Designat ion Bus/A % % % Inches Stalks %Commercial Hybrids Yellow Entries
Wagwood 200 114 90 16.5 1 48 160 2 1.8 Coker 67 108 89 17.5 1 54 162 1 1.1 McNair 444 107 87 16.4 5 54 157 2 1.4
NC 270 107 88 19.3 3 53 141 7 1.3
Coker 15 104 88 15.0 5 47 150 3 1.4 Wagwood 100 104 87 17.8 4 46 123 6 ·2.0 Dixie 82 104 84 17.6 6 58 150 1 2.0 Pioneer 309B 102 86 15.8 3 47 142 2 1.3 Funk G-710AA 101 85 16.6 5 52 144 6 1.5
NC 42 101 82 16.9 9 58 140 1 1.3
~
£!.
Test 101!?
~...!!.
1Q 115..!±
~ McNair 444A 100 86 16.3 7 51 137 4 1.5NC 27 99 87 15.9 8 55 145 3 1.3
NC 288 98 84 17.1 4 54 140 1 1.4
Speight D-4 96 86 16.2 3 48 153 2 1.5 Speight D-14 96 88 17 .8 3 48 136 1 1.3 Pioneer 312A 95 91 14.2 3 45 117 9 2.1 DeKalb 805 92 88 13.9 0 41 106 18 2.7 DeKalb 925 91 86 15.0 4 48 110 6 1.6
NC 46 86 90 15.2 4 46 119 7 2.0
White Entries
Coker 911 109 91 15.8 50 147 1.2
McNair 425 102 77 16.5 50 167 1.2
Dixie 29 96 81 16.1 55 151 1.2
Table 12. Comparison of hybrids for certain characteristics Southern Coastal Plain - Area IV
Two Year Average - 1961-1962
Hybrid Yield Stand Moisture Lodged
HE~r
h Ears/100 Ear Tips Des ignat ion Bus/A % % % e i.g t Stalks Exposed QualityInches %
Commercial Hybrids Yellow Entries
Coker 71 110 95 17.1 5 50 153 2 1.2 Coker 67 106 95 16.9 3 49 153 2 1.2 Dixie 18 105 90 17.0 12 60 148 1 1.2 Funk G-745 104 92 1·7.0 11 55 145 4 1.4 Dixie 82 102 88 16.7 12 51 153 1 1.8 Wagwood 300 101 92 16.6 8 43 131 1 2.0
NC 270 100 91 18.4 9 48 128 6 2.2
McNair 444 98 90 16.2 15 49 134 1 1.9
~
£!.
Test ~zz
~lQ
~ 138-2
.!.:!
Britt 33 98 92 16.7 10 52 130 3 2.1 McNair 444A 96 93 16.8 13 45 132 2 1.4 Funk G-730A 96 89 16.4 11 48 143 2 1.8 Edmund 121 94 94 19.9 7 46 119 2 2.0 Pioneer 309B 92 88 16.3 8 42 132 4 1.8 Spe ight D-14 92 93 17.1 6 42 124 2 1.9
NC 288 91 89 17.1 9 51 134 1 1.8
NC 27 90 89 16.6 " 16 53 134 3 2.0 NC 46 84 88 16.2 12 40 122 "7 2.0 Beat X 3 81 91 17.1 6 43 106 14 2.7
White Entries
Coker 8llA 113 93 16.6 4 48 170 1.6 Coker 911 107 94 16.2 7 48 147 1.2"
Coker 811 102 90 17.6 6 52 164 1.6
Dixie 29 93 88 16.0 10 44 145 2.4
Experimental Hybrids Yellow Entries
M
&
W 120 104 93 16.1 13 43 141 2.0NC 1036-09 100 92 17.2 7 48 144 1.4
21
Table 13. Comparison of hybrids for certain characteristics Northern Coastal plain - Area V
Two Year Average - Full Season - 1961-1962
Hybrid Yield Stand Moisture Lodged Ear Ears/100 Ear Tips Des ignat ion Bus/A % % % HeightInches Stalks Exposed Quality
% Commercial Hybrids
Yellow Entries
McNair 444 101 92 19.7 9 51 138 3 1.8 DeKalb 1225 98 93 21.2 8 57 132 1 1.6 Funk G-730A 96 90 21.9 6 47 126 4 1.2
~~!!!!
21
n
~ ~ 1Q 128 ~l.:!
DeKalb 1051 95 92 20.7 6 53 103 11 2.1 Spe ight D-14 95 94 21.7 5 45 118 3 1.8
NC 42 95 92 20.6 16 52 134 3 1.9
NC 288 95 91 21.8 8 52 124 2 1.9
Dixie 82 95 90 21.6 7 53 139 1 1.8
Speight D-4 92 93 21.0 10 47 134 2 1.2
NC 270 91 91 23.9 13 51 120 3 1.8
NC 27 86 86 20.6 15 52 143 3 1.8
White Entries
Coker 911 105 95 20.5 7 49 147 1.6
Coker 8llA 98 90 22.8 3 49 155 1.1
Dixie 29 88 89 20.3 12 48 135 1.7
Experimental Hybrids Yellow Entries
M&W 120 101 93 21.0 11 46 131 3 2.0 McNair 444A 99 92 21.4 10 46 127 4 1.2 DeKalb X 9044-0 94 86 21.6 13 51 117 5 1.5
NC 1060 92 91 23.6 3 44 106 10 2.0
NC 1054 87 95 22.6 5 48 102 8 2.0
Table 14. Comparison of hybrids for certain characteristics Northern Coastal Plain - Area V
Two Year Average - Regular Short Season - 1961-1962
Hybrid Yield Stand Moisture Lodged
H~~;ht
Ears/100 Ear TipsExposed Quality Des ignat ion Bus/A % % % Inches Stalks %Commercial Hybrids Yellow Entries
Mo. 916 108 90 18.5 11 42 118 23 2.1 Coker 15 108 95 19.5 23 43 137 6 1.1 Hofmeyer's H6Ol. 105 90 19.8 11 40 110 31 1.4 McNair 304A 105 93 20.9 13 40 126 8 1.9 DeKalb 805 104 91 17.6 15 38 103 3 1.6 Watson 401 100 92 20.3 7 38 103 10 1.4 Pioneer 345A 100 95 16.6 9 39 110 27 2.6 DeKalb 803 95 92 18.6 8 40 101 5 1.8 Wood V-51A 94 89 19.8 36 44 119 28 1.8
~ ~Test
...:ll
.2.Q ~ ~12-
1121I
.hQ.DeKalb 633 91 90 17.8 6 39 105 11 2.4 Speight D-8 91 92 18.8 9 39 120 6 1.6
NC 46 91 92 19.2 24 39 119 11 1.8
V.P.1.648 89 90 19.7 12 41 104 37 1.8 Cargill 285 89 90 17.1 7 35 103 9 2.6 DeKalb 837 89 90 18.8 15 41 106 26 2.2 Funk G-83 84 92 17.3 12 32 104 11 2.2 Wood V-26Y 83 86 18.3 9 36 101 20 2.1 Hofmeyer's
Early Harvest 80 76 17.7 14 32.2 111 12 2.0 Ohio C-54 76 92 17.1 17 23 108 24 1.9 McCurdy 95 66 87 15.8 21 31 106 34 2.5
White Entries
Pioneer 503 96 93 18.5 14 45 103 13 1.7 Wood V-125W 91 88 18.5 24 42 105 10 1.8
Experimental Hybrids Yellow Entries
Table 15.
Com~.risonof hybrids for certain characteristics
Northern Mountains - Area I
Ashe County - 1962
Moisture Lodged
Ear
Ear Tips
Hybrid
Yield
Stand
Hei ht Ears/lOO
Designation
Bus/A
%
%
%
Inc es
~
stalks
Exposed
Quality
%
Commercial Hybrids
Yellow Entries
DeKalb 805
141
98
28.2
0
52
102
0
1.7
Pioneer 345-A
123
91
25.3
4
49
116
47
3.0
Pioneer 3166
121
90
27.2
4
48
119
22
3.0
Ho11yview 100
121
94
28.4
1
54
130
9
2.3
DeKa1b 824
118
94
26
"~"3-4
50
111
12"
2.4
AA 809
118
93
26.9 '
1
51
157
31
2.0
Ho11yview 50
1t1
91
26.8
3
52
126
32
2.7
V.P.I. 648
III
85
2.7."8
0
52
127
59
3.1
Oh.
&Mich. G-761
III
92
28.1
2
47
110
18
2.2
AA 642
110
88
26.0
2
49
135
60
2.4
Wood V-26Y
109
86
26.8
3
46
120
14
2.0
AA 649
108
92
28.4
3
53
121
25
2.6
~~!!!!
108
~
27.3
1
50
125
24
~
AA 648
106
84
26.5
0
52
121
51
2.7
DeKalb 640
105
92
27.8
1
54
123
1
2.4
u.S. 282
103
88
30.3
6
58
131
26
1.7
Ill. 200
102
97
27.8
14
53
130
31
4.1
McNair 304A
97
88
28.4
8
54
160
4
2.0
DeKalb 633
96
81
27.0
2
46
118
7
3.2
AA 837
87
78
30.1
2
50
124
28
2.7'
DeKalb 650A
86
80
26.3
4
46
125
7
2.2
DeKalb 427
84
81
23.3
12
38
136
"51
4.0
Experimental Hybrids
Yellow Entries
Funk 95239
120
92
26.5
4
42
118
19
2.3
McNair 302A
118
88
28.8
2
57
138
8
2.0
NC 2057
99
84
25.1
2
41
121
22
2.2
DeKa1bX92-213
94
79
28.2
1
44
116
9
3.0
L.S.D. (.05)
12
10
1.4
4
4
24
16
.6
( .01)
15
13
1.8
6
5
31
22
.8
23
fable 16.
Comparison of hybrids for certain characteristics
So~thern
Mountains - Area II
H,ywood County - 1962
Hybrid
Yield
Stand
Moisture Lodged
Height Ears/100
Ear
Ear Tips
Designation
Bus/A
%
%
%
Inches
Stalks
Exposed
Quality
%
Commercial Hybrids
Yellow Entries
Pioneer 3166
119
9~19.'0
8
43
101
44-
2.8
DeKalb 805
119
94
20.9
6
43
99
12
2.3
Wagwood 200
118
92
21.2
3
54
167
1
3.0
Mo. 916
116
98
21.0
4
52
112
22
2.5
McNair 304A
112
90
19.4
1
53
145
6
2.3
Best X3
112
91
20.4
5
57
121
25
2.0
Pioneer 309A
111
93
23.6
2
51
126
10
2.0
V.P.I. 648
107
93
20.5
3
50
107
66
2.0
Oh.&.Mich~
G-761 106
90
18.8
1
44
111
26
2.7
Coker 15
106
90
19.9
2
55
161
4
2.0
Mean
E!
!!!!
!Q.2
92
~
&.
48
ill
23
~
Pioneer 309B
104
89
21.1
4
50
144
5
2.0
DeKalb 803
103
92
19.8
13
46
98
17
2.0
U.S. 282
102
87
18.5
16
57
124
25
2.0
Wagwood 300
102
95
25.6
1
50
143
a
2.8
DeKa1b 1003
101
94
17.6
10
50
115
22
2.3
DeKalb 837
101
92
20.6
10
48
117
33
2.5
NC 980
93
90
22.9
10
28
104
16
2.0
White Entries
Funk G-580W'
104
89
20.6
8
52
160
3
2.0
DeKalb 925
97
92
21.8
14
50
126
5
2.3
Experimental
Hybr~dsYellow Entries
Va. 219
117
9S
19.9
5
46
104
47
2.5
McNair 302A
114
94
20.2
2
54
114
23
2.3
DeKalb A71S .
112
94
18.5
6
52
128
61
2.5
Ho11yv1ew 100
110
96
22.5
0
55
111
19
2.2
Va. 148C
110
94
19.7
4
47
112
·43
2.5
Va. 3b
105
93
19.3
2
43
108
34
2.8
DeKalb B 904
102
90
19.4
4
46
104
9
2.2
NC 2036
101
90
20.2
12
46
135
14
2.3
Va. 556
99
83
20.6
13
46
119
26
2.5
Ho11yview 150
98
90
22.0
0
48
120
52
2.8
'unk 11666
93
94
21.4
4
39
106
13
2.2
L.S.D.
(.OS)
10
NS
1.9
8
4
12
12
.5
(.01)
13
NS
2.5
11
6
16
16
.6
Table 17. Comparison of hybrids for certain characterlatlcs Piedmont - Area III
Stokes and Lincoln Counties - 1962
Hybrid Yield Stand Moisture LodgingHE~rht Ears/100 Ear Tips Exposed Quality Des ignat ion Bus/A % % %
I:~:es
Stalks %Commercial Hybrids Yellow Entries
Wagwood 200 123 83 14.8 1 46 186 1 1.5 Funk G-732* 120 84 14.4 0 49 171 5 1.6 McNair 444 118 79 14.6 6 53 185 4 1.7 Coker 67 116 84 15.1 2 55 188 1 1.2
NC 270 115 78 16.4 4 49 166 11 1.6
Dixie 82 109 74 15.5 4 52 182 1 2.0
NC 27 106 77 14.5 10 52 178 3 1.6
Coker 15 105 80 14.2 44 174 4 1.7
Mo.916* 102 81 14.2 45 116 14 2.2
Funk G- 710AA* 101 78 14.8 50 171 6 2.0 Wagwood 300 101 83 16.5 45 142 2 2.1 Wagwood 100 100 79 16.0 44 132 6 2.0
NC 288 100 73 15.2 49 172 3 1.9
SC 236 99 85 14.7 52 154 2 1.4
Mean
II
Test.si
11.
1i.:.Q -1. ~ 149..J.
.!:.QNC 42 96 74 14.8 11 53 159 2 1.6
Pioneer 309B 96 78 14.6 3 44 163 2 1.6 Speight D-14 96 77 14.7 2 45 158 1 1.6 Speight D-4 94" 77 14.5 3 47 187 2 1.9 Pioneer 312A* 89 85 14.4 5 39 123 14 2.2 DeKalb 1004 84 83 15.1 7 47 109 14 2.5 DeKalb 898B* 83 82 14.5 3 49 109 29 2.8
NC 46* 82 83 14.4 6 44 128 12 2.1
NC 980 80 81 15.8 4 21 115 18 2.4
Watson 401* 78 78 15.0 4 37 118 14 2.4 Cargill S 440* 76 80 13.7 1 40 106 29 2.5 Pioneer 3166* 76 80 14.4 3 38 101 30 2.6 Beam B&B x 391* 76 82 14.4 9 46 122 16 2.0 DeKalb 805* 75 78 13.9 1 38 111 31 3.4 V.P.I. 648* 65 75 14.8 0 44 114 53 2.8 DeKalb 803* 65 79 14.3 2 37 113 12 2.3
White Entries
Coker 911 115 85 13 .9 0 49 164 1.3 McNair 425* 109 74 15.1 1 50 191 1.5 Funk G-795W 105 79 14.0 13 48 189 1.9
Dixie 29 87 70 14.8 11 51 170 1.4
DeKa1b 925 81 77 14.2 4 43 122 2.1
Experimental Hybrids Yellow Entries
NC 1072-13* 130 76 15.1 1 44 191 1 1.4
sc1037* 124 86 15.3 3 51 176 5 1.9 NC 1075-09 * 121 82 15.0 0 48 166 1 1.4 Pioneer 8224 120 84 15.5 12 47 164 2 1.6 NC 1040* 116 84 15.7 3 46 168 1 1.7 Pioneer 8218* 112 82 15.3 1 49 155 3 1.9
NC 1402 109 79 15.5 2 44 159 5 1.5
NC 1066-13 107 76 16.2 2 47 166 1 1.8 NC 1037-15 105 77 15.4 3 49 165 4 1.7 NC 1037-13 104 76 16.5 2 50 162 0 2.1 McNair 444A * 103 76 15.3 5 49 158 5 2.0 McNair 444B 101 78 15.2 4 49 157 3 1.8 NC 1060* 99 74 17 .2 2 44 134 8 2.5
NC 1403 98 79 15.6 1 46 161 1 1.8
NC 1422 98 77 17.1 3 46 155 1 1.9
NC 1068-09 * 92 79 16.8 0 53 133 6 2.0
NC 1068 91 80 16.7 0 49 148 2 2.0
DeKalb C-910 * 90 79 15.3 4 46 128 10 2.0 DeKa1b B 904 * 79 76 14.4 3 40 115 12 2.5 NC 2058 * 77 76 14.0 1 44 103 31 2.6 NC 2057 * 49 74 13.7 0 34 100 45 2.7
L.S.D. (.05) NS .9 1 5 23 10 .7
(.01) NS 1.2 1 7 31 14 .9
C. V. ( % ) 11 6 219 11 15 115 34
25
Table 18. Comparison of hybrids for certain characteristics Southern Coastal - Area IV
Robescn , Duplin, Lenior, Brunswick Counties - 1962
Hybrid Yield Stand Moisture Lodged Ear Ears/100 Ear Tips Des ignat ion Bus/A % % % Height Stalks Exposed Quality
Inches %
Conunercia1 Hybrids Yellow Entries
FunkG-732 119 91 15.6 5 46 146 8 1.8
Coker 71 118 91 16.0 4 50 164 4 1.5 Coker 67 115 90 15.6 4 48 172 3 1.5 Dixie 18 115 83 15.7 10 59 166 1 1.5 Greenwood 18 114 88 16.1 11 56 155 1 1.5
Funk G-745 113 88 16.0 14 52 164 6 1.7
Edmunds 200 112 90 16.2 14 47 160 2 2.2 Greenwood 471 112 82 15.6 7 52 179 1 1.5 Best X 11 106 92 15.8 12 46 153 2 2.1 Best X 7 106 87 17.0 15 46 136 6 2.1 Best X 9 105 88 16.2 13 48 156 2 2.4 Wagwood 300 104 92 16.3 6 45 136 2 2.1 Edmund 121 103 90 17.4 13 46 138 3 1.9 Mean
!!!
Tes t 103!?
!i:1
.!Q ~ 150.l=
1:..:1
Dixie 82 100 79 15.7 19 51 174 3 1.7 Funk G-730A 100 81 15.5 11 48 156 3 1.7 McNair 444A 99 88 15.6 14 46 146 3 1.8 McNair 444 98 83 15.2 16 48 149 2 1.8NC 270 96 82 16.9 13 48 142 11 2.3
Bdtt 33 96 88 15.7 9 47 132 6 2.2
NC 27 93 82 15.2 21 52 156 4 1.9
Speight 0-14 91 89 15.9 8 42 135 4 1.8 Pioneer 309B 91 81 15.4 10 42 144 7 1.6 Best X 3 87 86 15.2 11 42 114 20 2.4
NC 288 87 82 16.0 13 49 142 2 1.7
Watson 401 82 91 15.5 4 37 105 14 2.0
NC 46 82 82 15.2 17 42 129 14 2.0
White Entries
Coker 811A 122 88 15.8 5 45 185 1.2 Coker 911 115 91 15.2 10 47 163 1.4 McNair 425 111 87 15.6 9 46 168 1.7
Coker 811 110 84 16.2 8 51 186 1.2
Funk G-795W 101 86 15.0 16 43 186 1.8
Dixie 29 100 80 15.4 12 46 168 1.7
Experimental Hybrids Yellow Entries
SC 236 119 93 15.5 7 48 163 4 1.2
Pioneer 8218 116 91 15.9 8 47 136 3 2.0
NC 1403 112 90 16.3 3 43 139 2 1.7
M&W 120 111 91 15.4 17 42 158 4 2.1 NC 1420-4 110 91 15.9 8 45 143 4 2.0
NC 1411 110 89 15.7 4 42 140 2 1.5
NC 1036 109 88 16.1 16 45 168 3 2.1 Pioneer 8224 107 90 15.8 25 46 170 .4 2.0
NC 1402 107 88 16.2 9 44 153 2 2.0
McNair 0158 107 83 15.7 17 48 171 1 1.6 NC 1423-01 105 90 16.4 8 44 142 '4 2.0 McNair 444B 103 90 15.8 9 46 152 4 1.9 DeKalb X 9513-0 102 76 16.3 4 53 162 7 2.7 NC 1036-09 102 87 15.6 8 48 161 .3 1.8 NC 1037-15 101 84 16.2 12 46 141 5 2.4
NC 1006 101 90 17.3 6 45 119 3 1.8
Greenwood 0448 100 72 16.7 6 54 177 4 1.6 NC 1045 100 84 17 .5 12 40 114 12 2.6
NC 1412 98 87 15.9 7 41 142 10 1.9
NC 1418 98 88 15.8 8 44 155 4 1.7
M&W 130 97 86 16.2 6 41 120 9 2.3
NC 1068 96 85 16.8 2 48 129 4 2.4
NC 1068-13 95 86 16.3 3 51 120 9 2.4 Speight D-15 72 90 15.0 8 38 148 2 1.5
L.S .0. (.05) 11 5 .4 8 3 14 4 .4
( .01) 15 7 .6 10 4 18 5 .5
Table 19. Comparison ofhybri~sfor certain characteristics Northern Coastal Plain - Area V
Halifax, Martin, Camden Counties - Full Season Test - 1962
Hybrid Yield Stand Moisture Lodged
H:~;ht
Ears/100 Ear TipsExposed Quality Designat ion Bus/A ~ ~ ~ Inches Stalks %Commercial Hybrids Yellow Entries
Pioneer 309A 110 90 18.5 3 48 117 10 1.5 Speight D-14 109 91 19.7 6 51 129 5 1.6 Funk G-732 106 92 20.6 8 51 134 9 1.5 M & W 130 103 89 21.3 4 48 109 20 2.4 Funk G-730A 101 84 19.4 10 51 139 6 1.5 DeKa1b 1051 101 90 19.7 6 55 106 17 2.2 McNair 444 100 86 18.8 13 52 148 ~ 1.5 DeKalb 1225 99 89 19.7 12 57 141 4 1.3
!!!!!!
~!!!!
-l!
~ll.:1
12
iQ 132..1
.hI
Dixie 82 96 83 19.9 11 55 154 1 1.7
NC 288 96 87 20.4 10 55 130 4 1.8
DeKalb 898B 96 91 18.0 12 48 104 19 2.1
NC 42 96 88 19.4 18 52 138 4 1.8
Pioneer 309B 95 77 19.1 8 48 143 8 1.6
Gr~enwood226 95 83 19.7 7 48 151 3 1.3
US 578 95 88 19.4 16 51 110 31 2.0
OeKa1b 1004 92 89 18.6 -. 5 50 101 14 2.1 Speight D-4 91 92 19.9 18 50 141 4 1.5
NC 270 89 88 22.5 21 51 129 5 1.6
DeKa1b 1003 88 90 17.'5 12 50 107 29 2.0
NC 27 88 82 18.8 21 54 157 3 1.6
White Entries
Coker 911 114 92 18.6 12 51 162 5 1.2 Greenwood 109 110 92 18.1 9 51 164 1 1.1 McNair 425 108 88 19.1 8 54 163 4 1.4 Coker 811A 101 80 21.0 4 54 168 2 1.2 Pioneer 509 94 88 17.4 11 48 119 15 1.7 Dixie 29 89 83 18.7 15 52 139 2 1.4
Experimental Hybrids Yellow Entries
NC 1037 114 93 21.0 15 52 143 2 2.1
NC1404-4 109 89 19.8 10 49 132 11 1.9
NC 1068 109 91 22.2 3 49 126 8 3.0
M&W 120 108 90 ' 19.0 21 49 146 5 2.1
NC 1422 i06 82 21.9 9 50 152 3 1.7
Pioneer 8224 106 94 18.7 13 49 152 4 1.5 Pioneer 8218 106 88 19.7 4 51 130 3 1.5 McNair 444A 106 86 19.6 16 50 142 6 1.5
NC 1040 106 90 20.6 7 48 139 5 1.8
McNair 444B 105 90 18.9 12 52 138 5 1.5 NC 1403 105 90 21.8 12 49 129 3 1.4 NC 1037-13 104 88 20.8 5 51 128 2 1.6
SC 236 102 94 20.0 3 54 146 4 1.2
NC 1037-15 100 85 20.6 10 49 139 6 2.1 NC 1041 98 91 21. 7 12 48 117 11 2.0
NC 1060 96 84 22.1 4 46 111 17 2.1
NC 1068-13 96 8~ 21.8 4 52 114 6 1.9
NC 1054 93 92 21.6 9
W-
109 11 1.9OeKalb 9044-0 93 78 20.5 20 54 129 7 2.0 NC 1068-09 93 85 22.0 6 51 114 5 1.8 NC 1207-02 88 87 22.0 18 49 117 5 1.6 OeKalb B 904 86 85 18.2 3 43 102 5 1.9 Speight 0-15 81 91 18.3 7 45 133 3 1.2
L.S.O. (.05) 14 6 1.2 10
a
16 6 .5( .01) 19 8 1.6 14 4 21 7 .6
27
Table 20. Comparison of hybrids for certain characteristics Northern Coastal Plain - Area V
Halifax, Martin, Camden Counties - Regular Short Season Test - 1962
Hybrid Yield Stand Moisture Lodged Ear Earsl100 Ear Tips Des ignat ion BuslA 1- 1- '70 HeightInches Stalks Exposed Quality
1-Commercial Hybrids Yellow Entries
Coker 15 120 95 19.2 41 45 139 10 1.2 McNair 304A 118 91 21.0 14 41 129 11 1.8 Hofmeyer's H601 116 88 19.5 10 44 114 40 1.8 Todd 862 113 89 17.4 12 46 118 13 1.5 DeKalb 805 11~.' 91 17.2 10. 43 101 5 1.3 Pioneer 323 112~ . 91 17.8 2 42 108 34 2.1 Pioneer 3166 111 91 18.4 10 44 105 33 2.2 Cargill S-440 108 87 17.5 12 43 101 21 2.1 Mo. 916 107 91 17 .5 21 46 120 21 2.2 Pioneer 345A 105 95 16.4 10 42 112 41 2.2 Watson 401 103 90 19.7 9 42 101 14 1.8
!1!!!!
~!!!!
!l:.2.
~ ~ill
~II
Best X 3 99 86 18.3 31 44 114 22 2.4 Cargill 315 99 91 16.6 3 42 107 31 2.2 Speight D-8 98 91 18.5 ~12 42 123 12 1.3 DeKalb 803 98 89 18.0 9 44 101 6 1.6 Cargill 340 97 83 16.8 10 40 106 15 2.1 FunkG-83 96 90 16.8 4 38 102 15 1.5 Oh.6c Mich. G-761 96 86 17.8 3 39 104 23 2.2 Cargill 285 96 88 16.5 2 40 103 13 2.1 DeKalb 633 96 89 17.4 2 42 100 16 1.8 V.P. 1. 648 95 86 18.8 15 42 105 50 1.7
NC 46 92 86 19.1 40 39 127 16 1.7
DeKalb 837 92 86 18.1 17 44 107 35 2.4 DeKalb 632 92 90 17.4 10 42 108 16 1.9 McNair 302 92 89 17.7 39 43 113 16 2.5 P.A.G. 285 91 89 16.1 16 38 110 11 1.5 Wood V-51A 88 84 19.5 52 44 123 35 1.6 FunkG-72 87 86 16.6 3 39 107 25 1.8 Todd B8R 87 88 17.2 24 41 102 31 2.1 Wood V-26Y 86 80 17.6 5 42 102 30 1.8 Hofmeyer's Early
Harvest 85 78 17.0 6 42 108 20 2.1 Ohio C-54 82 90 16.5 14 39 112 33 1.8 P.A.G. 234 74 92 15.4 23 39 111 36 2.1 McCurdy 95 71 83 15.5 21 39 109 49 2.0
White Entries
Funk G-580W 111 85 19.3 15· 43 160 3 1.4 Ky. 5921 111 93 18.0 8 41 104 25 1.6 Pioneer 503 96 88 18.3 16 45 105 23 1.4 Wood V-125W 86 81 18.4 35 44 107 11 1.7
Experimental Hybrids Yellow Entries
Pioneer 310 132 96 18.4 4 44 116 15 1.9 Speight D-5 116 96 17.9 22 42 132 12 1.8 DeKalb C-910 111 92 19.6 12 44 122 20 2.2 Watson 403 110 93 19.2 7 42 101 24 1.4 McNair 302A 106 88 17.7 14 46 116 20 2.0
Va. 30 106 92 17.7 9 42 109 21 1.7
Todd Exp.T-4874 lOS 91 17.3 23 46 118 33 2.1 Va. 148-C 101 92 18.4 7 41 103 52 2.0 Van's V8-XOl 101 80 18.4 6 50 102 8 1.1 Va. 219 101 90 17.4 7 40 105 29 2.0 Watson 405 100 87 19.3 11 44 112 5 1.8 DeKa1b 824 100 92 17.7 9 44 104 17 2.1
AA 649 99 81 18.3 4 45 116 33 2.6
M 6c W 202 95 80 18.2 6 38 122 61 1.9 M 6c W 201 92 85 16.9 22 42 113 45 2.1
AA 627 92 75 19.6 5 42 100 29 1.9
Va. 556 89 80 1'8.3 12 42 109 27 1.6 White Entries
Ky. 5901 T 100 85 17.6 18 42 109 38 1.4 L. S . D. (.05) 12 7 .9 14 4 11 12 .5
( .(1) 16 9 1.2 19 6 15 16 .7
table 21. Comparison of hybrids for certain characteristics Northel;'tl Coastal Plain - Area V
Halifax, Martin, Camden Counties - High Fertility Short Season Test - 1962
Hybrid Yield Stand Moisture Lodged
H:~;ht
Bars1100 Bar TipsBxposed Quality Designation BuslA % % % Inches Stalks %Commercial Hybrids Yellow Enties
Coker 15 133 91 18.4 24 44 114 4 1.4 Cargill S 440 130 87 17.4 12 46 98 8 2.1
on.sMich. G-761 129 88 17.6 3 44 97 12 1.6 McNair 304-A 128 90 20.4 21 44 107 8 1.9 Watson 401 127 88 18.8 12 42 100 7 1.7 DeKalb 633 125 88 17.0 11 42 103 10 1.6 DeKalb 805 124 82 17.0 6 42 103 4 1.5 Best X 3 124 85 16.7 17 44 104 14 2.0 Pioneer 323 124 85 17.2 11 43 102 13 1.7 Todd 862 124 90 16.8 17 46 105 10 1.8 Mo. 916 123 84 17.4 26 46 100 16 2.1 Hofmeyer's H601 123 84 18.2 12 47 102 30 2.1 Pioneer 3166 123 84 17.3 16 43 103 15 2.0 DeKa1b 803 121 88 17.1 10 45 99 3 1.6 Pioneer 345A 118 93 15.7 19 42 100 20 1.8 Funk G-83 117 87 16.9 6 38 99 9 1.4 DeKa1b 837 115 88 17.4 32 41 98 34 2.0 Cargill 315 115 88 16.2 11 42 101 18 2.0
~.2!Test 115 ~ ~
.!!
~ 102II
l:!
NC 46 114 82 18.4 29 45 106 14 1.6
Funk G-72 112 84 15.9 9 38 104 9 1.8 V.P.1. 648 112 87 18.7 16 43 99 31 1.6 DeKa1b 632 112 88 16.7 8 40 96 8 1.8 Cargill 340 110 86 16.2 17 42 96 10 2.0 P.A.G. 285 109 90 15.3 16 39 102 10 1.9 Cargill 285 108 85 15.4 14 41 102 8 2.1 Wood V-51A 108 82 19.0 62 47 101 19 2.1 Hofmeyer's Bar1y
Harvest 107 78 16.0 11 44 100 14 1.7 Todd 88R 107 87 16.8 9 40 100 12 2.0 Speight D-8 105 88 18.1 27 44 108 3 1.2 Wood V-26Y 100 79 17.7 10 43 96 21 2.0 Ohio C-54. 98 88 15.8 23 40 97 17 1.6 P.A.G. 234 91 91 15.7 28 40 98 20 2.0 McNair 302 90 77 16.7 42 45 102 10 1.9 McCurdy 95 87 84 15.6 22 40 98 34 2.0
White Entr'ies
Funk G-580W 120 79 19.0 31 46 138 1 1.6 Ky. 5921 113 86 17.1 24 45 101 11 1.7 Pioneer 503 109 85 17.3 34 44 93 12 1.5 Wood V-215W 109 88 17.0 37 48 94 8 1.8
Experimental Hybrids Yellow Entries
Watson 403 138 93 19.0 8 43 98 12 1.9 Pioneer 310 137 85 17.8 11 44 108 8 1.6 Watson 405 128 88 18.5 6 44 95 4 1.7 DeKalb 824 125 92 17.1 13 46 100 9 1.8 M&W 201 121 84 16.9 7 44 101 33 2.0 Speight D-5 119 83 17.4 15 44 108 7 1.2 McNair 302A 119 85 16.9 18 49 100 11 2.2 AA 649 117 79 17.4 17 48 106 18 2.2 Va. 30 116 81 17.5 10 42 100 18 1.6 DeKalb C-910 115 87 19.8 23 46 104 11 1.8 Van! s V8-XC1 115 76 17.8 15 50 102 6 1.2 Todd Exp. T-4874 114 84 17.0 28 46 100 18 1.9 Va. 219 114 83 17.3 15 43 101 16 1.9 M&W 202 110 83 18.0 18 44 105 36 1.9 Va. 148C 108 81 18.1 13 42 100 40 2.0
AA 627 108 69 20.4 6 43 104 21 1.6
Va. 556 105 76 18.1 14 45 91 21 1.5 White Bntries
Ky. 5901 T 113 82 17.1 20 45 '101 14 1.7 L.S.D. ( .05)( .01) 15 8 1.0 10 5 14 8 .5
19 11 1.4 13 7 19 10 'NS