Patterns of Selection on Synonymous and Nonsynonymous
Variants in
Drosophila miranda
Carolina Bartolome´,*
,1Xulio Maside,*
,2Soojin Yi,
†,3Anna L. Grant* and Brian Charlesworth*
*Institute of Evolutionary Biology, School of Biological Sciences, University of Edinburgh, Edinburgh EH9 3JT, United Kingdom and †Department of Ecology and Evolution, University of Chicago, Chicago, Illinois 60637-1573
Manuscript received June 30, 2004 Accepted for publication November 21, 2004
ABSTRACT
We have investigated patterns of within-species polymorphism and between-species divergence for synony-mous and nonsynonysynony-mous variants at a set of autosomal andX-linked loci ofDrosophila miranda. D. pseudoobscura
andD. affiniswere used for the between-species comparisons. The results suggest the action of purifying selection on nonsynonymous, polymorphic variants. Among synonymous polymorphisms, there is a signifi-cant excess of synonymous mutations from preferred to unpreferred codons and of GC to AT mutations. There was no excess of GC to AT mutations among polymorphisms at noncoding sites. This suggests that selection is acting to maintain the use of preferred codons. Indirect evidence suggests that biased gene conversion in favor of GC base pairs may also be operating. The joint intensity of selection and biased gene conversion, in terms of the product of effective population size and the sum of the selection and conversion coefficients, was estimated to beⵑ0.65.
D
ROSOPHILAmiranda(a close relative ofD. pseudo- reflects the cumulative effects of this reduction in the efficacy of selection.obscura) provides a model system for studying the
In accordance with theoretical expectation, silent-site evolutionary effects of reduced recombination. In this
diversities at neo-Y loci are reduced compared with species, an autosome (Muller’s elementC) has become
their neo-Xlinked homologs (Bachtrogand
Charles-fused to the Ychromosome and does not recombine
worth2002). In addition, data on protein evolution (the neo-Y), while its homolog (the neo-X) cosegregates
on the neo-sex chromosomes of this species (Yi and with theXchromosome and recombines in the
homoga-Charlesworth2000;Bachtrog2003a,b) suggest that
metic females (MacKnight 1939; Steinemann and
there has been an accumulation of amino acid
substitu-Steinemann1998). The neo-Ychromosome shows clear
tions on the nonrecombining neo-Y. This probably re-signs of incipient loss of gene function, including
ab-flects a weakening of the effectiveness of selection sence of genes, reduction in gene expression, and major
against deleterious amino acid substitutions. In addi-changes (such as deletions) to some coding sequences
tion, there is an apparent excess of fixations of synony-(MacKnight1939;SteinemannandSteinemann1998;
mous mutations, creating unpreferred codons on both
Bachtrog2003a,b). The absence of genetic
recombi-the neo-Xand neo-Ychromosomes (Bachtrog2003b). nation on the neo-Ychromosome is expected to result
While a reduction in the effectiveness of selection for in reduced levels of genetic variability and adaptation,
codon usage on the neo-Ychromosome ofD. miranda
reflecting a reduction in effective population size caused
is in accord with expectation, the reduction for neo-X
by various types of Hill-Robertson effects associated with
genes is surprising, in view of the evidence for selection selection acting on a nonrecombining block of genes
on codon usage in D. pseudoobscura (Akashi and (reviewed byCharlesworthandCharlesworth2000).
Schaeffer1997). But the effective population size (Ne)
The degeneration of the neo-Ychromosome probably
ofD. mirandaappears to be much smaller than that of
D. pseudoobscura(Yiet al.2003). Unless there is extreme mutational bias in favor of unpreferred codons (McVean Sequence data from this article have been deposited with the EMBL/ andCharlesworth1999;Takano-Shimizu1999), this
GenBank Data Libraries under accession nos. AY754390–AY754609. could have resulted in evolution toward reduced codon
1Corresponding author:Unidade de Xene´tica Evolutiva, Instituto de
usage bias (Bachtrog 2003b), since lower Ne means Medicina Legal, Facultade de Medicina, Universidade de Santiago de
that genetic drift is more likely to overcome the effect
Compostela, 15782 Santiago de Compostela, Spain.
E-mail: [email protected] of selection and cause the fixation of weakly deleterious
2Present address: Unidade de Xene´tica Evolutiva, Instituto de
Medi-mutations (Kimura 1983). Examples of evolution
to-cina Legal, Facultade de Medito-cina, Universidade de Santiago de
Com-ward reduced codon usage bias in species with smallNe, postela, 15782 Santiago de Compostela, Spain.
such as D. guanche (Perez et al. 2003), are consistent
3Present address:School of Biology, Georgia Institute of Technology,
310 Ferst Dr., Atlanta, GA 30332. with this process.
E, B, and A, respectively (Ashburner 1989). For the other
The primary objective of this analysis was to examine
genes, a single allele from each species was investigated.
De-the patterns of protein evolution and codon usage bias
scriptions of the sequences analyzed are given in Table 1.
on autosomal andX-linked genes ofD. miranda, to deter- Primers were designed for regions conserved betweenD. mine whether the patterns observed for genes located melanogaster and D. pseudoobscura after identifying their
or-thologous sequences by means of a BLAST search from http://
on the neo-sex chromosomes are a general feature of
hgsc.bcm.tmc.edu/blast/?organism⫽Dpseudoobscura and
sub-this species. We used the publicly available genome
se-sequent alignment. Genomic DNA samples were extracted
quence of D. pseudoobscura(http://hgsc.bcm.tmc.edu/
from a single male of each line using Puregene (Gentra
Sys-projects/drosophila/), and a set of DNA sequences that tems, Minneapolis). We employed standard PCR procedures we determined fromD. affinis, for the between-species using the Expand high-fidelity PCR system (Roche
Diagnos-tics, Lewes, East Sussex, UK), gel purifying the products with
divergence estimates.D. affinisis the only readily
avail-Qiaquick (QIAGEN, Crawley, West Sussex, UK).
able relative of D. pseudoobscura and its sibling species
Cloning and sequencing:Sequences were cloned from
puri-(Powell1997), yet has been little studied at the level
fied PCR products using TOPO-TA (Invitrogen, San Diego),
of DNA sequences. The use ofD. affinistogether with except for theX-linked loci for which the use of a single male
D. pseudoobscuraallows assignment of mutations to the fly should ensure the hemizygosity of the templates. DNA
sequencing was performed on an ABI3730 automatic
sequenc-two branches of the phylogeny connectingD. miranda
ing machine using Dyenamic (Amersham Biosciences, Little
andD. pseudoobscura to their common ancestor, which
Chalfont, Buckinghamshire, UK). To minimize errors in the
is extremely useful for inferring patterns of evolution
sequencing procedure for autosomal loci, at least three
plas-and variation at synonymous plas-and noncoding sites mids from each cloning reaction were sequenced. Both strands (Akashi1996;Masideet al.2004). In addition, its rela- were sequenced. All read-outs were checked for accurate base
calling and assembled using Sequencher (Gene Codes, Ann
tively high level of divergence from the other two species
Arbor, MI). Sequences have been deposited in GenBank
(ac-makes it useful for estimates of net between-species
di-cession nos. AY754390–AY754609).
vergence.
Sequence analyses: Sequences were edited and manually
The results indicate that efficient purifying selection aligned using Se-Al (A. Rambaut, http://evolve.zoo.ox.ac.uk/ is acting on amino acid replacement polymorphisms, software.html?name⫽Se-Al). Noncoding DNA (introns and
5⬘- and 3⬘-flanking sequences) alignments were performed
and that selection is still maintaining codon usage at
using McAlign (KeightleyandJohnson 2004), a program
the loci that we studied. The apparent ineffectiveness
that implements a statistical method based on an evolutionary
of selection on codon usage on the neo-Xchromosome
model of the frequency distribution of gaps and substitutions
(Bachtrog2003b) is probably a consequence of poly- observed in Drosophila. Slight differences from the alignment morphic variants having been classed as fixed differ- used byYiet al.(2003) for the genes used in that study mean
that there are some numerical differences from their estimates
ences.
of divergence and polymorphism. Population genetic analyses were conducted with DnaSP (v. 3.99;Rozas1999).
Fop, the frequency of “optimal” codons in a gene (Marais MATERIALS AND METHODS andDuret2001), was calculated for each gene ofD. miranda using a C program, kindly provided by L. Duret, applying
Strains used:We studied 12D. mirandalines derived from
the table of optimal codons forD. pseudoobscura(Akashiand single wild-caught females: 0101.3, 0101.4, 0101.5, 0101.7 (Port
Schaeffer1997). Amino acid mutations and synonymous sub-Coquitlam, British Columbia, Canada), 0101.9, MA28, MA32
stitutions were assigned to either theD. mirandaorD.
pseudoob-(Mather, CA), SP138, SP235, SP295 (Spray, OR), MSH22, and
scurabranches of the phylogeny connecting these two close MSH38 (Mount Saint Helena, CA). The flies were originally
relatives to the outgroup speciesD. affinis, assuming parsimony obtained from the National Drosophila Species Resource
Cen-(Akashi1996). Only changes assigned to theD. miranda lin-ter (Bowling Green, OH) and from M. Noor and W.W.
Ander-eage were used in the analysis of patterns of polymorphism. son. Two other lines from different species were used as
out-groups: a strain of D. affinis from Nebraska (no. 0141.2; Drosophila Species Resource Center) and a strain ofD.
pseudo-RESULTS
obscurafrom Mather, California (provided by J. Coyne). Stocks of all three species were reared on banana medium at 18⬚.
Sequence polymorphism data: Nucleotide diversity
DNA extraction and PCR amplification:The genes studied
within D. miranda at each locus is shown in Table 2.
here were initially selected from the sequences ofD.
pseudoob-The most variable gene was rosy, in agreement with scura available in GenBank until the release of its complete
genomic sequence (http://hgsc.bcm.tmc.edu/projects/dro previous reports showing that it is highly polymorphic at
sophila/), which subsequently allowed us to broaden the the coding sequence level in several Drosophila species choice of loci. Some of these genes were included in a previous (Riley et al. 1992; Begun and Whitley 2002). The study of chromosomal and DNA sequence variation inD.
mi-unweighted average silent pairwise nucleotide diversity randa(Yiet al.2003; see Table 1). We used a longer sequence
for all the genes studied was 0.41% although a slight
forGapdh2than didYiet al.(2003), so that the data for this
locus are new. Twenty loci were used for the population survey overall difference between autosomal andX-linked loci
results reported here: 6 of them are located on chromosome was detected (means of 0.48%vs.0.28%, respectively).
2ofD. miranda(bcd,Bruce, Gld,hyd, sry-alpha, androsy), 7 on The results given in Table 3 show that there is no signifi-chromosome4(ade3,Adh, amd, Ddc,Eno,Lam, andUro), and
cant difference in mean Ks for silent or synonymous 7 on the left arm of theXchromosome (AnnX,Cyp1, Gapdh2,
sites between autosomal andX-linked genes (the means scute, sesB, sisA, andswallow;Yi et al.2003; our unpublished
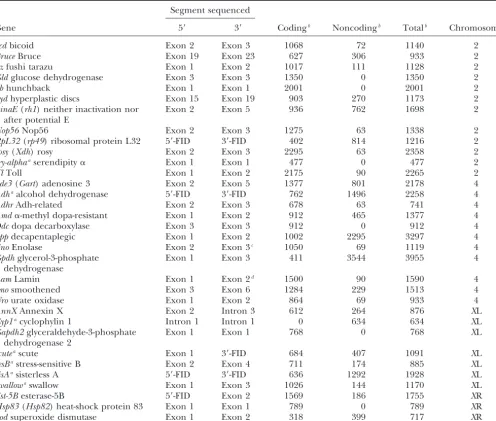
TABLE 1
Details of the genes studied
Segment sequenced
Gene 5⬘ 3⬘ Codingb Noncodingb Totalb Chromosome
bcdbicoid Exon 2 Exon 3 1068 72 1140 2
BruceBruce Exon 19 Exon 23 627 306 933 2
ftzfushi tarazu Exon 1 Exon 2 1017 111 1128 2
Gldglucose dehydrogenase Exon 3 Exon 3 1350 0 1350 2
hbhunchback Exon 1 Exon 1 2001 0 2001 2
hydhyperplastic discs Exon 15 Exon 19 903 270 1173 2
ninaE(rh1) neither inactivation nor Exon 2 Exon 5 936 762 1698 2
after potential E
Nop56Nop56 Exon 2 Exon 3 1275 63 1338 2
RpL32(rp49) ribosomal protein L32 5⬘-FID 3⬘-FID 402 814 1216 2
rosy(Xdh) rosy Exon 2 Exon 3 2295 63 2358 2
sry-alphaaserendipity␣ Exon 1 Exon 1 477 0 477 2
TlToll Exon 1 Exon 2 2175 90 2265 2
ade3(Gart) adenosine 3 Exon 2 Exon 5 1377 801 2178 4
Adhaalcohol dehydrogenase 5⬘-FID 3⬘-FID 762 1496 2258 4
AdhrAdh-related Exon 2 Exon 3 678 63 741 4
Amd␣-methyl dopa-resistant Exon 1 Exon 2 912 465 1377 4
Ddcdopa decarboxylase Exon 3 Exon 3 912 0 912 4
dppdecapentaplegic Exon 1 Exon 2 1002 2295 3297 4
EnoEnolase Exon 2 Exon 3c 1050 69 1119 4
Gpdhglycerol-3-phosphate Exon 1 Exon 3 411 3544 3955 4 dehydrogenase
LamLamin Exon 1 Exon 2d 1500 90 1590 4
smosmoothened Exon 3 Exon 6 1284 229 1513 4
Urourate oxidase Exon 1 Exon 2 864 69 933 4
AnnXAnnexin X Exon 2 Intron 3 612 264 876 XL
Cyp1acyclophylin 1 Intron 1 Intron 1 0 634 634 XL
Gapdh2glyceraldehyde-3-phosphate Exon 1 Exon 1 768 0 768 XL
dehydrogenase 2
scuteascute Exon 1 3⬘-FID 684 407 1091 XL
sesBastress-sensitive B Exon 2 Exon 4 711 174 885 XL
sisAasisterless A 5⬘-FID 3⬘-FID 636 1292 1928 XL
swallowaswallow Exon 1 Exon 3 1026 144 1170 XL
Est-5Besterase-5B 5⬘-FID Exon 2 1569 186 1755 XR
Hsp83(Hsp82) heat-shock protein 83 Exon 1 Exon 1 789 0 789 XR
Sodsuperoxide dismutase Exon 1 Exon 2 318 399 717 XR
Names in parentheses represent the names used in previous studies. FID, flanking intergenic DNA.
aPolymorphism data are fromYiet al.(2003). bLength in base pairs (including alignment gaps). cExon 2 ofD. melanogaster.
dExon 3 ofD. melanogaster.
pseudoobscuraandD. affinisare 23.4⫾1.4% and 20.2⫾ proximate the true variance given the relatively low lev-els of linkage disequilibrium in D. miranda (Yi et al.
2.3%, for autosomal andX-linked genes, respectively),
so there is no evidence for an overall difference in 2003). This yielded an overall mean value of 0.47% for
X-linked loci and 0.51% for autosomal loci, suggesting mutation rate between autosomal andX-linked loci, as
seems usually to be the case in Drosophila (Bauerand that sexual selection may be inflating the value of Ne
forX-linked genes, as previously proposed by Yi et al.
Aquadro1997).
To increase the power of the comparison ofX-linked (2003). If theX-linked values are adjusted by a factor of4⁄
3, to take account of the fact that the mean diversity
and autosomal variation, we combined our data with
those reported byYiet al.(2003), increasing the number forX-linked genes is expected to be three-quarters of the autosomal value in the absence of sexual selection, the of sex-linked loci to 12. To correct for differences in
information among different loci, we weighted each difference in mean becomes 0.12%, with a lower bootstrap 95% confidence limit of⫺0.13%. This reflects the very locus by its estimated net variance of nucleotide diversity
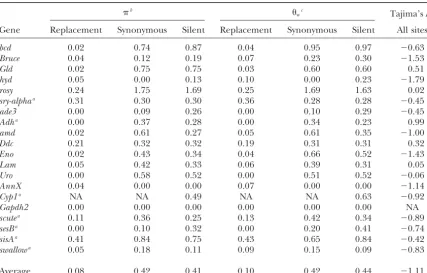
TABLE 2
Nucleotide diversity withinD. miranda(values expressed as percentages)
b
wc Tajima’sD: Gene Replacement Synonymous Silent Replacement Synonymous Silent All sites
bcd 0.02 0.74 0.87 0.04 0.95 0.97 ⫺0.63
Bruce 0.04 0.12 0.19 0.07 0.23 0.30 ⫺1.53
Gld 0.02 0.75 0.75 0.03 0.60 0.60 0.51
hyd 0.05 0.00 0.13 0.10 0.00 0.23 ⫺1.79
rosy 0.24 1.75 1.69 0.25 1.69 1.63 0.02
sry-alphaa 0.31 0.30 0.30 0.36 0.28 0.28 ⫺0.45
ade3 0.00 0.09 0.26 0.00 0.10 0.29 ⫺0.45
Adha 0.00 0.37 0.28 0.00 0.34 0.23 0.99
amd 0.02 0.61 0.27 0.05 0.61 0.35 ⫺1.00
Ddc 0.21 0.32 0.32 0.19 0.31 0.31 0.32
Eno 0.02 0.43 0.34 0.04 0.66 0.52 ⫺1.43
Lam 0.05 0.42 0.33 0.06 0.39 0.31 0.05
Uro 0.00 0.58 0.52 0.00 0.51 0.52 ⫺0.06
AnnX 0.04 0.00 0.00 0.07 0.00 0.00 ⫺1.14
Cyp1a NA NA 0.49 NA NA 0.63 ⫺0.92
Gapdh2 0.00 0.00 0.00 0.00 0.00 0.00 NA
scutea 0.11 0.36 0.25 0.13 0.42 0.34 ⫺0.89
sesBa 0.00 0.10 0.32 0.00 0.20 0.41 ⫺0.74
sisAa 0.41 0.84 0.75 0.43 0.65 0.84 ⫺0.42
swallowa 0.05 0.18 0.11 0.09 0.15 0.09 ⫺0.83
Average 0.08 0.42 0.41 0.10 0.42 0.44 ⫺1.11
NA, not available.
aSequence data are fromYiet al. (2003) after realignment with McAlign (KeightleyandJohnson2004). bPairwise nucleotide diversity (Nei1987).
cNucleotide site variability is based on the number of segregating sites (Watterson1975).
reduce this variability, we removedrunt(X-linked) androsy ited negativeD-values when silent and nonsynonymous sites were combined, although onlyhydwas individually (autosomal), which are outside the range of variability
observed for other loci, as well as loci that showed evi- significant. The most negatively skewed values corre-sponded tohydandBruce, with 5 of 5 and 4 of 5 variants dence for significant departures from neutrality (per,
swallow, andAnnX; see below andYiet al.2003). This being singletons, respectively. The mean values ofand wfor silent variants are very close to each other (mean
increases the difference between the weighted means
for adjusted X -linked and autosomal values (0.65 and paired difference of ⫺0.038%, with standard error of 0.020%), with 7 of 18 comparisons giving positive values, 0.35%, respectively); the lower bootstrap 95%
confi-dence limit for the difference is 0.00% and the differ- so there is no significant evidence of an overall depar-ture of silent variants from neutral expectation, in agree-ence in observed adjusted mean has P ⬍ 0.05 on a
t-test (t⫽2.26, 16 d.f.). This suggests that sexual selec- ment with the conclusions of Yi et al.(2003). In con-trast, only 1 of 14 loci with replacement polymorphism tion may be acting to reduce autosomal variability inD.
miranda, in agreement with the conclusion of Yiet al. data have largerthanwfor nonsynonymous variants
(the mean difference is⫺0.023%, SE 0.005),P⫽0.001 (2003), but more data are clearly needed to resolve this
point. A possible problem with this conclusion is that on a sign test. This suggests the action of purifying selection on replacement polymorphisms (see below). there is evidence for weak selection on synonymous
variants (see below). However, the theoretical results of Although the pooled frequency distribution of nonsyn-onymous variants was more skewed toward
low-fre-McVean and Charlesworth (1999) show that such
selection reduces the ratio of X-linked to autosomal quency variants than the distribution of synonymous variants, the distributions did not differ significantly on variability, if the deleterious effects of mutations are
recessive or additive, as usually seems to be the case. a Mann-WhitneyU-test (data not shown).
Another way of testing whether the patterns of nucleo-The frequency spectrum of variants at each locus was
studied using Tajima’s D statistic (Tajima 1989), for tide variation and divergence are compatible with the standard neutral model is to apply the HKA test, which which a significantly negative value indicates that there
are more low-frequency variants than expected under asks if polymorphism levels for each locus are propor-tional to divergence between species (Hudson et al.
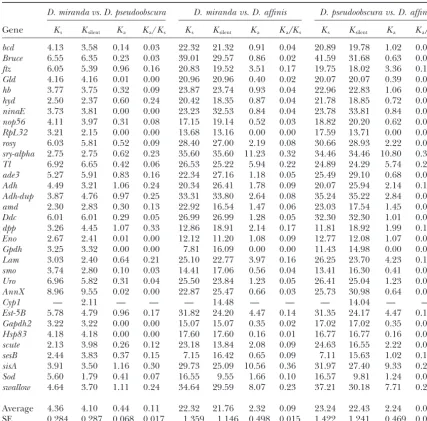
exhib-TABLE 3
Synonymous (Ks), silent (Ksilent), and nonsynonymous (Ka) divergence betweenD. miranda, D. pseudoobscura,
andD. affinis, expressed as percentages
D. miranda vs. D. pseudoobscura D. miranda vs. D. affinis D. pseudoobscura vs. D. affinis
Gene Ks Ksilent Ka Ka/Ks Ks Ksilent Ka Ka/Ks Ks Ksilent Ka Ka/Ks
bcd 4.13 3.58 0.14 0.03 22.32 21.32 0.91 0.04 20.89 19.78 1.02 0.05
Bruce 6.55 6.35 0.23 0.03 39.01 29.57 0.86 0.02 41.59 31.68 0.63 0.02
ftz 6.05 5.39 0.96 0.16 20.83 19.52 3.51 0.17 19.75 18.02 3.36 0.17
Gld 4.16 4.16 0.01 0.00 20.96 20.96 0.40 0.02 20.07 20.07 0.39 0.02
hb 3.77 3.75 0.32 0.09 23.87 23.74 0.93 0.04 22.96 22.83 1.06 0.05
hyd 2.50 2.37 0.60 0.24 20.42 18.35 0.87 0.04 21.78 18.85 0.72 0.03
ninaE 3.73 3.81 0.00 0.00 23.23 32.53 0.84 0.04 23.78 33.81 0.84 0.04
nop56 4.11 3.97 0.31 0.08 17.15 19.14 0.52 0.03 18.82 20.20 0.62 0.03
RpL32 3.21 2.15 0.00 0.00 13.68 13.16 0.00 0.00 17.59 13.71 0.00 0.00
rosy 6.03 5.81 0.52 0.09 28.40 27.00 2.19 0.08 30.66 28.93 2.22 0.07
sry-alpha 2.75 2.75 0.62 0.23 35.60 35.60 11.23 0.32 34.46 34.46 10.80 0.31
Tl 6.92 6.65 0.42 0.06 26.53 25.22 5.94 0.22 24.89 24.29 5.74 0.23
ade3 5.27 5.91 0.83 0.16 22.34 27.16 1.18 0.05 25.49 29.10 0.68 0.03
Adh 4.49 3.21 1.06 0.24 20.34 26.41 1.78 0.09 20.07 25.94 2.14 0.11
Adh-dup 3.87 4.76 0.97 0.25 33.31 33.80 2.64 0.08 35.24 35.22 2.84 0.08
amd 2.30 2.83 0.30 0.13 22.92 16.54 1.47 0.06 23.03 17.54 1.45 0.06
Ddc 6.01 6.01 0.29 0.05 26.99 26.99 1.28 0.05 32.30 32.30 1.01 0.03
dpp 3.26 4.45 1.07 0.33 12.86 18.91 2.14 0.17 11.81 18.92 1.99 0.17
Eno 2.67 2.41 0.01 0.00 12.12 11.20 1.08 0.09 12.77 12.08 1.07 0.08
Gpdh 3.25 3.32 0.00 0.00 7.81 16.09 0.00 0.00 11.43 14.98 0.00 0.00
Lam 3.03 2.40 0.64 0.21 25.10 22.77 3.97 0.16 26.25 23.70 4.23 0.16
smo 3.74 2.80 0.10 0.03 14.41 17.06 0.56 0.04 13.41 16.30 0.41 0.03
Uro 6.96 5.82 0.31 0.04 25.50 23.84 1.23 0.05 26.41 25.04 1.23 0.05
AnnX 8.96 9.55 0.02 0.00 22.87 25.47 0.66 0.03 25.73 30.98 0.64 0.02
Cyp1 — 2.11 — — — 14.48 — — — 14.04 — —
Est-5B 5.78 4.79 0.96 0.17 31.82 24.20 4.47 0.14 31.35 24.17 4.47 0.14
Gapdh2 3.22 3.22 0.00 0.00 15.07 15.07 0.35 0.02 17.02 17.02 0.35 0.02
Hsp83 4.18 4.18 0.00 0.00 17.60 17.60 0.16 0.01 16.77 16.77 0.16 0.01
scute 2.13 3.98 0.26 0.12 23.18 13.84 2.08 0.09 24.63 16.55 2.22 0.09
sesB 2.44 3.83 0.37 0.15 7.15 16.42 0.65 0.09 7.11 15.63 1.02 0.14
sisA 3.91 3.50 1.16 0.30 29.73 25.09 10.56 0.36 31.97 27.40 9.33 0.29
Sod 5.60 1.79 0.41 0.07 16.55 9.55 1.66 0.10 16.57 9.81 1.24 0.07
swallow 4.64 3.70 1.11 0.24 34.64 29.59 8.07 0.23 37.21 30.18 7.71 0.21
Average 4.36 4.10 0.44 0.11 22.32 21.76 2.32 0.09 23.24 22.43 2.24 0.09 SE 0.284 0.287 0.068 0.017 1.359 1.146 0.498 0.015 1.422 1.241 0.469 0.015
Silent (Ksilent), synonymous (Ks), and nonsynonymous (Ka) divergence was estimated by the Jukes-Cantor correction for multiple hits. The data shown in this table are not corrected for within-species diversity.
1987). To do this, we used a maximum-likelihood ver- significantly from the null hypothesis of neutrality, in agreement withBegunandWhitley(2002) andRiley
sion of this test (Wrightand Charlesworth2004),
available at www.yorku.ca/stephenw. The application of et al.(1992). No evidence for departure from neutrality atrosywas obtained from other tests, such as haplotype this program to our data on silent sites, usingD. affinis
for measuring divergence, showed that only three loci tests. After removing AnnX andswallow, we compared the log-likelihood obtained when the expected diversi-departed significantly from neutral expectation
(con-servatively adjusting the expected diversity values for ties for X-linked loci were set to three-quarters of the autosomal values with that for the case of equal expected
X-linked loci to three-quarters of those for autosomes):
AnnX,swallow, andsry-alpha(P⬍0.001, 0.003, and 0.02, values for X-linked loci and autosomes (strong sexual selection). The resulting 2 was 5.24, P ⫽ 0.023,
sup-respectively). All of them showed less variability than
expected from their divergence levels, suggesting possi- porting the above conclusion thatD. mirandais subject to sexual selection.
ble effects of selection. The result for sry-alpha is not
to synonymous or silent-site divergence (Ka/Ks) should sequences, we identified polymorphic replacement and
synonymous mutations within coding sequences of D.
be equal to one, but selective constraints on the protein
sequence cause the ratio be lower (Ka/Ks⬍1), because mirandaand apparent fixed differences betweenD. mi-randa and D. affinis (Table 4). We then applied the selection removes deleterious nonsynonymous mutations
(Kimura1983). To assess the levels of selective constraints McDonald-Kreitman test (McDonald and Kreitman
1991), which compares the ratios of polymorphism to on protein sequence in our sample, we estimated the
proportions of replacement (Ka), silent (Ksilent), and syn- divergence among different types of sites that are
inter-spersed along the same sequence. Under the neutral onymous substitutions (Ks) per site amongD. miranda,
D. pseudoobscura, andD. affinis(Table 3), using the Jukes- model, the ratio of silent to replacement variants should be the same for polymorphisms as for fixed differences. Cantor correction for multiple hits (JukesandCantor
1969). Most genes did not show significant values of this ratio
(except for Ddc and hyd). The existence of an excess On average, pairwise comparisons among the three
species under analysis show very similar Ka/Ks ratios. of polymorphisms relative to fixations for replacement
variants, compared with the ratio of synonymous poly-Interestingly, the mean Ka-, Ks-, and Ka/Ks-values
be-tween D. miranda and D. pseudoobscura are extremely morphisms to fixations, in the overall data set was evalu-ated by the Mantel-Haenszel statistic, z. This involves close to those for loci on the neo-Xchromosome ofD.
mirandaafter excluding two loci that appear to be under the sum over all the tables of the deviations of the observed numbers of replacement polymorphisms from positive selection (Bachtrog 2003b, Table 2).
How-ever, given the close relationship between D. miranda the expected numbers when the cell frequencies for a table are the products of the row and column frequen-and its sibling species D. pseudoobscura(Yiet al. 2003),
it is desirable to apply a correction for within-species cies, divided by its sampling standard deviation ( Snede-corandCochran1980). For the number of indepen-genetic variation when comparing them. The silent
pair-wise nucleotide diversity for D. pseudoobscura (silent ⫽ dent 2 ⫻ 2 tables used here, z should be close to a
standard normal variate. This was checked by compar-1.48%) was estimated by taking the mean of individual
locus values from previous studies (HamblinandAqua- ing the normal probability values to those from 10,000 resamplings of the 2⫻2 tables, keeping row and column
dro1999;KovacevicandSchaeffer2000;Machado
et al. 2002). The mean of this and the mean for D. numbers fixed; there was excellent agreement. Includ-ing all 18 relevant loci, z ⫽ 3.00, P ⬍ 0.001; if rosy mirandain the present analysis (silent⫽0.34%,
exclud-ing the unusually highly variablerosy locus) were sub- is removed (which contributes a large fraction of the polymorphisms), z ⫽ 2.73, P ⬍ 0.01. If singletons are tracted from the mean silent divergence between the
two species (Ksilent⫽4.10%), providing a slightly lower removed from the tables, the correspondingz-statistics
become 1.28 and 1.01, respectively, which are nonsig-estimate of net divergence (Ksilent⫽3.19%). An analysis
of published value for DNA sequence polymorphism nificant. This suggests strongly that the low-frequency replacement polymorphisms are slightly deleterious. We in D. pseudoobscura suggests that the replacement-site
nucleotide diversity is fairly similar to that forD. miranda estimated the value of Nes (where Ne is the effective
population size, and sis the selection coefficient on a (V. Noe¨l, C. Bartolome´and B.Charlesworth,
un-published data), so that the adjusted mean value ofKa homozygous deleterious replacement variant), using a
modification of the method ofMasideet al.(2004) for isⵑ0.36%. This yields a ratio of adjusted meanKato
mean Ksilentof 0.11, which is the same as the mean of estimating the intensity of selection on codon usage.
This involves using the frequency spectrum for
segregat-Ka/Ks. Given the much larger divergence fromD. affinis,
the lack of correction for within-species polymorphism ing mutations under selection with no dominance (Equation 9 ofMcVeanandCharlesworth1999) to will have only a small effect on the comparisons with
D. affinis. As shown in Table 3, all genes are subject to calculate the expected proportion of singletons in a sample, yielding a maximum-likelihood estimate ofNes
purifying selection (Ka/Ks⬍1).
However, it should be pointed out that there is some on the assumption of independence among sites with the same selection coefficient for each site. Pooling heterogeneity in selective constraints among loci:
sry-alpha,sisA, and swallow seem to exhibit unusually fast across loci, we obtained a value of 1.2, with 2-unit sup-port limits (0.2, 2.7). Variation among sites in the selec-rates of amino acid evolution, although there was no
evidence for positive selection even when these three tion coefficient is likely to cause this estimate to be downwardly biased (see below).
loci were pooled (see below). There is a slightly but not
significantly higher meanKaforX-linked genes (3.0⫾ Codon usage bias: As described in materials and methods, we estimated codon usage bias from the fre-1.1%, compared with 1.9⫾0.50% for autosomes). This
is consistent with the higher rate of protein sequence quency of optimal codons (Fop) for each gene, i.e., the
fraction of optimal codons among all codons in the evolution observed for the right arm of the X in
com-parisons ofD. pseudobscuraand its relatives, relative to the gene (Ikemura1981;DuretandMouchiroud1999). The major codon preferences of D. pseudoobscura are same genes (which are autosomal) in comparisons ofD.
melanogasterand its relatives (Countermanet al.2004). very similar to those of D. melanogaster (Akashi and
TABLE 4
McDonald-Kreitman tests (coding regions)
Fixed Polymorphic
Gene Synonymous Nonsynonymous Synonymous Nonsynonymous P
bcd 46 7 7 1 1.00
Bruce 44 4 1 1 0.19
Gld 58 4 6 1 0.42
hyd 36 5 0 2 0.02*
rosy 124 33 29 13 0.22
sry-alpha 34 34 1 4 0.36
ade3 68 11 1 0 1.00
Adh 34 10 2 0 1.00
amd 42 10 4 1 1.00
Ddc 49 8 2 4 0.01**
Eno 28 8 5 1 1.00
Lam 74 42 4 2 1.00
Uro 41 8 3 0 1.00
AnnX 28 3 0 1 0.13
Gapdh2 26 2 0 0 —
scute 31 10 2 2 0.56
sesB 12 3 1 0 1.00
sisA 38 42 2 6 0.28
swallow 62 54 1 2 0.60
Pooled 875 298 71 41
Synonymous and Nonsynonymous are the number of synonymous and nonsynonymous changes, respectively.
D. affiniswas used as an outgroup.Pwas calculated using the two-tailed Fisher’s exact test, comparing numbers of synonymous vs. replacement changes in the fixed and polymorphic categories, respectively. *P⬍ 0.05, **Pⱕ0.01.
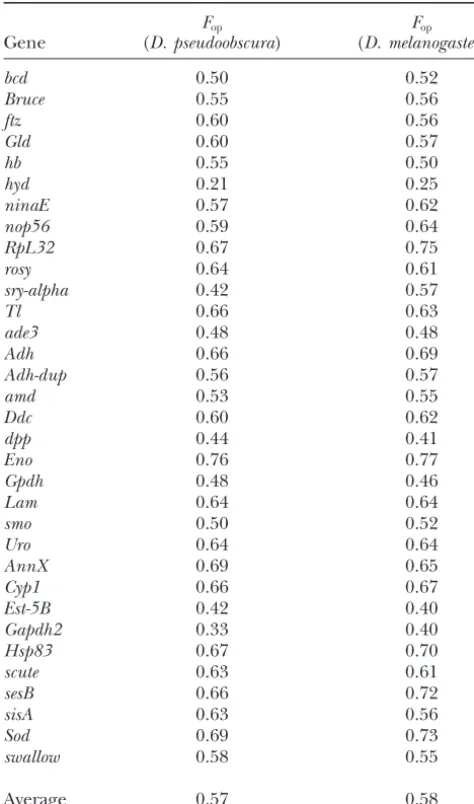
can be used to define optimal codons for D. miranda. To assess this, we classified synonymous changes as either polymorphic variants withinD. mirandaor fixed To check this, we compared the values ofFopusing the
tables of preferences from both species and the results differences betweenD. mirandaandD. pseudoobscura (Ta-ble 6). The ancestral state was inferred by parsimony did not differ significantly (Table 5), except for those
fromsry-alpha, whoseFop-values were 0.42 and 0.57 using using D. affinis as a distant outgroup (Akashi 1995),
and mutational changes were assigned to the branches theD. pseudoobscuraandD. melanogasterpreferences,
re-spectively. Given thatD. mirandais much closer to D. of the phylogeny leading toD. miranda andD. pseudo-obscura. To avoid confounding effects of
polymor-pseudoobscura than to D. melanogaster, we used the D.
pseudoobscurapreferences in all the subsequent analyses. phism withinD. pseudoobscura, for which data are lack-ing in our study, we consider only fixed mutations as-The major codon preference model assumes that
se-lective forces on synonymous codons are weak (Bulmer signed to theD. mirandabranch. We found thatrpdwas
much higher for P → U mutations than for U → P
1991; Akashi 1995). Comparisons of sequence data
within and between species thus provide a means of changes (1.9 vs. 0.5, P⬍ 0.01, one-tailed contingency test), consistent with the action of weak selection against detecting these forces, which otherwise would be
diffi-cult to detect (Akashi 1995). Given that selection is P → U changes. In addition, the numbers of P → U
and U → P fixations do not differ significantly from expected to be less efficient at removing slightly
deleteri-ous mutations than preventing their fixation (Kimura equality (19 and 12, respectively), consistent with codon usage being in equilibrium in these two species (Bulmer
1983;Akashi1995), one way of detecting selection at
synonymous sites is to compare the ratio of polymor- 1991). If there had been a genome-wide relaxation of selection on codon bias (consistent with a recent decline phism to divergence (rpd) between the two different
classes of synonymous changes that change codon usage in the effective population size, Ne), as seems to have
happened inD. melanogaster(Akashi1996), we would between preferred (P) and unpreferred (U) codons. If
there is no selection, therpd ratio for P → U changes observe an excess ofP→Ufixations.
Conversely, a recent population expansion would pro-should be equal to that forU→Pchanges. In contrast,
higher ratios of polymorphism to divergence forP → duce an excess number of singletons compared to neu-tral expectation. To check for this, we performed aFu
U than for U → P changes are expected if there
TABLE 5 phism to divergence relative to the ratio for synonymous mutations, contributed by low-frequency variants
(Ta-Estimates of codon usage bias (Fop) inD. miranda
bles 2 and 4). This contrasts with the results of the survey byWeinreichandRand(2000) of data on 39 nuclear
Fop Fop
Gene (D. pseudoobscura) (D. melanogaster) genes from various Drosophila species, which showed little evidence for purifying selection, although
selec-bcd 0.50 0.52
tion against low-frequency nonsynonymous variants has
Bruce 0.55 0.56
been inferred forD. melanogasteron somewhat different
ftz 0.60 0.56
grounds (Fayet al.2002). A high frequency of adaptive
Gld 0.60 0.57
hb 0.55 0.50 amino acid substitutions among nonsynonymous fixed
hyd 0.21 0.25 differences has been suggested by recent applications
ninaE 0.57 0.62 bySmithandEyre-Walker(2002) andFayet al.(2002)
nop56 0.59 0.64 of modifications of the McDonald-Kreitman test to
com-RpL32 0.67 0.75
parisons betweenD. simulansandD. yakubaand between
rosy 0.64 0.61
D. simulansandD. melanogaster, respectively. A
likelihood-sry-alpha 0.42 0.57
based extension of this approach byBierneandEyre
-Tl 0.66 0.63
ade3 0.48 0.48 Walker (2004) estimated that ⵑ20% of amino acid
Adh 0.66 0.69 substitutions between D. simulans and D. yakuba are
Adh-dup 0.56 0.57 driven by positive selection.
amd 0.53 0.55
In contrast, application of the method ofSmithand
Ddc 0.60 0.62
Eyre-Walker (2002) to the seven loci in our data set
dpp 0.44 0.41
with more than five polymorphisms in their coding
se-Eno 0.76 0.77
quence yields an estimate of⫺0.32 for this proportion,
Gpdh 0.48 0.46
Lam 0.64 0.64 with an upper 95% bootstrap confidence limit of 0.07.
smo 0.50 0.52 For this small set of genes, there is therefore no strong
Uro 0.64 0.64 evidence for anything other than purifying selection
AnnX 0.69 0.65
on amino acid substitutions. The results ofBachtrog
Cyp1 0.66 0.67
(2003a,b) andBachtrogandCharlesworth(2002)
Est-5B 0.42 0.40
suggest that 2 of 10 neo-X-linked genes of D. miranda
Gapdh2 0.33 0.40
have been subject to positive selection for amino acid
Hsp83 0.67 0.70
scute 0.63 0.61 replacements since the divergence of the neo-Xand
neo-sesB 0.66 0.72 Ychromosomes. It is not clear whether this difference
sisA 0.63 0.56 between the neo-Xgenes and the genes surveyed here
Sod 0.69 0.73
is meaningful.
swallow 0.58 0.55
Maintenance of codon usage inD. mirandaby selec-tion:Our finding that codon usage inD. mirandaseems
Average 0.57 0.58
to be approximately in equilibrium ostensibly differs Fop-values forD. mirandawere calculated using the prefer- from the results for genes on the neo-sex chromosomes ences table ofD. pseudoobscuraandD. melanogaster.
ofD. miranda(Bachtrog2003b), which suggested that selection was not maintaining codon bias. However, it seems likely that the excess of fixations of unpreferred for both coding and noncoding sequences. This is in
agreement with the results ofYiet al.(2003), who found mutations on the neo-Xchromosome lineage observed by Bachtrog (2003b) is probably due to the use of no convincing evidence for a recent population
expan-sion inD. mirandafrom polymorphism data on a set of only one sequence per locus, which causes some poly-morphisms to be incorrectly classified as fixations. Given 12 autosomal,X, and neo-Xlinked genes, in contrast to
its close relativeD. pseudoobscura(Machadoet al.2002). that selection in favor of preferred codons generates an excess of P → U overU → P polymorphisms (Akashi
1995), inclusion of polymorphisms among fixations will
DISCUSSION
inflate the number of inferredP →Ufixations. To test this possibility, we reestimated the number of
Nature of selection on protein sequences in D.
mi-randa: Our analysis of polymorphism and divergence changes betweenD. mirandaandD. pseudoobscurausing a single, randomly chosen sequence from each gene. data on 20 autosomal andX-linked loci of D. miranda
suggests that there is a predominance of purifying selec- The number of substitutions to unpreferred codons was greatly overestimated when we employed a single tion on polymorphic amino acid replacement variants,
as indicated by an excess of low-frequency nonsynony- sequence, with 37 P → U and 14 U → P fixations (P ⬍ 0.005,2-test against 1:1 expectation). When we
mous polymorphisms over neutral expectation and a
TABLE 6
Synonymous changes (usingD. pseudoobscurapreferences table)
Fixed Polymorphic
Gene P-U U-P P-P U-U Total NS P-U U-P P-P U-U Total NS
bcd 3 0 0 0 3 0 3 0 0 2 5 1
Bruce 1 1 0 1 3 1 0 0 0 1 1 1
Gld 1 3 0 1 5 0 2 1 0 3 6 1
hyd 0 0 0 1 1 2 0 0 0 0 0 1
rosy 2 1 0 1 4 0 14 2 0 5 21 11
sry-alpha 0 0 0 2 2 0 0 0 0 1 1 4
ade3 2 0 0 1 3 5 1 0 0 0 1 0
Adh 2 0 0 1 3 2 2 0 0 0 2 0
amd 1 1 0 0 2 0 3 0 0 0 3 1
Ddc 0 1 0 1 2 1 1 0 0 1 2 2
Eno 0 0 0 2 2 0 5 0 0 0 5 1
Lam 1 0 0 1 2 1 1 1 0 2 4 2
Uro 2 1 0 2 5 1 1 0 0 0 1 0
AnnX 2 2 0 0 4 0 0 0 0 0 0 1
Gapdh2 1 0 0 0 1 0 0 0 0 0 0 0
scute 0 0 0 0 0 0 2 0 0 0 2 2
sesB 0 2 0 0 2 0 0 1 0 0 1 0
sisA 0 0 0 1 1 4 1 1 0 1 3 6
swallow 1 0 0 2 3 3 1 0 0 0 1 2
Total 19 12 0 17 48 20 37 6 0 16 59 36
Bachtrog(2003b), we found no significant differences fer1997), so that GC-biased gene conversion (Galtier et al.2001; Birdsell 2002), or recent changes in the in the proportions of changes for either the neo-Xor
the neo-Ychromosomes using2-contingency tests. This intensity of mutational bias (Francino and Ochman
1999), could be confounded with the effects of selection strongly suggests that the use of a single allele inflates
the estimates of numbers of P → U fixations for the
highly polymorphic neo-Xchromosome. We also exam- TABLE 7
ined the pattern of ostensible fixations for the loci
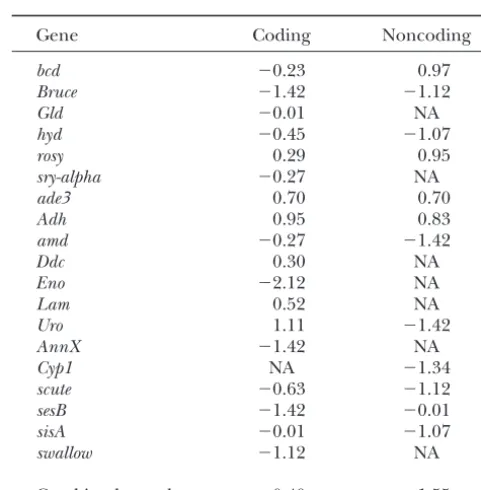
se-Fu and Li’sD-test statistics quenced inD. affinisfor which polymorphism data are
not available forD. miranda(Tables 1 and 2). We found
Gene Coding Noncoding
29P → U vs. 5 U → P “fixations” on the D. miranda
branch. This does not differ significantly from the value bcd ⫺0.23 0.97
Bruce ⫺1.42 ⫺1.12
for the set with polymorphism data, when analyzed by
Gld ⫺0.01 NA
using single sequences fromD. miranda.
hyd ⫺0.45 ⫺1.07 These results imply that codon usage in the
recombin-rosy 0.29 0.95
ing portion of the D. miranda genome is still being sry-alpha ⫺0.27 NA
maintained by selection, contrary to the conclusion of ade3 0.70 0.70
Bachtrog(2003b) for the neo-X.More polymorphism Adh 0.95 0.83
and divergence data for the neo-Xare clearly desirable amd ⫺0.27 ⫺1.42
Ddc 0.30 NA
to check this conclusion, and these are currently being
Eno ⫺2.12 NA
collected. Given the low level of polymorphism on the
Lam 0.52 NA
neo-Ychromosome, the bias in this case is negligible,
Uro 1.11 ⫺1.42
so that the results of Bachtrog (2003b) imply that
AnnX ⫺1.42 NA
P→Umutations are accumulating on the neo-Ychro- Cyp1 NA ⫺1.34
mosome, as would be expected from its exposure to scute ⫺0.63 ⫺1.12
Hill-Robertson effects due to its lack of recombination sesB ⫺1.42 ⫺0.01
sisA ⫺0.01 ⫺1.07 (CharlesworthandCharlesworth2000).
swallow ⫺1.12 NA
However, other factors could have similar effects to selection on the ratio of polymorphism to divergence
Combined sample ⫺0.40 ⫺1.55
for synonymous mutations. Almost all preferred codons
NA, not available.
Schaef-TABLE 8
Polymorphic and fixed synonymous changes at coding
and noncoding sites inD. miranda
Fisher’s Sites GC→AT AT→GC exact test
Coding
Fixed 30 12 P⫽0.012
Polymorphic 48 4
rpd 1.60 0.33 rc⫽4.80
Noncoding
Fixed 16 22 P⫽0.285
Polymorphic 13 9
rpd 0.81 0.41 rnc⫽1.99
Figure 1.—Correlation between GC content at the third codon position and GC content in introns. Solid line, includ-ing all loci; dashed line, discardinclud-ing the outlier; arrow, indicates
on codon usage. Given that the former are nonselective the outlier. mechanisms, they should have similar effects on coding
and neighboring noncoding regions, so that the analysis
of nucleotide substitutions in these two fractions of the substitution patterns between coding sequences and in-trons, we can conclude that biased gene conversion genome should reveal which forces are involved.
We compared rpd(GC → AT) to rpd(AT → GC) in toward GC (BGCGC) and/or changes in mutational bias
are not the major forces driving codon usage evolution. coding (rc)vs. noncoding DNA (rnc) and found thatrc
was much greater than rnc (Table 8). This is due to a This does not, of course, completely exclude a role for
these forces. BGCGCis expected to generate a correlation
substantial excess of GC→AT polymorphisms at
synony-mous sites compared with noncoding sites (P ⬍ 0.01, between the base compositions of adjacent coding and noncoding sequences (Galtier et al. 2001; Marais
2-contingency test with Yates’ correction). However,
there is also a significant excess of GC→AT fixations 2003). For the genes in Table 1, we found a nonsignifi-cant correlation between the GC content of introns among the coding sequences (P ⬍ 0.01), apparently
conflicting with the above inference that base composi- (GCi) and the GC content at the third codon position
(GC3) of the genes in which they reside (Kendall’s ⫽
tion is at equilibrium. No such difference is found for
the noncoding sequences, and the difference between 0.11,P⫽0.43, two-tailed test; Figure 1). The pattern is the same when we use the correspondingD.
pseudoob-the two types of sequence is significant (P⬍0.01). The
probable reason for the excess of GC → AT fixations scurasequences. This is consistent with the weak correla-tions reported for D. melanogaster (Kliman and Hey
at synonymous sites is that the expectation of equality
of GC → AT and AT → GC fixations holds only for 1994;MaraisandPiganeau2002), which could not be detected in the small sample of genes used here. those mutations that arose in the D. miranda lineage
from sites that were fixed at the time of divergence from Estimates of the intensity of selection on codon usage:
To estimate the selection intensities at synonymous sites, the common ancestor withD. pseudoobscura. Given the
low divergence between the two species compared with we applied a maximum-likelihood method based on the
frequencies of P → U mutations among P → U and
the within-species diversity in D. pseudoobscura(see
re-sults), it is likely that a significant fraction of fixations U → P polymorphic sites (Maside et al. 2004). The scaled selection parameter 4Nesis denoted by␥, where
involve polymorphisms that were present in the
com-mon ancestor. It is easily shown that the ratio of the 2sis the selection coefficient against a homozygous U
variant (diploidy, no dominance, and equal selection probabilities of fixation of deleterious and favorable
variants is higher for polymorphic variants than for new coefficients at each site are assumed). For the pooled data set, the maximum likelihood of␥ was 2.5 (2-unit mutations, since a relatively frequent deleterious variant
has already avoided loss from the population. We would support limits 1.5–3.8); this value did not differ signifi-cantly from those obtained after dividing the data set therefore expect an enrichment of deleterious variants
among fixed differences that have arisen from ancestral into two groups of genes with low bias (Fop⬍0.60,␥ ⫽
2.6) and high bias (Fop ⬎ 0.63, ␥ ⫽ 2.2). This lack of
polymorphisms; this hypothesis can be tested by
de-termining the status of variants withinD. pseudoobscura, an apparent difference between classes may reflect the limited range ofFop-values in our sample of genes: the
by comparison with D. mirandaandD. affinis, to see if
there is evidence that they are often ancestral (V.Noe¨l, averageFop-values for the low- and high-bias groups were
0.50⫾ 0.024 and 0.66⫾0.009, respectively. C. Bartolome´ and B. Charlesworth, unpublished
data). With␥ ⫽2.5, we have anNes-value of 0.63 (withⵑ95%
TABLE 9 tion of very weak natural selection on synonymous
changes, given thatNeforD. mirandais of the order of Effects of variance in␥on estimates of mean␥(␥)
1 million (Yiet al.2003). This value ofNesis lower than
previous estimates obtained by different methods in ␣  ␥ ␥ ␥approx ␥normal
other species of Drosophila (Akashi and Schaeffer
∞ 0 2.50 0.00 2.50 2.50
1997), but is very similar to that for D. americana,
ob-20 0.13 2.57 0.56 2.59 2.60
tained by the present method (Maside et al. 2004). 10 0.26 2.64 0.84 2.72 2.65
These differences probably reflect the sensitivity to de- 5 0.56 2.82 1.26 3.02 2.87
mographic perturbations of allele frequency spectra of 2 1.85 3.71 2.62 4.19 —
1 4.79 4.79 4.79 5.55 —
the methods used previously (Masideet al.2004).
0.5 23.00 11.30 16.30 8.38 —
We also estimated the selection intensities from the
proportion ofUsingletons amongP→UandU→P) The first four columns relate to a gamma distribution of polymorphisms (Maside et al. 2004); the results were the scaled selection intensity␥; the fifth gives the estimate of
mean␥obtained for a general distribution from the
second-not significantly different from the above estimate (␥ ⫽
order Taylor series approximation, with the same variance as
1.2, upper 2-unit support limit 3.1). This agrees with
the gamma distribution; the sixth is the estimate for a normal
the absence of evidence for a recent population
expan-distribution with this variance. See text for further details.
sion inD. miranda, described above.
Effects of BGC:The absence of evidence for BGCGC
in our data on noncoding sequences may simply reflect The larger predicted value of mean GC3 compared
with the observed value thus suggests that BGCGCmay
the relatively small amount of polymorphism data.
Fol-lowing the approach ofMasideet al. (2004), we have have some effect on the base composition of both cod-ing and noncodcod-ing sequences, since it causes an under-indirect evidence for effects of BGCGC. We can compare
the expected value of GC3with that expected from the estimation of the mutational bias parameter (Maside et al.2004). A GC3content of 0.69 with a␥⬘-value of 2.0
estimated mutational bias in favor of GC→ AT
muta-tions and the intensity of selection on preferred codons. implies a meank-value of 3.3; this in turn suggests a ␥⬘-value of 0.75 for noncoding sequences, to account for The former can be estimated from the GC content of
introns (GCi); assuming equilibrium under neutrality, the observed value of GCi. This is well within the 2-unit
support limits for the maximum-likelihood estimate of the mutational biaskfor a gene (the ratio of the
muta-tion rates for GC→AT and AT→GC mutations) can ␥⬘from the noncoding polymorphism data in Table 8
(ⵑ⫺1.0–1.8); further data on polymorphisms at
non-be estimated from the standard formula for statistical
equilibrium under mutation pressure alone (Bulmer coding sites are needed to examine this question fur-ther. This value ofk requires a␥ of 1.48 to yield the 1991) as (1/GCi)⫺1. Taking the mean of 1/GCiover
all 27 D. miranda genes for which data are available, observed mean value ofFop(Table 5); this falls within
the 2-unit support limits for the maximum-likelihood the estimated mean value ofkis 1.77, with a standard
deviation of 0.49. Assuming as a rough approximation estimate of ␥. This analysis does not, of course, distin-guish between the effects of selection and BGC on non-that the selection intensity for GC3(␥⬘) is 80% of that
estimated for preferred codon usage (i.e., ␥⬘ ⫽ 2.0; coding sequences, but comparative studies of base com-position across the genome tend to support a role for
Masideet al. 2004), the predicted value of GC3 from
the equation for equilibrium under selection, drift, and BGC (Marais2003).
Effects of variation in the selection parameter: An-mutation (Bulmer1991) is 0.81, much larger than the
observed value of 0.69. other question is the extent to which estimates of␥may
be biased by variation in␥-values among different sites. This value might, in fact, be somewhat
underesti-mated if there is variance inkamong genes, as indicated This is relatively hard to examine in the context of maximum likelihood without using simulations, but is by the substantial variance in GCi. A second-order
Tay-lor series correction for the effect of variance inkon simple to model for the method of moments estimator obtained by equating the theoretical and observed the equilibrium value of GC3 (p) yields the following
prediction for mean GC3, values of the proportion of P → U polymorphisms
among P → U and U → P polymorphisms. Unless
the existence of variation in␥ among sites has a large
p⬇ p(k)⎧⎨
⎩1⫹
Vk
(k⫹exp␥⬘)2 ⎫ ⎬
⎭ (1a) effect on the sampling distribution, this should yield
some insight into the effects of variation in ␥, since
p(k)⫽ exp␥⬘/(k⫹exp␥⬘), (1b) the method of moments estimator and the
maximum-likelihood estimator must converge asymptotically. Table 9 shows examples of three different methods where overbars indicate mean values, andVkis the
vari-ance ink. Substituting the estimated standard deviation of calculating the effect of a distribution of ␥-values on estimates of mean␥. Each codon is assumed to be ofkinto this expression increases the predicted mean
The left-hand part of the table shows the results of from the polymorphism data and a high mutational bias are required to explain all features of the data. Moderate assuming a gamma distribution;i.e., the probability
den-sity of a given value of x is proportional to ⫺␣x␣⫺1 to high variability in ␥ requires higher mean␥-values
than if variability is absent, and high variability is difficult exp(⫺x/). The shape parameter,␣, was assigned
arbi-trarily (first column), and the expected proportion of to reconcile with the overall level of codon usage bias. A similar analysis was also carried out for data onD. P → U polymorphisms was calculated by numerically
integrating the expression given by Equation 1 of americana, previously analyzed byMaside et al. (2004) on the assumption of no variation in␥. Their data set
Masideet al.(2004) over a gamma distribution with a
given value of theparameter (note that the sign of␥ was reduced to five alleles per gene for this purpose. Very similar results to the above were obtained; with in the expression that follows their Equation 1 should
be reversed). The value of  that equalizes observed a gamma distribution, the estimated value of mean ␥ increases from 2.58 to 10.3 as␣changes from 20 to 0.5. and expected proportions of P → U polymorphisms
for the assigned␣-value was then determined iteratively However, these mostly predict too high a mean Fop,
especially for the set of low codon usage bias genes, as (second column). The corresponding means and
stan-dard deviations were calculated from the stanstan-dard for- was found for the case of no variation in␥ byMaside et al. (2004). Using their estimate of k ⫽ 3.6 for low-mulas for a gamma distribution (third and fourth
col-umns). bias genes, together with the lower 95% confidence
interval for the proportion of P → U polymorphisms The corresponding mean values from the
second-order Taylor series approximation for the expected pro- for low-bias genes, a gamma distribution with␣-values of 5, 2, and 1 yields estimates of mean ␥of 1.62, 1.92, portion of P → U polymorphisms are shown in Table
9, column 5, and the value for a normal distribution and 2.12 and mean Fop-values of 0.59, 0.65, and 0.70,
respectively, compared with an observed mean Fop of
with the same variance as the gamma distribution is
shown in column 6, for that part of the parameter space 0.59. Again, it seems that a relatively low variance in␥ is most compatible with the data.
where a normal distribution of␥produces only a
negligi-ble fraction of negative values of␥. This work was funded by a grant from the Biotechnology and Biolog-For the gamma distribution, it is evident that variation ical Sciences Research Council UK to B.C., and a National Science Foundation doctoral dissertation improvement grant to SY. B.C. is
in␥ causes the mean value of␥ to be underestimated
supported by the Royal Society. We thank Peter Keightley and Laurent
if the variance is ignored, as was done above (where␥
Duret for providing their computer programs, and two anonymous
was estimated as 2.5 by both maximum likelihood and
reviewers for their constructive comments on the manuscript.
method of moments). The underestimation is very large
for ␣-values ⬍1.0, but these generate coefficients of
variation in␥ that exceed 1 and hence represent very
LITERATURE CITED
high levels of variability. The same result is seen for the
Akashi, H., 1995 Inferring weak selection from patterns of
polymor-approximation, which agrees quite well for relatively small
phism and divergence at “silent” sites in Drosophila DNA.
Genet-variances, but increasingly underestimates mean ␥ as ␣ ics139:1067–1076.
Akashi, H., 1996 Molecular evolution betweenDrosophila
melanogas-decreases. In the regions where they are valid, the normal
terandD. simulans: reduced codon bias, faster rates of amino
distribution values agree well with the other two.
acid substitution, and larger proteins inD. melanogaster.Genetics
However, even if we assume that the mutational bias 144:1297–1307.
Akashi, H., andS. W. Schaeffer, 1997 Natural selection and the
is as high as 3.3, the predicted meanFop-values,
calcu-frequency distributions of “silent” DNA polymorphism in
Dro-lated by integrating Equation 1b over the gamma
distri-sophila. Genetics146:295–307.
bution, are all⬎80%, far higher than what is observed. Ashburner, M., 1989 Drosophila: A Laboratory Handbook. Cold Spring
Harbor Laboratory Press, Cold Spring Harbor, NY.
This suggests that the estimates of mean ␥ from the
Bachtrog, D., 2003a Adaptation shapes patterns of genome
evolu-polymorphism data are too high. Using the binomial
tion on sexual and asexual chromosomes in Drosophila. Nat.
distribution, the lower 95% confidence interval on the Genet.34:215–219.
Bachtrog, D., 2003b Protein evolution and codon usage bias on
proportion of P → U polymorphisms is 0.757.
Exam-the neo-sex chromosomes ofDrosophila miranda.Genetics165:
ination of the variance of the distribution of the
propor-1221–1232.
tion ofP→Upolymorphisms generated with variation Bachtrog, D., andB. Charlesworth, 2002 Reduced adaptation
of a non-recombining neo-Ychromosome. Nature416:323–326.
in␥shows only a very small deviation from the binomial
Bauer, V. L., and C. F. Aquadro, 1997 Rates of DNA sequence
value, so this is likely to be a good approximation. Use
evolution are not sex-biased in Drosophila melanogaster and D.
of 0.757 instead of the observed value in the estimation simulans.Mol. Biol. Evol.14:1252–1257.
Begun, D. J., andP. Whitley, 2002 Molecular population genetics
equations yields lower predicted values of Fop, much
ofXdhand the evolution of base composition in Drosophila.
closer to the observed. For example, for a gamma
distri-Genetics162:1725–1735.
bution with␣-values of 5, 2, and 1, we obtain estimates Bierne, N., andA. Eyre-Walker, 2004 The genomic rate of adaptive
amino acid substitution in Drosophila. Mol. Biol. Evol.21:1350–
of 1.6, 1.9, and 2.1 for mean ␥, with predicted mean
1360. Fop-values of 0.61, 0.66, and 0.73, respectively, compared
Birdsell, J. A., 2002 Integrating genomics, bioinformatics, and
clas-with a value of 0.61 clas-without any variance. Thus, it would sical genetics to study the effects of recombination on genome
evolution. Mol. Biol. Evol.19:1181–1197.
Evol.52:275–280. mous codon usage. Genetics129:897–907.
Marais, G., andG. Piganeau, 2002 Hill-Robertson interference is Charlesworth, B., andD. Charlesworth, 2000 The
degenera-a minor determindegenera-ant of vdegenera-aridegenera-ations in codon bidegenera-as degenera-acrossDrosophila tion of Ychromosomes. Philos. Trans. R. Soc. Lond. B 355:
melanogasterandCaenorhabditis elegansgenomes. Mol. Biol. Evol. 1563–1572.
19:1399–1406. Counterman, B. A., D. Ortiz-BarrientosandM. A. Noor, 2004
Maside, X., A. W. LeeandB. Charlesworth, 2004 Selection on Using comparative genomic data to test for fast-Xevolution.
Evo-codon usage inDrosophila americana.Curr. Biol.14:150–154. lution58:656–660.
McDonald, J. H., andM. Kreitman, 1991 Adaptive protein evolu-Duret, L., andD. Mouchiroud, 1999 Expression pattern and,
sur-tion at theAdhlocus in Drosophila. Nature351:652–654. prisingly, gene length shape codon usage in Caenorhabditis,
Dro-McVean, G., and B. Charlesworth, 1999 A population genetic sophila, and Arabidopsis. Proc. Natl. Acad. Sci. USA96:4482–
model for the evolution of synonymnous codon usage: patterns 4487.
and predictions. Genet. Res.74:145–158. Fay, J. C., G. J. WyckoffandC. I. Wu, 2002 Testing the neutral
Nei, M.,1987 Molecular Evolutionary Genetics. Columbia University theory of molecular evolution with genomic data from
Drosoph-Press, New York. ila. Nature415:1024–1026.
Perez, J. A., A. Munte, J. Rozas, C. SegarraandM. Aguade, 2003 Francino, M. P., andH. Ochman, 1999 Isochores result from
muta-Nucleotide polymorphism in the RpII215 gene region of the tion not selection. Nature400:30–31. insular speciesDrosophila guanche: reduced efficacy of weak selec-Fu, Y. X., andW. H. Li, 1993 Statistical tests of neutrality of muta- tion on synonymous variation. Mol. Biol. Evol.20:1867–1875.
tions. Genetics133:693–709. Powell, J. R., 1997 Progress and Prospects in Evolutionary Biology: The Galtier, N., G. Piganeau, D. Mouchiroudand L. Duret, 2001 Drosophila Model. Oxford Universtiy Press, Oxford.
GC-content evolution in mammalian genomes: the biased gene Riley, M. A., S. R. KaplanandM. Veuille, 1992 Nucleotide poly-conversion hypothesis. Genetics159:907–911. morphism at the xanthine dehydrogenase locus in Drosophila Hamblin, M. T., andC. F. Aquadro, 1999 DNA sequence variation pseudoobscura.Mol. Biol. Evol.9:56–69.
and the recombinational landscape inDrosophila pseudoobscura: Rozas, J. R. R., 1999 DnaSP version 3: an integrated program for a study of the second chromosome. Genetics153:859–869. molecular population genetics and molecular evolution analysis. Hudson, R. R., M. KreitmanandM. Aguade, 1987 A test of neutral Bioinformatics15:174–175.
molecular evolution based on nucleotide data. Genetics 116: Smith, N. G., andA. Eyre-Walker, 2002 Adaptive protein evolution
153–159. in Drosophila. Nature415:1022–1024.
Ikemura, T., 1981 Correlation between the abundance ofEscherichia Snedecor, G. W., andW. G. Cochran, 1980 Statistical Methods. Iowa colitransfer RNAs and the occurrence of the respective codons State University Press, Ames, IA.
Steinemann, M., andS. Steinemann, 1998 Enigma ofY chromo-in its protechromo-in genes. J. Mol. Biol.146:1–21.
some degeneration: neo-Yand neo-Xchromosomes ofDrosophila Jukes, T. H., andC. R. Cantor, 1969 Evolution of protein
mole-mirandaa model for sex chromosome evolution. Genetica102/ cules, pp. 21–132 inMammalian Protein Metabolism, edited by H. N.
103:409–420. Munro. Academic Press, New York.
Tajima, F., 1989 Statistical method for testing the neutral mutation Keightley, P. D., andT. Johnson, 2004 MCALIGN: stochastic
align-hypothesis by DNA polymorphism. Genetics123:585–595. ment of noncoding DNA sequences based on an evolutionary
Takano-Shimizu, T., 1999 Local recombination and mutation ef-model of sequence evolution. Genome Res.14:442–450.
fects on molecular evolution in Drosophila. Genetics153:1285– Kimura, M., 1983 The Neutral Theory of Molecular Evolution.
Cam-1296. bridge University Press, Cambridge, UK.
Watterson, G. A.,1975 On the number of segregating sites in Kliman, R. M., andJ. Hey, 1994 The effects of mutation and natural
genetical models without recombination. Theor. Pop. Biol. 7: selection on codon bias in the genes of Drosophila. Genetics
256–276. 137:1049–1056.
Weinreich, D. M., andD. M. Rand, 2000 Contrasting patterns of Kovacevic, M., andS. W. Schaeffer, 2000 Molecular population
nonneutral evolution in proteins encoded in nuclear and mito-genetics ofX-linked genes inDrosophila pseudoobscura.Genetics
chondrial genomes. Genetics156:385–399. 156:155–172.
Wright, S. I., andB. Charlesworth, 2004 A maximum likelihood Machado, C. A., R. M. Kliman, J. A. MarkertandJ. Hey, 2002 In- ratio test of the standard neutral model. Genetics168:1071–1076. ferring the history of speciation from multilocus DNA sequence Yi, S., andB. Charlesworth, 2000 Contrasting patterns of molecu-data: the case ofDrosophila pseudoobscuraand close relatives. Mol. lar evolution of the genes on the new and old sex chromosomes Biol. Evol.19:472–488. ofDrosophila miranda.Mol. Biol. Evol.17:703–717.
MacKnight, R. H., 1939 The sex-determining mechanism ofDro- Yi, S., D. BachtrogandB. Charlesworth, 2003 A survey of chro-sophila miranda.Genetics24:180–201. mosomal and nucleotide sequence variation in Drosophila mi-Marais, G., 2003 Biased gene conversion: implications for genome randa.Genetics164:1369–1381.
and sex evolution. Trends Genet.19:330–338.