P R O C E E D I N G S
Open Access
An efficient analytic approach in
genome-wide identification of methylation
quantitative trait loci response to
fenofibrate treatment
Jiayi Wu Cox
1,4†, Devanshi Patel
2,4†, Jaeyoon Chung
2,4, Congcong Zhu
4, Samantha Lent
3, Virginia Fisher
3,
Achilleas Pitsillides
3, Lindsay Farrer
3,4*and Xiaoling Zhang
3,4*FromGenetic Analysis Workshop 20 San Diego, CA, USA. 4 - 8 March 2017
Abstract
Background:The study of DNA methylation quantitative trait loci (meQTLs) helps dissect regulatory mechanisms underlying genetic associations of human diseases. In this study, we conducted the first genome-wide examination of genetic drivers of methylation variation in response to a triglyceride-lowering treatment with fenofibrate
(response-meQTL) by using an efficient analytic approach.
Methods:Subjects (n= 429) from the GAW20 real data set with genotype and both pre- (visit 2) and post- (visit 4) fenofibrate treatment methylation measurements were included. Following the quality control steps of removing certain cytosine-phosphate-guanine (CpG) probes, the post−/premethylation changes (post/pre) were log
transformed and the association was performed on 208,449 CpG sites. An additive linear mixed-effects model was used to test the association between each CpG probe and single nucleotide polymorphisms (SNPs) around ±1 Mb region, with age, sex, smoke, batch effect, and principal components included as covariates. Bonferroni correction was applied to define the significance threshold (p< 5.6 × 10⁻¹⁰, given a total of 89,217,303 tests). Finally, we integrated our response-meQTL (re-meQTL) findings with the published genome-wide association study (GWAS) catalog of human diseases/traits.
Results:We identified 1087 SNPs ascisre-meQTLs associated with 610 CpG probes/sites located in 351 unique gene loci. Among these 1087cisre-meQTL SNPs, 229 were unique and 6 were co-localized at 8 unique disease/trait loci reported in the GWAS catalog (enrichmentp= 1.51 × 10⁻²³). Specifically, a lipid SNP, rs10903129, located in intron regions of geneTMEM57, was a re-meQTL (p= 3.12 × 10−36) associated with the CpG probe cg09222892, which is in the upstream region of the geneRHCE,indicating a new target gene for rs10903129. In addition, we found that SNP rs12710728 has a suggestive association with cg17097782 (p= 1.77 × 10⁻⁴), and that this SNP is in high linkage disequilibrium (LD) (R2> 0.8) with rs7443270, which was previously reported to be associated with fenofibrate response (p= 5.00 × 10⁻⁶).
(Continued on next page)
* Correspondence:[email protected];[email protected]
†Jiayi Wu Cox and Devanshi Patel contributed equally to this work.
3Department of Biostatistics, Boston University School of Public Health,
Boston University, 715 Albany St, Boston, MA 02118, USA Full list of author information is available at the end of the article
(Continued from previous page)
Conclusions:By using a novel analytic approach, we efficiently identified thousands ofcisre-meQTLs that provide a unique resource for further characterizing functional roles and gene targets of the SNPs that are most responsive to fenofibrate treatment. Our efficient analytic approach can be extended to large response quantitative trait locus studies with large sample sizes and multiple time points data.
Background
Genome-wide association studies (GWASs) have discov-ered hundreds of genetic loci associated with blood lipid levels [1]. Fenofibrate is a widely used medicine to treat high levels of cholesterol and triglycerides. Because treatment response is heterogeneous and heritable, sev-eral recent studies have identified genetic determinants of the observed heterogeneity in fenofibrate effects on lipid levels [2] and systemic inflammation involved in lipid metabolism [3,4]. However, the functional mechan-ism underlying these findings is largely unknown.
Epigenetic changes such as DNA methylation alteration contribute to phenotypic differences within and between individuals. The study of genetic effects on methylation quantitative trait loci (meQTLs) has emerged to help dis-sect regulatory mechanisms underlying these GWAS asso-ciations [5, 6]. However, the genetic components that determine the nature and strength of meQTL treatment response (re-meQTL) has not yet been studied. Using the GAW20 genotype and methylation data obtained before and after fenofibrate treatment of the same subjects, we conducted a re-meQTL analysis to identify common sin-gle nucleotide polymorphisms (SNPs) associated with methylation changes. This study is the first genome-wide examination of genetic drivers of methylation variation in treatment response, providing a unique resource for the community.
In addition to the re-meQTL analysis, we devel-oped an efficient analytic approach that significantly reduced the computational burden. The computation of genome-wide meQTL analysis is known to be in-tensive, especially for re-meQT study which requires more than one time-point data. In this work, we an-alyzed the pre- and post- treatment methylation data in one model. We believe our approach is more effi-cient and improves on the recently reported analysis of response-expression QTLs (re-eQTLs) in which different time-point data were first analyzed separ-ately, then the re-eQTLs were defined based on the effect size difference between post stimulus and basal levels [7].
Methods
Sample demography
The original samples are from the Genetics of Lipid Lowering Drugs and Diet Network (GOLDN) study (de-tails at https://dsgwebwp.wustl.edu/labs/province-lab/
goldn/), which aimed to characterize the genetic impact on response to interventions that affects triglycerides (TGs) [8]. The GOLDN study was done through a collaboration of 6 university-based medical centers and all participants were whites of European ancestry. Our study only used GAW20 real data, which contains participants in response to 4 visits in 3 weeks for an open-label clinical trial of feno-fibrate 160 mg. Data from visits 1 and 2 reflected the basal levels for participants before the fenofibrate treatment, whereas visits 3 and 4 were collected after fenofibrate treat-ment. For our re-meQTL analysis, we included 429 sub-jects (male = 221, female = 208) from 140 families with genotype and both pre- (visit 2) and posttreatment (visit 4) methylation data available.
Sample quality control
The methylation of the whole blood was measured by two different probes on the methylation chip, they were ad-justed using a beta-mixture quantile normalization (BMIQ) to fit the beta values of Type II design probes of Illumina 450 K into a statistical distribution characteristic of Type I probes [9]. To avoid bias, cytosine-phosphate-guanine (CpG) sites with SNP markers underneath that could be compromised by genotype [10], cross-reactive probes pos-sibly co-hybridizing to alternate genomic sequences [11], and polymorphic probes were removed according to the procedures outlined in Price et al. [10] and Chen et al. [11]. Only subjects with genotype and both post- and pre-treatment methylation data that have complete age, sex, center, and smoking information were in-cluded in the analysis (n= 429). The SNP genotypes were first filtered to include only cis SNPs to each CpG site, and then filtered to only include common variants with a minor allele frequency (MAF) > 0.05. The principal components (PCs) of the genotypes were computed using the GENESIS R package to fit PCs on a maximal unrelated subset and then project all samples to those PCs.
Association analysis of identifyingcisre-meQTLs
function from the coxme R package with pedigree struc-ture as random effects. For a given CpG probe, the model can be explained as below for a SNP within 1 Mb around the CpG:
Yi¼XiβþUiγiþɛi
in which,Yi is log10 (post/pre) values of cluster/family i; γi represent the estimates of random effects for
pedigree structure that is based on known pedigree relationships; β represent the estimates of fixed effects as the following:
The Bonferroni correction was applied to define statistical significance, resulting in p < 5.6 × 10⁻¹⁰, given a total of 89,217,303 tests. A total of 208,449 CpG sites were tested, so 89,217,303 is the summa-tion of all the SNPs that are within ±1 Mb around each CpG site. The average number of SNPs per CpG site is 428 (89,217,303/208,449). Regional plots of all significant SNPs associated with CpGs were generated using LocusZoom.
Enrichment analysis
Identified cisre-meQTL SNPs (p< 5.6 × 10⁻¹⁰) from the above association tests were compared with disease −/trait-associated SNPs in the National Human Genome Research Institute–European Bioinformatics Institute (NHGRI-EBI) GWAS Catalog (downloaded on 01/09/ 2017) [12] by rsID. A binomial test was conducted to test the enrichment of our unique cis re-meQTL SNPs in the GWAS catalog. Regional plots were generated for
cis re-meQTL SNPs that were also found to be associ-ated with lipid traits in the GWAS catalog using our re-meQTL results and published lipid GWAS results [1] for comparison using LocusZoom.
Results
CpG-SNP association
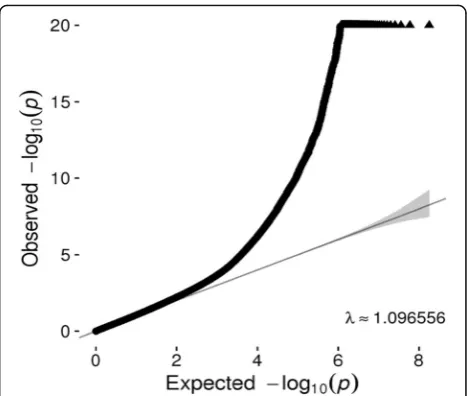
Quantile–quantile (Q-Q) plots (Fig. 1) for SNPs with a MAF > 5% did not show evidence of substantive overdis-persion/genomic inflation in our CpG-SNP association test (λ= 1.097), especially considering that SNPs within a ± 1 Mb of each CpG site were analyzed so that some of the correlated SNPs within that region were analyzed more than once. Because sample relatedness was con-trolled as a random effect in the linear mixed-effects model, a model that has proven to successfully control the genome-wide error rate [12], we optimized for con-trolling of the relatedness. Population structure also was controlled by adding PCs to the model.
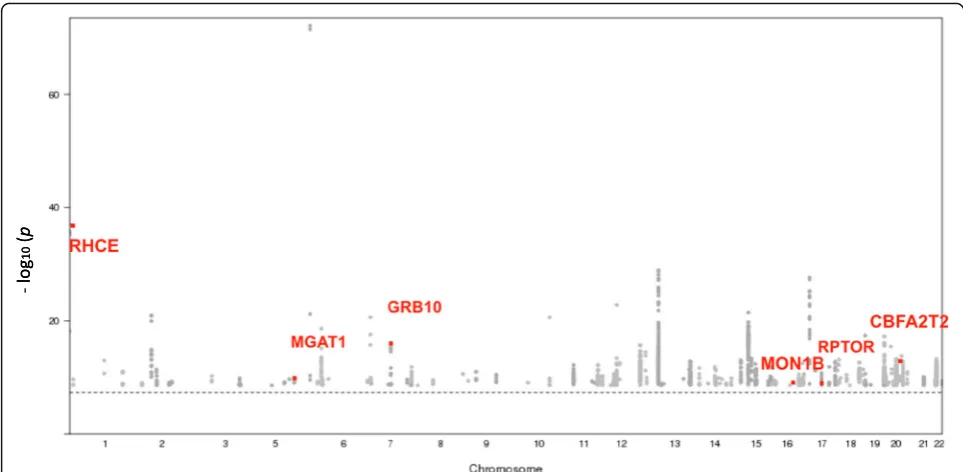
At a p value threshold of 5.6 × 10⁻¹⁰, 1087 SNPs located in 351 unique gene regions were identified ascis re-meQTLs associated with 610 CpG sites. Among these 1087cisre-meQTL SNPs, 229 are unique. Figure2 high-lights in red the cis re-meQTL SNPs with 6 loci found in the GWAS catalog. In addition, the most significant
cisre-meQTL, rs3733749, is associated with cg00514575 (p= 8.06 × 10−73) and is upstream ofMGAT1, a gene re-lated to TG/lipid accumulation [13], suggesting that a novel genetic variant might regulate a nearby lipid gene,
MGAT1, through DNA methylation.
GWAS catalog look-up and enrichment analysis
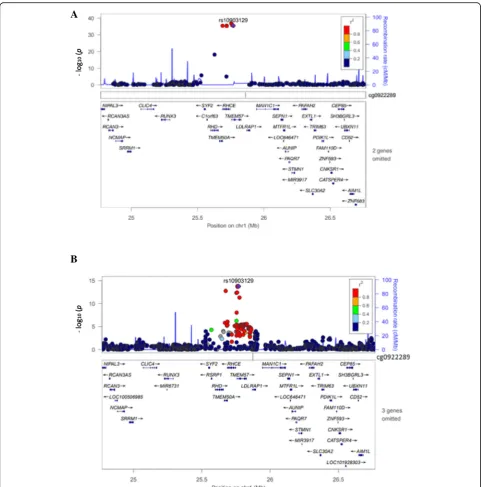
Among 1087 cis re-meQTLs, 6 unique SNPs were co-localized at 8 unique disease/trait loci reported in the NHGRI GWAS catalog (Table 1).As reported, a lipid SNP, rs10903129, was associated with total chol-esterol (p = 7.0 × 10⁻¹¹), and low-density lipoprotein (LDL) cholesterol (p = 2.0 × 10⁻¹⁹) [1]. As Table 1
shows, SNP rs10903129, located in an intron of gene
TMEM57, is a re-meQTL (p = 3.20 × 10−36) associated with cg09222892, which is upstream of the gene
RHCE, indicating a new function target gene for this reported lipid SNP rs10903129. Figure 3a shows the top re-meQTLrs10903129 results in this region, whereas Fig. 3b displays published LDL GWAS results of the same SNP in this region [1, 14]. Among these 1087 cis re-meQTL SNPs, 229 are unique and 6 are also found in the GWAS catalog (enrichmentp= 1.51 × 10⁻²³), indicating that the re-meQTLs identified in our study are highly relevant to human diseases/traits.
Co-localization of re-meQTL with GWAS results of fenofibrate effects
Among the GWAS results of fenofibrate effects reported by the GOLDN study, we are interested in whether the
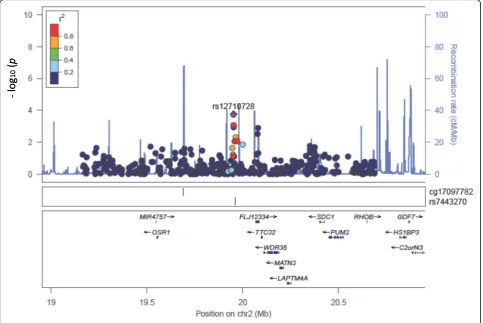
cisre-meQTLs from our study could serve as epigenetic evidence of how genetic loci associated with fenofibrate treatment can be explained by the variation of methyla-tion changes, and whether there is methylamethyla-tion change variation relevant to the genetic loci associated with fenofibrate effects on phenotype variation such as the changes of lipid or inflammatory biomarkers. As shown in Fig. 4, we found a SNP (rs12710728) that has a suggestive association with a CpG site (cg17097782,
p = 1.77 × 10⁻⁴), which is in high linkage disequilibrium
(LD) (R2> 0.8) with the GWAS-reported SNP rs7443270 for TG-lowering effects of fenofibrate (p= 5.00 × 10⁻⁶) [3].
Discussion
Epigenetic modifications such as DNA methylation can account for phenotypic differences within and between individuals. Specifically, meQTL studies can help dissect regulatory mechanisms underlying GWAS loci. In this short study, we identified thousands of cis re-meQTLs that link to the methylation differences in fenofibrate treatment responses, which could provide genetic and epigenetic determinants for TG level differences between pre- and post-treatment in individuals. As part of our
Table 1Topcisre-mQTLs that were matched to GWAS catalog
SNPs CpGsite CpGgene meQTLpvalue CpG and SNP difference (bp) Disease/trait Gene in GWAS SNPfunction rs10903129 cg09222892 RHCE 3.20E-36 −92,575 Cholesterol, total
cholesterol, erythrocyte sedimentation rate
TMEM57 Intron
rs2237457 cg03466198 GRB10 2.82E-16 −34,294 Schizophrenia
(treatment resistant) GRB10
Intron rs6120141 cg14296766 CBFA2T2 7.41E-14 −999,855 Smooth-surface caries BPIFA2 Intron rs12517906 cg00514575 MGAT1 4.80E-11 −127,730 Weight OR2Y1-MGAT1 Upstream rs1046896 cg12045294 RPTOR 1.43E-10 −239,794 Glycated hemoglobin
levels
FN3KRP 3′
Untranslated region rs11150078 cg07648639 MON1B;SYCE1L 3.21E-10 −208,317 Bipolar disorder
(body mass index interaction)
WWOX Intron
The most significant SNP from each gene is shown
Fig. 2The Manhattan plot ofcisre-mQTLs (p< 5.6 × 10⁻¹⁰) identified in this study with GWAS SNPs reported in the National Human Genome
results, we have helped to further validate disease-relevant genes such as MGAT1 [13] and RHCE [15]. In addition, we established a link between meQTL and reported fenofibrate GWAS SNPs via LD. As a result of the coverage of the 450 K Illumina chip, none of the re-ported fenofibrate GWAS SNPs were found in our genotype data after quality control. However, we did identify a suggestive significant meQTL, rs12710728,
which is in high LD with a reported fenofibrate treat-ment SNP (rs7443270). Our findings provide a unique drug-response–specific meQTL resource for further characterizing the potential functional roles of GWAS SNPs that show response differences to fenofibrate treatment. Finally, as the first response-specific meQTL study of its kind, it will also serve as an im-portant resource for future studies.
A
B
Because of the large number of SNPs and CpG sites involved, the computation for meQTL analysis can be quite intensive, especially when looking at both pre- and posttreatment data, or even bothcisandtransSNPs. We believe our novel analytic approach to the computation improves on the method used in the Quach et al. study [7], which focused on response-specific expression quan-titative trait locus (eQTL). We used the log difference of the pre- and posttreatment states, which can be more efficient than looking at the basal and posttreatment states separately, as done in the Quach et al. study [7]. In the future, we can further validate our ap-proach by optimizing our pipeline and conducting analysis on pre and post states separately, using an interaction model, as well as analyzing both cis and
trans re-meQTLs.
Conclusions
In this study, we aim to investigate cis-methylation loci that are responsible for lipid lowering drug fenofi-brate treatment. Thousands of cis re-meQTLs that link to the methylation differences were identified, which provide genetic and epigenetic determinants for
TG level differences between pre- and post- treatment among individuals. As the first response-specific meQTL study of this kind, these results will serve as an important resource for future studies of the poten-tial functional roles of GWAS SNPs that show re-sponse differences to fenofibrate treatment.
Acknowledgements
The authors are grateful to the participants of the GOLDN study for the time and specimens they contributed, and we thank the GAW20 for providing the data. The genetic and DNA methylation data used in this study were collected by the Genetics of Lipid Lowering Drugs and Diet Network (GOLDN) study. Details regarding study recruitment, design, ethic approval and consent to participate have been reported previously (seehttps:// www.gaworkshop.org/data-sets).
Funding
Publication of this article was supported by NIH R01 GM031575. This work was supported by the United States National Institutes of Health, National Institute on Aging (NIH-NIA) through the following grants: U01-AG032984, UF1-AG046198, and R01-AG048927.
Availability of data and materials
The data that support the findings of this study are available from the Genetic Analysis Workshop (GAW), but restrictions apply to the availability of these data, which were used under license for the current study. Qualified researchers may request these data directly from GAW.
About this supplement
This article has been published as part of BMC Proceedings Volume 12 Supplement 9, 2018: Genetic Analysis Workshop 20: envisioning the future of statistical genetics by exploring methods for epigenetic and
pharmacogenomic data. The full contents of the supplement are available online at https://bmcproc.biomedcentral.com/articles/supplements/volume-12-supplement-9.
Authors’contributions
JW performed the analyses, wrote the manuscript and interpreted the results. DP, JC and CZ assisted with the analysis. SL, VF, and AP planned and coordinated access to all of the genetic and methylation data from the GAW20. LF and XZ supervised the study. XZ designed the study, interpreted the results, and wrote the manuscript. All the authors contributed to the review of the manuscript. All authors read and approved the final manuscript.
Ethics approval and consent to participate
Not applicable.
Consent for publication
Not applicable.
Competing interests
The authors declare that they have no competing interests.
Publisher’s Note
Springer Nature remains neutral with regard to jurisdictional claims in published maps and institutional affiliations.
Author details
1Department of Genetics and Genomics, Boston University, 72 E Concord St,
Boston, MA 02118, USA.2Department of Bioinformatics, Boston University, 72 E Concord St, Boston, MA 02118, USA.3Department of Biostatistics, Boston
University School of Public Health, Boston University, 715 Albany St, Boston, MA 02118, USA.4Section of Biomedical Genetics, Boston University, 72 E
Concord St, Boston, MA 02118, USA.
Published: 17 September 2018
References
1. Teslovich T, Musunuru K, Smith AV, Edmondson AC, Stylianou IM, Koseki M, Pirruccello JP, Ripatti S, Chasman DI, Willer CJ, et al. Biological, clinical and population relevance of 95 loci for blood lipids. Nature. 2010;446(7307):707–13. 2. Irvin MR, Rotroff DM, Aslibekyan S, Zhi D, Hidalgo B, Motsinger-Reif A,
Marvel S, Srinivasasainagendra V, Claas SA, Buse JB, et al. A genome-wide study of lipid response to fenofibrate in Caucasians: a combined analysis of the GOLDN and ACCORD studies. Pharmacogenet Genomics. 2016;26(7):324–33.
3. Aslibekyan S, Kabagambe EK, Irvin MR, Straka RJ, Borecki IB, Tiwari HK, Tsai MY, Hopkins PN, Shen J, Lai CQ, et al. A genome-wide association study of inflammatory biomarker changes in response to fenofibrate treatment in the genetics of lipid lowering drug and diet network. Pharmacogenet Genomics. 2012;22(3):191–7.
4. Aslibekyan S, An P, Frazier-Wood A, Kabagambe E, Irvin M, Straka R, Tiwari HK, Tsai MY, Hopkins PN, Borecki IB, et al. Preliminary evidence of genetic determinants of adiponectin response to fenofibrate in the genetics of lipid lowering drugs and diet network. Nutr Metab Cardiovasc Dis. 2013;23(10):987–94.
5. Gibbs JR, van der Brug MP, Hernandez DG, Traynor BJ, Nalls MA, Lai SL, Arepalli S, Dillman A, Rafferty IP, Troncoso J, et al. Abundant quantitative trait loci exist for DNA methylation and gene expression in human brain. PLoS Genet. 2010;6(5):e1000952.
6. Chen L, Ge B, Casale FP, Vasquez L, Kwan T, Garrido-Martín D, Watt S, Yan Y, Kundu K, Ecker S, et al. Genetic drivers of epigenetic and transcriptional variation in human immune cells. Cell. 2016;167(5):1398–414.
7. Quach H, Rotival M, Pothlichet J, Loh YE, Dannemann M, Zidane N, Laval G, Patin E, Harmant C, Lopez M, et al. Genetic adaptation and Neandertal admixture shaped the immune system of human populations. Cell. 2016;167(3):643–56.
8. Irvin MR, Zhi D, Aslibekyan S, Claas SA, Absher DM, Ordovas JM, Tiwari HK, Watkins S, Arnett DK. Genomics of post-prandial lipidomic phenotypes in
the genetics of lipid lowering drugs and diet network (GOLDN) study. PLoS One. 2014;9(6):e99509.
9. Teschendorff AE, Marabita F, Lechner M, Bartlett T, Tegner J, Gomez-Cabrero D, Beck S. A beta-mixture quantile normalization method for correcting probe design bias in Illumina Infinium 450 k DNA methylation data. Bioinformatics. 2012;29(2):189–96.
10. Price ME, Cotton AM, Lam LL, Farré P, Emberly E, Brown CJ, Robinson WP, Kobor MS. Additional annotation enhances potential for biologically-relevant analysis of the Illumina Infinium HumanMethylation450 BeadChip array. Epigenetics Chromatin. 2013;6(1):4.
11. Chen Y-A, Lemire M, Choufani S, Butcher DT, Grafodatskaya D, Zanke BW, Gallinger S, Hudson TJ, Weksberg R. Discovery of cross-reactive probes and polymorphic CpGs in the Illumina Infinium HumanMethylation450 microarray. Epigenetics. 2013;8(2):203–9.
12. Eu-Ahsunthornwattana J, Miller EN, Fakiola M; Wellcome Trust Case Control consortium 2, Jeronimo SM, Blackwell JM, Cordell HJ: Comparison of methods to account for relatedness in genome-wide association studies with family-based data. PLoS Genet 2014, 10(7): e1004445.
13. Lee YJ, Ko EH, Kim JE, Kim E, Lee H, Choi H, et al. Nuclear receptor PPARγ -regulated monoacylglycerol O-acyltransferase 1 (MGAT1) expression is responsible for the lipid accumulation in diet-induced hepatic steatosis. Proc Natl Acad Sci U S A. 2012;109(34):13656–61.
14. Aulchenko YS, Ripatti S, Lindqvist I, Boomsma D, Heid IM, Pramstaller PP, Penninx BW, Janssens AC, Wilson JF, Spector T, et al. Loci influencing lipid levels and coronary heart disease risk in 16 European population cohorts. Nat Genet. 2009;41(1):47–55.