Copyright 8 1988 by the Genetics Society of America
Estimation of Mutation Rates Based on
the
Analysis of Polypeptide
Constituents
of
Cultured Human Lymphoblastoid Cells
E.
H.
Y.
Chu,*
M.
Boehnke,'
S. M. Hanash,* R. D. Kuick,* B. J.
Lamb,*
J.
V. Neel,*
W.
Niezgoda,*
S.
Pivirotto' and
G. Sundling"
Departments of *Human Genetics, fBiostatistics and #Pediatrics, University of Michigan, Ann Arbor, Michigan 481 09
Manuscript received September 10, 1987 Revised copy accepted February 26, 1988
ABSTRACT
A subclone of a human diploid lymphoblastoid cell line, TK-6, with consistently high cloning efficiency has been used to estimate the rates of somatic mutations on the basis of protein variation detected by two-dimensional polyacrylamide gel electrophoresis. A panel of 267 polypeptide spots per gel was screened, representing the products of approximately 263 unselected loci. The rate of human somatic mutation in vitro was estimated by measuring the proportion of protein variants among cell clones isolated at various times during continuous exponential growth of a TK-6 cell population. Three mutants of spontaneous origin were observed, giving an estimated spontaneous rate of 6 X IO-' electrophoretic mutations per allele per cell generation ( i e . , 1.2 X IO-' per locus per cell generation). Following treatment of cells with N-ethyl-N-nitrosourea, a total of 74 confirmed variants at 54 loci were identified among 1143 clones analyzed (approximately 601,000 allele tests). The induced variants include 65 electromorphs which exhibit altered isoelectric charge and/or apparent molecular weight and nine nullimorphs for each of which a gene product was not detected at its usual location on the gel. The induced frequency for these 65 structural gene mutants is 1.1
x per allele. An excess of structural gene mutations at ten known polymorphic loci and repeat mutations at these and other loci suggest nonrandomness of mutation in human somatic cells. Nullimorphs occurring at three heterozygous loci in TK-6 cells may be caused by genetic processes other than structural gene mutation.
M
OST of the previous studies aimed at deter- mining the frequency of somatic mutations in cultured mammalian cells have been based on a handful of selectable markers, mainly those confer- ring drug resistance (see reviews: HOWARD-FLANDERS198 1; C H U , LI and Fu 1984). In addition, SICILIANO and his co-workers (1983, 1986) isolated hundreds of random clones of Chinese hamster ovary (CHO) cells, with or without prior mutagen treatment, and screened for different classes of mutational events at 44 well-defined isozyme loci. In spite of these and other contributions, there still remain many uncer- tainties concerning both the process and rates of gene mutation in mammalian somatic cells.
In the present study, we estimate human somatic mutation rates at multiple, unselected loci by applying two-dimensional polyacrylamide gel electrophoresis (2-D PAGE) for mass screening of protein variants among clones of lymphoblastoid cells in culture. The objectives of our study are: (1) to test the feasibility of maintaining continuous exponential proliferation of these cells, (2) to assess the usefulness and limita- tions of 2-D PAGE for mutation studies using human cells in culture, and (3) to study the randomness of mutagenesis across a large number of loci. Some preliminary results of this study have been presented
Genetics 119: 693-703 UulV, 1988).
previously (CHU et al. 1986, CHU, BOEHNKE and HAN- ASH 1988; HANASH et al. 1987).
MATERIALS AND METHODS
Cell culture: A human diploid lymphoblastoid cell line, TK-6, was a gift from WILLIAM THILLY of the Massachusetts Institute of Technology. It was originally derived from the WI-L2 cell line, established at the Wistar Institute from a male donor with hereditary spherocytosis (a disorder which is irrelevant to the present study). The methods of cell culture and single cell cloning by limiting dilution in 96- well plates were similar to those described by THILLY et al. (1980). The growth medium used was RPMI 1640, supple- mented by 10% horse serum (both purchased from GIBCO, Grand Island, New York). No antibiotics were included in the medium during the experiments. The cell line and its clonal derivatives were stored in liquid nitrogen according to standard procedures and were always recoverable with full viability upon thawing and regrowth.
The TK-6 cell line is heterozygous at the thymidine kinase (TK) locus (SKOPEK et al. 1978). We showed that the line had a chromosome number of 46, including an X and a Y , in 81% of cells. Further single cell cloning allowed the selection of a subclone with as high as 70% cloning efficiency in liquid medium.
Maintenance of exponential cell proliferation in vitro: In order to achieve a continuous exponential proliferation
medium renewal were tested. The recording of daily cell counts allowed the estimation of the rate of cell growth.
When a culture is in exponential growth, the number of cells at time t, Nt, is given by
N, = Noear
where No is the initial population size at t = 0 and a is the growth rate. Taking the logarithm, we have In N, = In No
+
a.
t. This formula was used to obtain an estimate of the growth rate using simple linear regression.Calculation of generation time (T): ARMITAGE (1952, 1953) has presented a unified summary of previous results by other investigators, together with his own contributions, on the analysis of growing bacterial populations subject to mutation. For the present study, we also assume that no deaths take place in TK-6 cell populations. As in bacteria, this is a matter of experimental technique; deaths can generally be kept to a very low level by successive subcul- turing of a population before too high a density is reached. The TK-6 human lymphoblastoid cell line is immortal. Under the experimental conditions, no cell death was observed by dye exclusion test. A moderate cell death rate will have resulted in a small overestimate of the mutation rate. If we consider the population of TK-6 cells growing at a rate of a, we define generation time, T , to be the length of time required for the population size to double. The generation time is a function of the growth rate, a ,
and is estimated according to the formula
2N = N
-
eaT, which yieldsT =
-.
In 2U
Substituting our estimate of the growth rate a into this formula gives an estimate of the generation time, T . The standard error of the estimate of T may be calculated using the delta method (RAO 1973) from the standard error of
the estimate of a from the regression analysis.
Basic experimental scheme: A recloned TK-6 cell pop- ulation was started as a mass culture in continuous expo- nential growth. Experiments performed at different times always started from the same clone, aliquots of which had been cryo-preserved at one time. We estimate that about 30 cell doublings were needed to expand from a single cell to 1.2 X lo7 cells for cold storage, and for further cell multiplication after thawing out an ampule of about lo6 viable cells to 10' cells before each experiment. This large cell population was needed for continued maintenance of the mass culture and for experimental manipulations such as selection for drug resistance and chemical mutagenesis. Shortly after the beginning of the experiment and at about 3-week intervals, at least 120 single cell clones were isolated. Each clone was allowed to reach a population size of 10-
12 X lo6 cells for 2-D PAGE analysis and cold storage in the cell bank. For experiments in which cells were not treated with mutagen, the initial cell count of an exponen- tially growing population in the mass culture on day 0 was 2.75 x lo6.
At each sampling time, additional cells were obtained from the proliferating mass culture for a determination of mutant frequencies at three specific loci: (1) hypoxanthine guanine phosphoribosyltransferase (HPRT) deficiency- resistance to the purine analog 6-thioguanine, (2) thymidine kinase (TK) deficiency-resistance to the thymidine analog trifluorothymidine, and (3) Na+/K+ ATPase defect-re- sistance to ouabain. Detailed analysis of the data on specific- locus mutation rates will be presented elsewhere.
Chemical mutagenesis: At the start of the first large- scale chemical mutagenesis experiment (E4-lo), an expo- nentially growing population of TK-6 cells was exposed for 40 min to N-ethyl-N-nitrosourea (ENU, obtained from Sigma) at 10 pg/ml of growth medium. The cell suspension was centrifuged at 200 x g, the medium was removed, and the cells were resuspended in growth medium for continued incubation. The same mutagenic treatment was repeated daily for four more days. The reason of applying split doses of the mutagen was to improve cell viability. After the third ENU treatment, the plating efficiency of the treated population was 0.21 as compared to 0.51 in the control population; the cell killing was thus about 60%. The treated cell population was then maintained in contin- uous proliferation in the absence of ENU for the following 2.5 months, during which daily cell counting, adjustment of cell density and medium renewal were made. Cell cloning was done at approximately 3-week intervals. The proce- dures used in the second chemical mutagenesis experiment (E5-50) were essentially the same as in the first experiment except that the cells were exposed to ENU once at 50 pg/ ml (0.43 mM) for 40 min. Only 2.4% of the treated cell population survived and retained proliferative capacity.
2-D PAGE analysis of proteins: TK-6 cells were solu- bilized in order to dissociate multimeric proteins into their constitutive polypeptides. The constituent polypeptides were then separated into two dimensions, the first on the basis of charge by isoelectric focusing, the second on the basis of molecular weight by electrophoresis in the presence of sodium dodecyl sulfate (SDS), by the technique of O'FARRELL (1975). The conditions used for the present experiments were based on those tested and developed for the detection of germline genetic variants in human lym- phocytes (NEEL et al. 1984; HANASH et al. 1986). Aliquots of 2 X lo6 TK-6 cells were washed twice with phosphate- buffered saline and centrifuged at 10,000 x g for 5 min. The supernatant was completely removed and the pellets were stored at
-
70" until further processing was conven- ient. A solubilization solution (9 M urea, 2% nonionicdetergent Nonidet P-40 (NP-40), 2% 2-mercaptoethanol, and 2% LKB pH 3.5-10 Ampholines) was added to the pellet. Following solubilization, the samples were centri- fuged at 13,000 X g for 2 min and the supernatant applied
to the first-dimension gel (containing 8.9 M urea, 2% NP-
40, and a mixture of 2%, w/v, ampholytes LKB pH 3.5- 10, LKB pH 5-7, and Serva pH 3-10 at a ratio of 11 :3: 11). Electrophoresis was for 16 h at 1200 V and then for 2 h at 1500 V. The gels were then extruded from the tubes and equilibrated for approximately 20 min in the solution described by O'FARRELL (1975). Second-dimension SDS gels were prepared with the DALT apparatus (ANDERSON and ANDERSON 1977); we used a 11.5-14.0% acrylamide gra- dient. Following electrophoresis, gels were (1) fixed in 50% ethanol-5% acetic acid, (2) washed with two changes of ethanol-acetic acid in which the ethanol concentrations were 25 and lo%, and (3) rinsed in 5% and 1% acetic acid. Finally the gels were soaked in distilled water.
The silver based staining technique of MERRIL et al. (198 1) was used to visualize the polypeptides. As is the case for our family studies involving human lymphocytes (HANASH
et al. 1986), more than 500 stained spots are clearly visible on gels assaying solubilized TK-6 cells. Among these, 267 spots on each 2-D gel were selected for scoring on criteria of size, well-defined morphology, and separation from other spots in the surrounding area.
Human Somatic Mutation Rates 695
in 40 Caucasian families were polymorphic (the frequency of the less common allele being >0.01). Ten of these 14 polymorphic loci were among the 267 spots scored for mutation in the TK-6 cell line. At the beginning of the analysis, we knew that the individual from whom the TK- 6 line was derived was heterogyzous at two such poly- morphic loci (spots 81/82 and 284285). In the course of this study, repeat changes were detected affecting either one of two neighboring spots (28/29), which most likely represent allelic products of a heterozygous autosomal locus. The previous family studies had not revealed poly- morphism at this locus. In addition, in the course of the study four clones exhibited alterations in each of a pair of neighboring polypeptides (spots 95/121). This last phenom- enon, of conjugated variation, is best explained by a mu- tation which is expressed not only in the primary gene product but a secondary product as well. Thus the total of 267 spots scored corresponds to a maximum of 263 loci, maximum because there may be other examples of deriv- ative gene products among spots scored.
The identities of the vast majority of the polypeptides scored were not known; each was assigned an arbitrary number. Not all the spots visualized in a 2-D gel could be scored on every gel. Our criterion was to limit the analysis of spots which could be scored on 95% or more of the gels. In reality, an average of 98% of the spots selected for the study could be scored. For the purpose of our mutation rate estimate, we have taken 263 as the number of loci scored per gel.
Almost all cell clones were stored in liquid nitrogen in case a repeat analysis was necessary. All mutant clones to be discussed below have been verified at least twice by the use of regrown cells after thawing. The occurrence of a mutation has been confirmed visually by at least two observers. Some of the mutants have also been successfully recognized with the aid of automated image analysis (HAN-
ASH et al. 1987).
Calculation of mutation rate: We define the mutant fraction at population doubling g, MF(g), as the proportion of alleles at the 263 loci that were mutants by doubling g. Using a deterministic model and assuming no initial mu- tants, equal growth rates for mutant and nonmutant cells, negligible cell death and back-mutation, and that mutations occur with equal probability throughout the cell cycle,
MF(g) = l n 2 - A - g = p e g
(ARMITAGE 1953, Eq. 5). Here, A is the mutation rate as defined in ARMITAGE 1953, Eq. 2, and p. is the mutation rate per allele per cell generation, which we wish to estimate (LURIA and DELBRUCK 1943). In the control experiment in which the mutant fraction was estimated at each of several generations gi ( i = 1, 2,
. . .
, G), the total expected number of mutants detected isG
E(mutants) = [MF(g,)
.
allele tests,]i = 1
G
= p 2
.
loci.
(gi.
clones;) i = 1where “allele tests;’ is the number of allele tests at gener- ation g,, and clonesi is the number of clones scored at generation gi. The number of allele tests corresponds to the total number of loci screened times twice the number of clones. The factor of 2 is introduced because of the diploid chromosome complement and ignores the fact that
r
ELAPSED TIME (I),DAYS
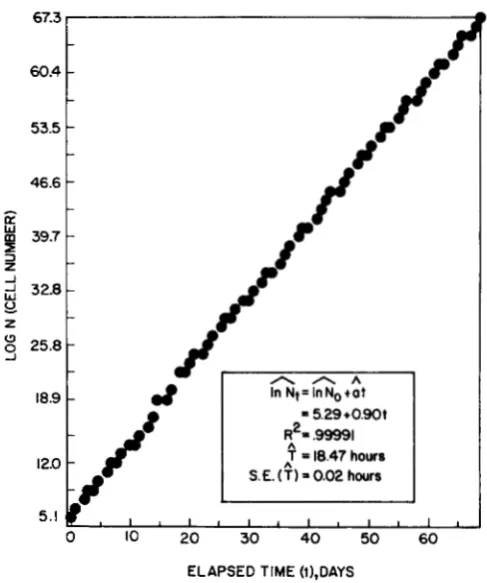
FIGURE 1.-Exponential growth of a human lymphoblastoid cell line TK-6. The ordinate shows the estimated number of cells if all cell progeny were allowed to accumulate. In practice about one half of the cells were discarded daily. The average cell generation time in this particular experiment (E4-IO) was 18.47 2 0.02 hr. Hats (*) indicate estimates from the regression analysis; R‘ is the squared correlation between observed and predicted values in the regression; S.E. is standard error.
TK-6 cell has a male karyotype. Hence, a natural estimate of the mutation rate p is
a =
observed number of mutants2 loci
.
x
(gi * clones;)G (1)
i = 1
This is in fact the maximum likelihood estimator of p. Given several experiments (see below), terms in the nu- merator and denominator are summed over all experiments to give the estimated spontaneous mutation rate.
The ENU-induced mutation frequency was estimated as the total number of mutants divided by the number of allele tests. Thus, we assume that all detected mutants in the ENU experiment are due to induction by the mutagen, reasonable in view of the very large difference between the findings in the contol and treated lines.
RESULTS
Long-term exponential cell proliferation: Our re-
696 Chu et al.
TABLE 1
Estimation of spontaneous rate for electrophoretic mutation in the TK-6 human lymphoblastoid cell line in culture
No. of
Sampling No. of
Experiment time Day generations” analyzed mutants clones No. of
85-1 A 3 36 57 0
B 13 56 81 0
C 34 97 67 0
D 56 141 91 0
85-2 A 6 36 77 0
B 30 60 100 0
C 50 80 91 0
D 76 105 116 0
87- 1 A 10 41 117 1
B 40 72 113 1
C 88 123 117 0
D 122 159 100 1 a The average cell generation times (T) in the three experiments
were calculated as 12.13 f 0.13 hr (85-l), 24.21 f 0.07 hr (85- 2), and 22.79 2 0.06 hr (87-l), respectively.
of the exponential cell growth in one experiment (E4-10) over a period of 69 days. The average gen- eration time was estimated by simple linear regression as 18.47
*
0.02 (estimate & standard error) hr.Spontaneous mutation: Technical limitations did not permit concurrent experiments nor more than 120 cell clones to be isolated at any one sampling time. However, each experiment was initiated from aliquots of the same frozen stock of one clone and the same cell culture and harvesting procedures were maintained.
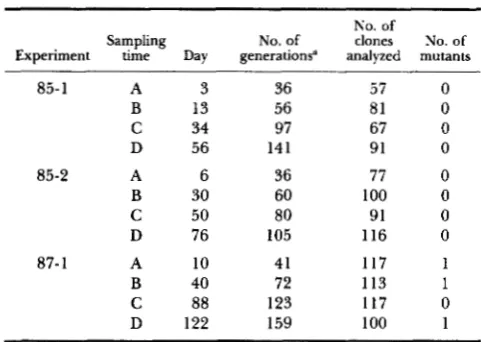
Three experiments were performed to detect the possible occurrence of spontaneous electrophoretic mutation in TK-6 cells. The results are summarized in Table 1. A total of 1127 cell clones were isolated and one or more 2-D gels of each clone were prepared and analyzed. Two independent mutants affecting the same polypeptide (spots 951121) but exhibiting different phenotypes and a third mutant affecting a different polypeptide (spot 43) were observed. As- suming equal viability of mutant and nonmutant cells and taking into account the numbers of generations elapsed, in three experiments the denominator in our estimation Equation 1 for p was approximately 51 million. The result is a mutation rate estimate of 6 X l o p 8 per allele per cell generation. On the other hand, if mutant cells are less viable than parental cells, the actual rate of spontaneous mutations could be greater. In the limit, if mutant cells are detectable for only one cell generation, the estimate of the spontaneous mutation rate becomes the spontaneous mutant frequency, Le., 5 X mutants per allele (3 in about 590,000 allele tests).
Electrophoretic mutants induced by ethylnitro- sourea: In two pilot experiments (El-50 and E4-50) in which TK-6 cells were exposed to ENU at 50 pg/
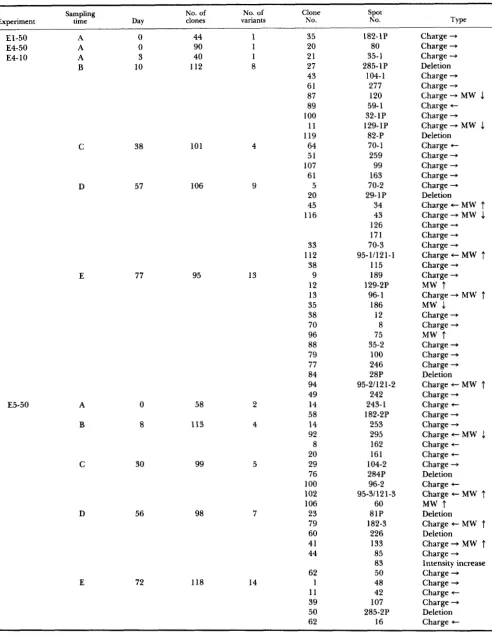
ml for 40 min, two mutants exhibiting basic charge alterations of the polypeptides (spots 182-1P and 80) were found among 134 clones examined (Table 2). Two large-scale ENU experiments (E4-10 and E5- 50) were then done, and the results are also sum- marized in Table 2. A total of 74 confirmed variants at 54 loci have been identified in the ENU experi- ments (Figure 2). Among these, 46 exhibited charge alterations of the polypeptide involved, six showed change in apparent molecular weight, 12 showed both a charge and an apparent molecular weight alteration, and one showed a significant increase in staining intensity of the protein spot (spot 83). The phenotype associated with a structural gene mutant usually included a diminished intensity (to about 50%) of the common (parental) polypeptide and the appearance at a neighboring location of a new poly- peptide of equal intensity (Figure 3). The frequency of induced variants was estimated as 1 . 1 X per
allele based on the 65 structural gene mutants in approximately 601,000 allele tests (263 loci X 1143
clones X 2 alleles).
At three preexisting heterozygous loci, a pair of polypeptide spots (28/29, 81/82, 284/285) were visible on the gel. Eight induced and one spontaneous nullimorphs (or amorphs) in which one or the other polypeptide encoded by the locus is not detectable at its usual location were observed at these three loci (e.g., Figure 3h); an additional nullimorph was de- tected in a spot not thought to be part of a poly- morphic system.
Human Somatic Mutation Rates 697
Experiment
El-50
Sampling No. of No. of Clone
time Day clones variants NO. \!.t Type
A 0 44 1 35 182-1P Charge +
E4-50 A 0 90 1 20 80 Charge +
E4- 10 A 3 40 1 21 35-1 Charge +
B 10 112 8 27 285- 1 P Deletion
E5-50 E A B C D
38 101
57 106
77 95
0 58
8 113
30 99
98
56
E 72 118
13 2 4 5 7 14 43 61 87 89 100 11 119 64 51 107 61 5 20 45 116 33 112 38 9 12 13 35 38 70 96 88 79 77 84 94 49 14 58 14 92 8 20 29 76 100 102 106 23 79 60 41 44 62 1 11 39 50 62 104- 1 277 120 59- 1 32-1P 129-1P 82-P 70- 1 259 99 163 70-2 29- 1 P
34 43 126 171 70-3 95-1/121-1 115 189 129-2P 96- 1 186 12 8 75 35-2 100 246 28P 242 95-21121-2 243-1 182-2P 253 295 162 161 284P 104-2 96-2 95-31121-3 60 81P 226 133 85 83 50 48 42 107 16 182-3 285-2P
Charge +
Charge +
Charge + MW
3.
Charge +
Charge +
Charge + MW
3.
Deletion Charge +
Charge +
Charge +
Charge -+ Charge +
Deletion Charge + MW Charge + MW 1
Charge -+ Charge +
Charge +
Charge +- MW
t
Charge +
Charge + MW
t
Charge + MW f
MW
Charge +
Charge +
Charge -+
Charge +
Charge +
Deletion Charge + MW f Charge +
Charge +
Charge +
Charge +
Charge + MW &
Charge +
Charge +
Charge +
Deletion Charge +
Charge + MW
t
Deletion Charge +- MWt
Deletion Charge + MW f Charge +
Intensity increase Charge +
Charge +
Charge +
Charge +
Deletion Charge +
MW
t
MW
t
E. H. Y. Chu et al.
TABLE 2-Continued
Sampling
Experiment time Day No. clones of variants No. of Clone No. Spot N O . Type
Total
F 102 69 5
69 85 91
101 116 114 7 17 28 52 58
1143 74
52
103 138 139
178
257 243-2
59-2
29-2P
114-1 114-2 32-2P 114-3 32-3P
Charge ”*
Charge + MW
7
Charge +MW
4
MW1
Charge +Charge ”*
Deletion Charge -+
Charge +
Charge +
Charge ”*
Charge ”*
Charge +
The average cell generation time in two experiments was calculated as 18.47 f 0.02 hr (E4-10) and 19.20 f 0.08 hr (E5-50); MW =
molecular weight;
t
larger; & smaller; Charge + acidic; ”* basic; P = gene product (polypeptide) of a polymorphic locus; protein variants are arranged in the order of discovery; the numeral after the hyphen ( e g . , 35-1) indicates the order of detection of a variant polypeptide spot at that locus; “Deletion” denotes the disappearance of one of the two spots encoded by a heterozygous gene, whether or not accompanied by a concomitant change in the staining intensity of the other spot.TABLE 3
Comparison of integrated staining intensity of polypeptide
spots produced by the corresponding alleles of nullimorphic mutants and the parental heterozygote”
Experimental
Mean relative intensity
senes Clone Polypeptide Parent Mutant P
E4-10B 27 284 0.19 f 0.064’ 0.36 0.003 E4-10B 119 81 0.48 f 0.073 1.09 0.000
E4-10D 20 28 1.70 f 0.333 2.37 0.050
E4-10E 84 29 1.34 f 0.198 2.43 0.000
E5-50C 76 285 0.48 f 0.044 0.69 0.0004 E5-50D 23 82 1.39
*
0.141 1.34 >0.50 E5-50E 50 284 0.39 f 0.127 0.48 0.25 E5-50E 116 28 0.82*
0.130 1.03 0.07587-1D 19 81 1.58 f 0.204 1.80 0.10
28/29, 81/82 and 2841285.
a Three heterozygous loci are identified by the pairs of spots
’
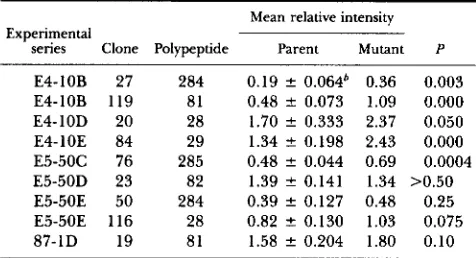
Standard deviation.than the means for the batch, the adjustment is to divide by 1.20. T h e result of this analysis is presented in Table 3. In five of the nine, the increase was statistically significant at the 0.05 level. We note that the failure of the silver-stained spots to exhibit dou- bling of their integrated intensity compared to the corresponding spot in the parental heterozygote is consistent with other observations relative to silver staining which indicate that doubling of the protein load results only in a fractional increment in the integrated spot intensity (GUEVARA et al. 1982; MER-
RIL, HARRINCTON and ALLEY 1984).
DISCUSSION
Comparison of mutation rates: The present study
uses 2-D PAGE to estimate human in vitro somatic
mutation rates based on the analysis of a variety of proteins of different nature. The technique permits detection of mutations which lead to proteins with altered electrophoretic properties, though not nec- essarily altered function (KLOSE 1975, 1982). We can be sure that for structural mutations only the active genes and not the entire genome are being assayed for mutation. Since, however, only approximately one-third of amino acid substitutions result in a charge change variant, and since the detection of loss-of-protein mutants was limited in this study to heterozygous loci, the rates derived in this study are well below the “total” locus rates. Even so, assuming one thousand base pairs as the average size of the coding sequence of a gene, by 2-D PAGE we can simultaneously screen for mutations over some
260,000 nucleotide pairs, a scale by far more efficient in comparison to the currently available DNA tech- niques for mutation analysis. Although the identities of the proteins scored are generally unknown, deter- mination of mutant frequency at a large number of loci selected only because their protein products are clearly visualized on 2-D gels should introduce no known bias with respect to mutability. This is in contrast to mutation assays based on a few selectable loci, at which the number of recoverable mutants can be strongly influenced by intrinsic or extrinsic factors. As far as we are aware, our estimates of spontaneous somatic mutation rate and the induced mutation frequency by ENU are based on analysis of gene products from the largest number of loci in the largest number of independent cell clones ever as- sayed in a study of this nature.
Human Somatic Mutation Rates 699
kDa
67
43
-
I).31
pH 4.0
,? . .,iy
.,-+
. . *- 'M,.. .-..d
0 - 2 5 3 a
*
e
a
*
6
*
i18
*
* *
*
e
-2571"
0 w
&9
*
I1 .-
1L
et
e -
e
d
a
n
f
qn
A
t
h
o ; m
FIGURE 3.-Enlargements of sections of two-dimensional gels from five independent clones of TK-6 cells each exhibiting a change in polypeptide spot(s). (a). (c), (e), (g), and (i) show the allele products at given l o c i in the parental cells. (b) Isoelectric charge and molecular weight changes in polypeptide spots 95/121
in a spontaneous mutant. ’Ihese polypeptides represent nonallelic products of a single gene. (d) ENU-induced variant spot 182 showing a cathodal charge change. (0 ENU-induced variant spot 182 showing both an anodal charge shift and an apparent molecular weight alteration. (h) ENU-induced nullimorph at a heterozygous locus. The polypeptide spot 284 is missing while the staining intensity of spot 2x5 is increased. (j) ENU-induced variant poly-
peptide spot i0 showing an anodal charge shift. n indicates normal polypeptides and m, mutant polypeptides.
and RATHENBERG (1975) have reviewed the various methods for estimation of human mutation rates and concluded that the spontaneous rates of germinal mutations for human autosomal and sex-linked genes are in the range of to lo-’ per locus per human generation. NEEL et al. (1986), in studies of a Japanese population involving a total of 539,170 allele tests distributed over 36 polypeptides on 1-D gels, found three presumptive spontaneous mutations that alter the electrophoretic mobility of the polypeptides. This corresponds to a mutation rate of 0.6 X lo-’ per
allele per generation. When these data were com- bined with those of others, there were a total of four mutations in 1,255,296 allele tests, a rate of 0.3 X
IO-’ per allele per generation.
It is desirable to establish a “conversion factor” between somatic and germinal mutation rates so that information obtained from experimental cell systems
in vitro may be extended to evaluation of genetic
hazard posed by mutagenic exposure in human pop- ulations. It should be noted that somatic rates are estimated on the basis of per cell generation, while germinal rates are based on per human generation. T h e estimated number of cell divisions of human oogonia per life span was 21 and the estimated numbers of cell divisions in human spermatogenesis from embryonic development to meiosis were ap- proximately 380 at the age of 28 and 540 at the age of 35 (VOGEL and RATHENBERG 1975). However, the
number of cell divisions in a human life cycle may not be relevant if most mutations occur at meiosis or premeiotic stages, as in experimental organisms. Lit-
tle is known about the intervening processes that occur between a mutational event in the germline and its recognition as a mutant in the progeny. Nonetheless, a true scientific bridge may be built if
we compare the rates of human somatic and germinal mutations in the same population using the same battery of polypeptide spots on 2-D gels (NEEL et al.
1984).
Treatment of TK-6 cells with ENU resulted in a marked increase in the number of electromorphic mutants, giving an estimated induced frequency of 1.1 X per allele. On the assumption, as dis-
cussed earlier, that all the 65 electromorphs were induced by ENU in one cell generation, the induced mutant frequency is about 35-fold higher than the spontaneous mutant frequency (4 X per allele).
Most of the previous mutation studies with cultured mammalian cells were based on a few selectable markers, mainly those conferring drug resistance (see reviews: HOWARD-FLANDERS 1981; CHU, Lr and Fv 1984). T h e estimated rate of spontaneous mutation from azaguanine sensitivity (HPRT+ ) to resistance (HPRT- ) in cultures of human fibroblasts varied from 0.45 X to 1.8 X per allele per cell
generation (DEMARS and HELD 1972). In two normal strains of human fibroblasts, estimates of sponta- neous mutation rates at the same locus by two meth- ods ranged from 1.5 X to 4.9 X per locus per cell generation (WARREN et al. 1981). The “spon- taneous background mutant fraction” were 3 x
3 X and 5 X respectively, for resistance to 6-thioguanine, trifluorothymidine or ouabain in TK-6 and related cells lines (THILLY et al. 1980). In our TK-6 cell experiments (our unpublished results), the average spontaneous mutant frequencies to either 6-thioguanine resistance or trifluorothymidine resis- tance were 4.7 X mutants per allele and 5.0 X
mutants per allele, respectively. The sponta- neous mutant frequency to ouabain resistance was 8.0 X mutants per allele. For technical reasons
including differences in growth rates between mutant and nonmutants, we have not calculated the spon- taneous mutation rates at the three specific loci in TK-6 cells.
Human Somatic Mutation Rates 701
mammalian cells involve loss of protein or activity and have been shown to be the result of a wide variety of mutational events including base substitu- tions, frame shifts, deletions, and gross rearrange- ments (YANDELL, DRYJA and LITTLE 1986; GROSOVSKY et al. 1988). The electromorphs we observed retain their protein products. Our estimate of a spontaneous mutation rate for electromorphs of 6 x lo-' per allele per cell generation (ie., 1.2 X per locus per cell generation) is the average rate at multiple loci coding for a much broader battery of protein indicators. Assuming that only one-third of amino acid substitutions may be detected by 2-D PAGE as charge change variants, our corrected spontaneous mutation rate for electromorphs (1.8 X per allele per cell generation) is still one order of mag- nitude lower than the spontaneous mutation rates at the standard selectable loci. Clearly, the estimate is subject to sampling variability since it is based on only three mutants. It is possible that this class of mutations leading to changes in electrophoretic prop- erties may have an intrinsically low frequency, as compared to mutations at selectable loci. It is also possible that our assumption of equal viability be- tween mutant and nonmutant cells may be incorrect. Further studies are needed to test these possibilities. In this study, three out of the 263 loci used for analysis would clearly detect loss of gene product as a result of deletions, rearragements and other gross alterations of the coding sequence of the gene, or instability of the gene product. At the great majority of the loci scored which are likely to be autosomal, only electromorphs, i.e., structural gene mutation exhibiting alteration of the electrophoretic properties of the polypeptide in question have been scored. We are developing quantitative methods for detecting the deletion-type of mutants exhibiting a 50% reduc- tion of polypeptide spot intensity. It would be im- portant to determine the relative frequencies of elec- tromorphs and nullimorphs at a large number of unselected loci by 2D-PAGE analysis, in comparison with the spectrum and frequencies of nucleotide changes at selectable loci.
It is perhaps hazardous to compare the human somatic mutation data we have obtained with muta- tion rates in somatic and germ cells of rodent species, because vast differences exist among species, cell types, genetic loci, and experimental conditions used. However, it is of interest to compare mutation data based on changes of protein markers as revealed by l-D or 2-D electrophoresis. By starch gel electropho- resis and histochemical staining for variation in the mobility and/or activity of 44 isozyme loci in hundreds of CHO cell clones, SICILIANO et al. (1986) concluded that the average spontaneous frequency of electro- phoretic mutants in these cells was 0.06 x
locus, whereas the average induced frequencies, at 10-20% cell survival, were 5.21 x 10⁻³/locus (ethyl
methanesulfonate), 3.70 X 10⁻³/locus (ENU) and 1.04 x 10⁻³/locus (ultraviolet light). The sponta- neous frequency is not corrected for cell generations and cannot therefore be compared with our data.
ZEINDL, SPERILING and KLOSE (1982) studied chemical mutagenesis on CHO cells by protein mapping using 2-D electrophoresis. The study included 26 clones derived from methylnitrosourea-treated cells and 26 untreated control clones, amounting to a total of about 33,800 locus tests. Two protein variants were found in the treated group and none in the control group. The small number of mutations detected in that study and the lack of polymorphism data per- taining to polypeptides scored did not permit an evaluation of differential locus sensitivity to mutation.
Variation in mutability among loci: In four chem-
ical mutagenesis experiments with TK-6 cells, eight structural mutants (32-1, 32-2, 32-3, 129-1, 129-2, 182-1, 182-2, 182-3) of a total of 65 were found to have occurred at the ten previously identified poly- morphic loci, while 57 occurred at the remaining 253 loci.
The question of differences in mutability among loci may also be addressed by examining repeat mutations. Sixteen instances of repeat mutations at a given locus were observed for 11 loci encoding poly- peptides 32, 35, 59, 70, 951121, 96, 104, 114, 129, 182, and 243 (Table 2). Repeat mutants at seven of these loci either displayed different electrophoretic phenotypes or arose from different experiments or both, providing clear evidence for independent origins. Interestingly, the two spontaneous mutants occurred at the locus that specifies the polypeptides 95/12 1, but showed electrophoretic mobility patterns different from each other and from that of the other three ENU-induced mutants of this same gene. The third spontaneous mutant (polypeptide
43)
differed in electrophoretic mobility from that of one ENU-induced mutant at the same locus (experiment E4- 10D, Table 2).
There is strong statistical evidence that structural gene mutants detectable by 2-D PAGE do not occur (or survive) randomly. Furthermore, the frequency of these mutations is higher among polymorphic loci than at the remaining loci tested. The methods for calculating the probabilities and further discussion on the subject have been presented elsewhere (HAN-
ASH et al. 1988). In the present context, the non- randomness of mutation and variation in mutability among loci, as evidenced by our data, must be taken into consideration in assessment of genetic risks. It is also clear that mutation rate estimate based on a large number of loci would be more representative than those based on a few selectable loci.
Origin and significance of nullimorphs: The dis-
sense mutation, (2) chromosome loss, (3) deletion, (4)
chromosome rearrangement leading to inactivation of the gene, (5) back mutation, (6) mutation leading to inactive product of the gene, and
(7)
mitotic recombination. Among the nine nullimorphs occur- ring at the three heterozygous loci, nondetection of one allelic product in four instances could be ex- plained by any of the first six listed mechanisms. In five other instances, the remaining spot of the pair significantly ( P 5 0.05) increased in staining intensity(Table 3). This finding can be most readily explained by mitotic recombination between homologous chro- mosomes. Spontaneous mitotic recombination has been demonstrated in several eukaryotic organisms (STERN 1936; PONTECORVO and KAFER 1958; VIG and PADDOCK 1968; KATZ and KAO 1974) and in somatic mammalian cells in culture (WASMUTH and HALL
1984; RAJAN et al. 1983; KIPPS and HERZENBERG 1986;
POTTER et ai. 1987). Development of homozygosity and hemizygosity of mutant alleles through mitotic recombination or nondisjunction in somatic cells in vivo may not be infrequent and may account for increase of genetic variability (LANGLOIS et al. 1987)
and cancer (CAVENEE et al. 1983).
T h e tenth nullimorph is characterized by a total absence of a polypeptide (spot 226 in experiment E5-
50D) which is not known to be specified by a single allele, i e . , not in a presumed heterozygote for the locus. One possible explanation is that the missing gene product may be the result of a deletion type of mutation at either an X - or a Y-linked locus. The mode of origin of the mutant specifying spot 83
which exhibited a significant increase in staining intensity remains unclear. ENU alkylates both with oxygen and nitrogen atoms of nucleic acid bases (SINGER and KUSMIEREK 1982) and is expected to cause base pair substitutions. It is remarkable that nullimorphs of various types were induced by this mutagen in TK-6 cells. Agents causing large dele- tions, chromosome rearrangements, chromosome nondisjunction, or recombination may test the pos- sibility of inducing nullimorphs in these cells.
Concluding remarks: T h e rationale for utilizing ENU to increase the genetic variability of TK-6 cell populations was to assess the usefulness and limita- tions of 2-D PAGE for mutation studies and not merely to confirm its mutagenic potency in human cells. T h e resulting collection of variant clones with induced electromorphs and nullimorphs, the largest number of their kind ever assembled for mammalian cells, has permitted conclusions to be drawn regard- ing both the qualitative and quantitative aspects of mutation and other genetic processes leading to
protein variation in these human somatic cells. Al- though further improvements of the assay system are necessary and many investigative possibilities can be suggested, it is already evident that the multilocus
approach to mutation studies by 2-D gel analysis is valid and feasible. Work in progress in our laboratory has led to an increase in the number of polypeptides assayable by 2-D PAGE, computer assisted image analysis of spot variation and microsequencing of selected polypeptides retrieved from 2-D gels. T h e general experimental procedures developed in the present study should be applicable to in vivo somatic mutation studies in human T lymphocytes grown and cloned in vitro. By applying the same panel of lymphoid polypeptides, it should be possible to obtain a more meaningful comparison of the rates of somatic and germline mutation in man.
This research was supported by a program project grant CA 26803 from the US. Public Health Service. W.N. and J.V.N. were supported by U.S. Department of Energy Contract AC-02-82-ER
60089. The authors thank P. E. Smouse for review of the manu- script.
LITERATURE CITED
ANDERSON, L., and N. G . ANDERSON, 1977 High resolution two- dimensional electrophoresis of human plasma proteins. Proc. Natl Acad. Sci. USA 74: 5421-5425.
ARMITAGE, P., 1952 The statistical theory of bacterial populations subject to mutation. J. R. Stat. SOC. (Ser. B) 14: 1-40. ARMITAGE, P., 1953 Statistical concepts in the theory of bacterial
mutation. J. Hyg. 51: 162-184.
CAVENEE, W. K., T. P. DRYLA, R. A. PHILLIPS, W. F. BENEDICT, R. GODBOUT, B. L. GALLIE, A. L. MURPHREE, L. C. STRONG and
R. L. WHITE, 1983 Expression of recessive alleles by chromo- somal mechanisms in retinoblastoma. Nature 305: 779-784. CHU, E. H. Y., M. BOEHNKE and S. M. HANASH, 1988 Application
of two-dimensional electrophoresis to the detection of human somatic mutations at the protein level. pp. 203-209. In:
Banbury Report 28: Mammalian Cell Mutagenesis. Cold Spring Harbor Laboratory, Cold Spring Harbor, N.Y.
CHU, E. H. Y., I.-C. LI, and J. Fu, 1984 Mutagenesis studies with cultured mammalian cells: problems and prospects. pp. 3 15- 345. In: Mutation, Cancer and Malformation, Edited by E. H. Y. CHU and W. M. GENEROSO. Plenum Press, New York.
CHU, E. H. Y., M. BOEHNKE, S. M. HANASH, B. LAMB, W. NIEZGODA,
S. PIVIROTTO and G . SUNDLING, 1986 Estimation of human somatic mutation rates in vitro. Am. J. Hum. Genet. 39: A6. DEMARS, R., and K. R. HELD, 1972 The spontaneous azaguanine-
resistant mutants of diploid human fibroblasts. Humangenetik
GROSOVSKY, A. J., J. G . DE BOER, P. J. DE JONG, E. A. DROBETSKY and B. W. GLICKMAN, 1988 Base substitutions, frameshifts and small deletions constitute ionizing radiation-induced point mutations in mammalian cells. Proc. Natl. Acad. Sci. USA. 85:
185-188.
GUEVARA, J., D. A. JOHNSON, L. S. RAMAGALI, B. A. MARTIK, S. CAPETILLO and L. V. RODRIGUEZ, 1982 Quantitative aspects of silver deposition in proteins resolved in complex poly- acrylamide gels. Electrophoresis 3: 197-205.
HANASH, S. M., L. BAIER, M. GATLEAU and D. WELCH, 1986 Genetic variants detected among one hundred and six lymphocyte polypeptides observed in two-dimensional gels. Am. J. Hum. Genet. 39: 317-328.
HASASH, S. M., E. H. Y. CHU, R. KUICK, M. SKOLNICK, J . N E E L , ~ . STRAHLER, S. PIVIROTTO and W. NIEZGODA, 1987 Detection of human somatic cell structural gene mutation by two- dimensional electrophoresis. Protein 2: 13-19.
HANASH, S. M., M. BOEHNKE, E. H. Y. CHU, J . V. NEEL and R. D.
Human Somatic Mutation Rates 703
KUICK, 1988 Non-random distribution of structural mutants following ethylnitrosourea treatment of human lymphoblas- toid cells. Proc. Natl. Acad. SA. USA 85: 165-169.
HOWARD-FLANDERS, P., 1981 Mutagenesis in mammalian cells. Mutat. Res. 86: 307-327.
KATZ, E. R., and V. KAO, 1974 Evidence for mitotic recombina- tion in the cellular slime mold Dictostelium discoideum. Proc. Natl. Acad. Sci. USA 71: 4025-4026.
KIPPS, T. J., and L. A. HERZENBERG, 1986 Homologous chro- mosome recombination generating immunoglobulin allotype and isotype switch variants. EMBO J. 5: 263-268.
KLOSE, J., 1975 Protein mapping by combined isoelectric focusing and electrophoresis of mouse tissues. Humangenetik 26: 231- 243.
KLOSE, J., 1982 Genetic variability of soluble proteins studied by two-dimensional electrophoresis on different inbred mouse strains and on different mouse organs. J. Mol. Evol. 18: 315- 328.
KUICK, R. D., S. M. HANASH, E. H. Y. CHU and J. R. STRAHLER,
1987 A comparison of some adjustment techniques for use with quantitative spot data from two-dimensional gels. Elec- trophoresis 8: 199-204.
LANGLOIS, R. G., W. L. BIGBEE, S. KYOIZUMI, N. NAKAMURA, M. A. BEAN, M. AKIYAMA and R. H. JENSEN, 1987 Evidence for increased cell mutations at the glycophorin A locus in atomic bomb survivors. Science 236: 445-448.
LURIA, S. E., and M. DELBR~~CK, 1943 Mutations of bacteria from virus sensitivity to virus resistance. Genetics 28: 491-5 1 1 .
MERRIL, C. R., M. HARRINGTON and V. ALLEY, 1984 A photo- development silver stain for the rapid visualization of proteins separated on polyacrylamide gels. Electrophoresis 5: 289-297.
MERRIL, C. R., D. GOODMAN, S. A. SEDMAN and M. H. EBERT,
1981 Ultrasensitive stain for proteins in polyacrylamide gels show regional variation in cerebrospinal fluid proteins. Science
NEEL, J. V., 1983 Frequency of spontaneous and induced “point” mutations in higher eukaryotes. J. Hered. 74: 2-15.
NEEL, J. V., B. B. ROSENBLUM, C. F. SING, M. M. SKOLNICK, S. M. HANASH and S. STERNBERG, 1984 Adapting two-dimensional gel electrophoresis to the study of human germline mutation rates. pp. 259-306. In: Methods and Applications of Two Dimen- sional Gel Electrophoresis of Proteins, Edited by J. E. CELIS and R. BRAVO. Academic Press, New York.
NEEL, J. V., C. SATOH, K. GORIKI, M. FUJITA, N. TAKAHASHI, J.-I. ASAKAWA and R. HAZAMA, 1986 The rate with which spon- taneous mutation alters the electrophoretic mobility of poly- peptides. Proc. Natl. Acad. Sci. USA 83: 389-393.
OFARRELL, P. H., 1975 High resolution two dimensional electro- phoresis of proteins. J. Biol. Chem. 250: 4007-4021.
PONTECORVO, G., and E. KAFER, 1958 Genetic analysis based on mitotic recombination. Adv. Genet. 9: 71-104.
POTTER, T. A., R. A. ZEFF, W. FRANKEL and T. V. RAJAN,
211: 1437-1438.
1987 Mitotic recmbination between homologous chromo- somes generates H-2 somatic variants in vitro. Proc. Natl. Acad. Sci. USA 8 4 : 1634-1637.
RAJAN, T. V., E. D. HALAY, T. A. POTI-ER, G. A. EVANS, J. G. SEIDMAN and D. H. MARGULIES, 1983 H-2 hemizygous mu- tants from a heterogygous cell line: role of mitotic recombi- nation. EMBO J. 4: 1537-1542.
RAO, C. R., 1973 Linear Statistical Inference and Its Applications, Ed.
2. John Wiley & Sons, New York.
SICILIANO, M. J., G. M. ADAIR, E. N. ATKENSON and R. M. HUMPHREY, 1983 Induced somatic cell mutations dtected in cultured cells by electrophoresis. Isozymes Curr. Top. Biol. Med. Res. 10: 41-49.
SICILIANO, M. J., R. L. STALLING, R. M. HUMPHREY and G . M.
ADAIR, 1986 Mutation in somatic cells as determined by electrophoretic analysis of mutagen-exposed Chinese hamster ovary cells. pp. 509-531. In: ChemicalMutagens, Vol. 10, Edited by F. J. DE SERRES. Plenum Press, New York.
SINGER, B., and J. T. KUSMIEREK, 1982 Chemical mutagenesis. Annu. Rev. Biochem. 51: 655-693.
SKOPEK, T. R., H. L. LIBER, B. W. PENMAN and W. G. THILLY,
1978 Isolation of a human lymphoblastoid cell line hetero- zygous at the thymidine kinase locus: possibility for a rapid human cell mutation assay. Biochem. Biophys. Res. Commun.
STERN, C., 1936 Somatic crossing over and segregation in Droso- phila melanogaster. Genetics 21: 625-730.
THILLY, W. G., J. G. DELUCA, E. E. FURTH, H. HOPPE IV, D. A. KADEN, J. J. KROLEWSKI, H. L. LIBER, T. R. SKOPEK, S. A. SLAPIKOFF, R. J. TIZARD and B. W. PENMAN, 1980 Gene-locus mutation assays in diploid human lymphoblast lines. pp. 331- 364. In: Chemical Mutagens, Vol. 6, Edited by F. J. DE SERRES and A. HOLLAENDER. Plenum Press, New York.
VIG, B., and E. PADDOCK, 1968 Alteration by mitomycin C of spot frequencies in soybean leaves. J. Hered. 59: 225-229.
VOGEL, F., and R. RATHENBERG, 1975 Spontaneous mutation in man. Adv. Hum. Genet. 5: 223-318.
WARREN, S. T., R. A. SCHULTZ, C.-C. CHANG, M. H. WADE and J. E. TROSKO, 1981 Elevated spontaneous mutation rate in Bloom syndrome fibroblasts. Proc. Natl. Acad. Sci. USA 78:
WASMUTH, J. J., and L. V. HALL, 1984 Genetic demonstration of mitotic recombination in cultured Chinese hamster cell hy- brids. Cell 36: 697-707.
YANDELL, D. W., T. P. DRYJA and J. B. LITTLE, 1986 Somatic mutations at a heterozygous autosomal locus in human cells occur more frequently by allele loss than by intragenic struc- tural alterations. Somat. Cell Mol. Genet. 12: 255-263.
ZEINDL, E., K. SPERLING and J. KLOSE, 1982 Mutagenicity testing on non-selectively cloned Chinese hamster ovary cells with the protein-mapping method. Mutat. Res. 97: 67-78.
84: 411-416.
3133-3137.