Design and Development of a Portable
Low-Cost Instrument for Quantification of Urea in
Milk
Dr.K.B.Ramesh1, C.S.Satish2, Girija.B.M3,Arun Kumar.S4
Associate Professor and HOD, Dept. of EIE, R.V. College of Engineering, Bengaluru, India1
UG Student, Dept. of EIE, R.V. College of Engineering, Bengaluru, Karnataka, India2
UG Student, Dept. of EIE, R.V. College of Engineering, Bengaluru, Karnataka, India3
UG Student, Dept. of EIE, R.V. College of Engineering, Bengaluru, Karnataka, India4
ABSTRACT: Milk being nature’s ideal food for people of all ages is adulterated for huge profits in developing
countries.Urea is added to milk to increase its SNF and nitrogen value. This paper describes the design of a low-cost, portable instrument using CO2 gas sensor technology to quantify and differentiate milk samples containing excess urea. Milk containing urea, in presence of urease enzyme hydrolyses urea to form ammonia and carbon dioxide. Carbon dioxide released which is in gaseous phase is sensed by a CO2 sensor.At suitable gain, its output voltage increases with rise in CO2 concentration. The voltage obtained is fed to signal conditioning circuit where the signal is compared with pre-defined threshold voltage.Based on results, presence of ureawithin the permissible rangeis indicated by corresponding LED. The developed module was tested for its static characteristics. An improvement in design over existing bulky modules was achieved. A portable, sturdy, non-fragile and affordable instrument was developed in order to cater to the needs of society to check for nutritional standards of milk consumed by every individual.
KEYWORDS: CO2 sensor, threshold voltage, portable, LED, urea quantification.
I.INTRODUCTION
Milk comprises various nutrients essential for our balanced diet. It is considered as complete food and is consumed by people of all ages [9]. Due to its ever increasing demand, it has paved a way for adulteration with substandard materials to gain huge profits. Addition of water to milk was one of the easiest ways to achieve this goal. But with the latest instruments available to identify quality of milk, people are inclined towards alternative methods of adulteration and one such method is addition of urea. Urea available at low cost is added to milk to increase its shelf life and SNF value [11]. It is also added in manufacturing of synthetic milk to maintain SNF and MUN ratio value similar to that of traditional milk. Thus distinguishing milk samples as traditional or synthetic milk will be highly difficult by employing commonly available tests. Milk containing added urea is harmful for human beings as it results in cancer and kidney disorders [5][10]. Reports suggest that urea level beyond 70mg/100ml is harmful to human health [1]. Hence urea quantification using various types of biosensors has attained vital scope and diversity in the recent years and research is being carried out consistently. Section III of this paper deals with the method and design adopted to achieve portability, low cost and accurate instrument. The results obtained during the course of time are tabulated and conclusion is derived in Section IV and V respectively
II.LITERATURE SURVEY
Elizabeth. Piezo electric sensor was used to construct and detect urea in milk which measures the presence of gas, evolvedfrom sample. Linear behaviour was obtained from sensor for varying concentrations of urea in sample. Sensor gave satisfactory output for liquid to gas ratio of 1:2.5. Time response evaluated is 180s. At absorbance of 525nm, varying concentrations of urea were analysedfrom 0 to 0.1mg/ml. Milk samples with and without solid content were analysed and found that solid in milk will affect detection of urea[8]. L.J. Ni, L.G. Zhang, M.Y. Tang, Z.B. Xue proposed method to discriminate adulterated cow milk by improved ν-Support Vector Machines (ν-SVM) and NIR spectroscopy.Aqueous solution of dextrin containing pseudo particles were addedintentionally to different quantity of milk samples. To discriminate these different samples of adulterated milk based on NIR spectroscopy, improved ν -Support Vector Machines was applied. The obtainedresults show that the adulterated milk samples containing 5% of adulteration solution or more can be well identified by improved ν-SVM combining NIR spectroscopy method. This method couldn’t distinguish pseudo protein which was to be further analysed to determine it [6].
III.METHODOLOGY
CH2N2O UREASE NH3 + CO2
Urea Ammonia gas Carbon dioxide
Eqn 1. Hydrolyses of urea
When urease is added to milk containing urea, it hydrolyses urea as ammonia gas and carbon di oxide gas as shown in Eqn 1. This carbon dioxide gas that is liberated is sensed by sensor.
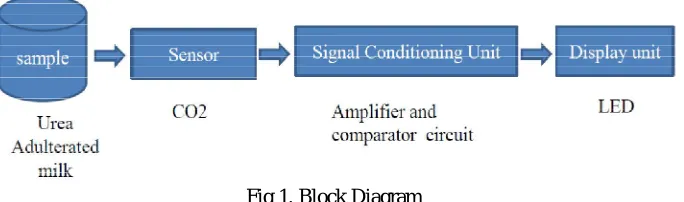
Fig 1. Block Diagram
The block diagram in Fig 1 describes the overall flow of the system. The carbon dioxide sensor senses the presence of carbon dioxide gas liberated from milk sample (by addition of urease) and gives an appropriate voltage signal, which is amplified and fed to comparator circuit. The output signal drives the corresponding LED depending on the normal and harmful levels of urea present.
Detection of carbon dioxide gas in the milk sample is achieved using MQ135 carbon dioxide gas sensor. This sensor produces a voltage which is insufficient to drive comparator circuit and hence requires amplification. This is achieved by IC LM324. LM324 consists of 4 op-amps which can be used as a comparator and also as an amplifier when negative feed-back is provided. AND gate and NOT gate IC’s are used for implementation of digital logic. LEDs are used to distinguish milk samples based on their normal or harmful level of urea content.
IV.RESULTS
Organic milk contains negligible amount of urea. In 32% of organic milk samples the content of urea was 29.6 mg kg -1
lower than the minimum limit 150 mg kg-1 [9]. Hence analysis of this sample can help in setting up a standard table
Table 1. Experimental analysis of different amountsof urea for organic milk.
Table 1 consists of readings obtained from sensor for quantity of urea being added. Comparison of sensor output with expected voltage is also tabulated. Expected voltage values are obtained by 2-point calibration method. The readings were noted by adding urea in steps of 10 mg.
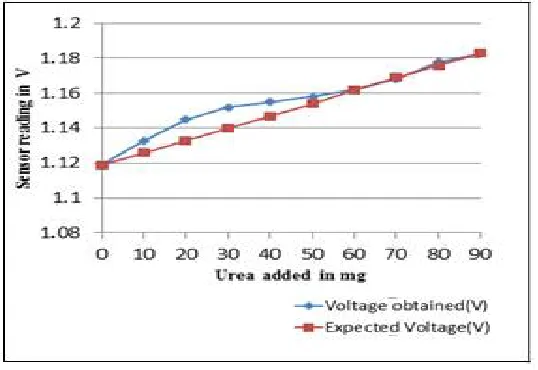
Fig 2. Urea added (mg) vs. Voltage obtained (mV) for organic milk
Fig 2 represents the graph for addition of urea quantity (mg) with respect to voltage obtained from sensor and expected voltage.It is clear that the sensor approximately follows an ideal response beyond 30mg of urea, making C02 gas sensor suitable for urea detection and quantification. The static characteristics of the sensor were calculated by considering the results tabulated in Table 1 and from graph as shown in Fig 2.
Quantity of urea added in
mg
Output from sensor in V
Expected Voltage(V)
0 1.11 1.11
10 1.133 1.126
20 1.145 1.133
30 1.152 1.14
40 1.155 1.147
50 1.158 1.154
60 1.162 1.162
70 1.168 1.169
80 1.178 1.176
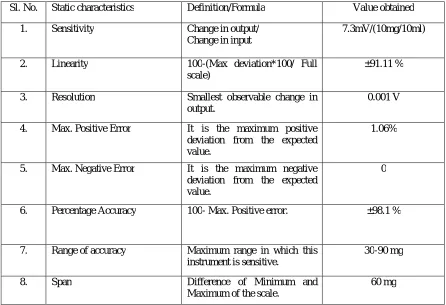
Table 2. Numerical values of static characteristics of the instrument
Sl. No. Static characteristics Definition/Formula Value obtained
1. Sensitivity Change in output/ Change in input
7.3mV/(10mg/10ml)
2. Linearity 100-(Max deviation*100/ Full scale)
±91.11 %
3. Resolution Smallest observable change in output.
0.001 V
4. Max. Positive Error It is the maximum positive deviation from the expected value.
1.06%
5. Max. Negative Error It is the maximum negative deviation from the expected value.
0
6. Percentage Accuracy 100- Max. Positive error. ±98.1 %
7. Range of accuracy Maximum range in which this instrument is sensitive.
30-90 mg
8. Span Difference of Minimum and
Maximum of the scale.
60 mg
Table 2 gives the static characteristic values of the instrument.From Table 1 it can be observed that 1.168V corresponds to 70 mg of urea. As 70mg of urea in milk is the maximum permissible limit, the corresponding voltage 1.168V can be set as threshold voltage to distinguish normal and adulterated samples.
Fig 3. Simulation in proteus 8 professional for normal level of urea present in milk
Fig 4.Simulation in proteus 8 professional for harmful level of urea present in milk
. Similarly, For urea content beyond 70 mg/100 ml in milk, the sensor voltage exceeds 1.168 V. This results in glow ofred LED indicating harmful level of urea content in milk sample. This process is demonstrated by simulation in proteus 8 professional as shown in fig 4.
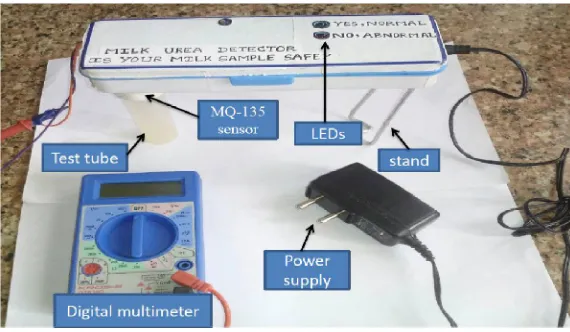
Fig 5. Model of the developed prototype
The final prototype of the instrument is as shown in Fig 5. It comprises of MQ135 sensor, test tube, stand, adaptor for power supply and LEDs. Digital multimeter is used to note down the voltage value at the pre signal conditioning stage. The objective of the designed prototype is to develop a portable, accurate, linear and sensitive device having good response time. From the results obtained, the above mentioned objectives were achieved.
V. CONCLUSION
concentration-21%.The designed instrument has linearity of 91.11 % in the range 30-90mg of urea with resolution of 0.001 V. Sensitivity was found to be 7.3mV/ (10mg/10ml). An accuracy of 98.1% can be further increased through precise calibration.
REFERENCES
1. S. Jha., “Rapid Detection of Food Adulterants and Contaminant”, 1st edition, Food science, eBook ISBN: 9780128004289, page(s): 207-208, 04 Jan 2016.
2. Alireza M., Mohammad A.K., Mohammad A.T. and Shabnam S., “Construction and Utilization of Urea Biosensors for Clinical, Environmental and Industrial Analysis”, Ira. J. Of Analy. Chem., Vol. 1, Feb 2014.
3. Bhanupriya P., Chaitanya R.S., Supriya T.V. and Varshitha V., “Comparison of Different Methods for Detection of Urea in Milk by Quantification of Ammonia”, Int.J. Of Adv. Res. In Electrical, Electronics and Instru. Engg. Vol. 2(2), pp. 7858-7863, March 2014.
4. Laurinavicius V., Razumiene J., Gureviciene V., “Conversion of Urea on Carbon Black Electrode and Application”, International Conference on Natural Computation, Vol.13, Issue: 6, DOI: 10.1109/JSEN.2013.2250711, Page(s): 2208 – 2213, 2013.
5. “Urology & Kidney Disease News”, Glickman Urological & Kidney Institute, A Physician Journal of Developments in Urology and Nephrology, Vol. 22, Winter 2013.
6. L.J. Ni, L.G. Zhang, M.Y. Tang, Xue Z.B., Xin Zhang, Xin Gu, Shixin Huang., “Discrimination of Adulteration Cow Milk by Improved ν
-Support Vector Machines (ν-SVM) and Near Infrared Spectroscopy” IEEE Transactions on Natural computations, pp.69-73, 2012.
7. R.J. Yang., R. Liu., and K.X. Xu., “Adulteration detection of urea in milk by mid-infrared spectroscopy”, Spectroscopy and Spectral Analysis, National Center for Biotechnology Information, Sep31(9): 2383-5, 2011.
8. E.F. Renny, D.K. Daniel, A.I. Krastanov, C.A. Zachariah, R. Elizabeth, “Enzyme based sensor for detection of urea in milk”, Department of Biotechnology, University of Food Technologies, Plovdiv, Bulgaria, pages: 1124-1128, 2011.
9. Jelena Zagorska., “The chemical composition of organic and conventional milk in Latvia” , Inga Ciprovica Latvia University of Agriculture, Department of Food Technology, Liela street 2, Jelgava, LV3001, Latvia, FOODBALT, 2008
10. Sethi, R.S., Lowe C.R., “Electrochemical micro biosensors”, IET Conference Publications, pp. 9/1 - 9/5,1990.