International Symposium on Bio-Inspired Computing (BIC’05)
. September 5-7, 2005. Johor
Bharu, Malaysia.
Applying Filter Approach and Genetic Algorithm Wrapper for Gene Selection
from Gene expression Data
Mohd Saberi Mohamad
1, Safaai Deris
1, Muhammad Razib Othman
1, Saad Subair
3and Anjum Iqbal
21
Department of Software Engineering, Faculty of Computer Science and Information Systems
Universiti Teknologi Malaysia, 81310 Skudai, Johore, Malaysia
Email: [email protected], [email protected]
2
Department of Computer System & Communication, Faculty of Computer Science and Information
Systems, Universiti Teknologi Malaysia, 81310 Skudai, Johore, Malaysia
Email: [email protected]
3
Faculty of Applied Sciences, Sohar University, P. O. Box 44, Sohar, Postal Code 311, Sohar,
Sultanate of Oman
Email: [email protected]
Abstract
Gene expression microarray data is expected to significantly aid in the development of efficient cancer diagnosis and classification platforms. One problem arising from this data is how to select a small subset of genes from thousands of genes and much fewer samples that are inherently noisy. This research deals with finding a small subset of informative genes from the gene expression data which maximize the classification accuracy and minimize the running time. This paper proposed a model of gene expression classification by using filter approach and an improved Genetic Algorithm wrapper approach. We show that the classification accuracy and execution time of the proposed model are useful for cancer classification of two widely used gene expression benchmark data sets.
1. Introduction
Due to recent advances in biotechnology, gene expression can now be quantitatively monitored on a global scale. Gene expression data is created by a process known as microarray that yields a set of floating point and absolute values [1][2][3]. These values represent the activation level of each gene within an organism at a particular point of time [4]. Recent studies on molecular level classification of tissue have indicated that gene expression data could significantly aid in the development of efficient cancer diagnosis and classification [5][6]. However, classification based on the gene expression data confronts with more challenges; one of the major challenges is the overwhelming number of genes relative to the number of training samples in the datasets [4][6][7]. Most of the genes are not relevant to the
distinction between different tissue types (classes) and introduce noise in the classification process [8].
The problem of feature (gene) selection can be defined as the task for selecting subsets of features that maximizes the classifier ability to classify samples [9][10]. Gene selection methods can be classified into two categories. If gene selection is carrying out independently from the classification procedure, the method is said to follow a filter approach. Otherwise, it is said to follow a wrapper approach [4][6][11]. Most of previous works used filter approach to select gene since it is computationally more efficient than the wrapper approach [6][8][12][13]. However, wrapper approach usually provide better accuracy than filter schemes [6][11][14]. The application of wrapper approach using Genetic Algorithm (GA) with classifier has grown in recent year [12]14]. From previous works, the GA performs well but only supports the data ranged from small to medium features [8][11][14][15]. Moreover, GA is also generally quite effective for rapid global search of large search spaces in optimization problems [10].
(GASVM) for gene selection and classification. The filter approaches are Information Gain (IG) and ReliefF Algorithm (RA) that will be used to select genes from the whole gene expression data and provide a subset of genes that can be used by the GA wrapper.
The flow of this paper starts with Section 1 and Section 2 that describe the introduction and related works respectively. We introduce the method for gene selection and gene classification in Section 3. Section 4 introduces the proposed approach. In Section 5, we analyze and discuss the experimental results on two widely used gene expression benchmark data sets. We conclude this work in Section 6.
2. Related work
Usually, filter method uses measurement such as intrinsic properties of the data, probabilistic distance measures, probabilistic dependence measures, interclass distance measures and information theoretic measures [4][17]. The features or genes with the highest scores are selected as top features. The Signal to Noise Ratio [18], TNoM score [5], Cosine Coefficient, Information Gain and Euclidean Distance [13] are some of the widely known as filter approach and applied on gene expression data.
The gene selection methods belong to the filter approach such as Information Gain [13] and ReliefF Algorithm [22] have been successfully applied to gene selection problem. GA has also been applied to several feature selection problems. A hybrid of GA and Neural Network classifier [10[11], incorporating GA and SVM classifier [19][20] and combining GA via Weight Voting classifier [14] are some of the widely known as GA wrapper approach. Zhang et al., [10] have classified
microcalcification data in digital mammograms. The experiments reported in the Yang and Hanovar [11] used a wide range of real world data sets such as document and artificial data sets from machine learning data repository at the University of California. Eads et al., [19] have classified the time series data set, while Sepulveda-Sanchis et al., [20] have predicted the unstable angina data set. Only Liu et al., [14] used gene expression data sets for their research. The data sets are Leukemia Cancer and Colon Cancer.
3. Method for gene selection and gene
classification
Among thousands of genes whose expression levels are measured, not all are needed for the classification. We need to select some genes highly related with particular classes for classification, which is called informative genes [18]. This process is referred as to gene selection.
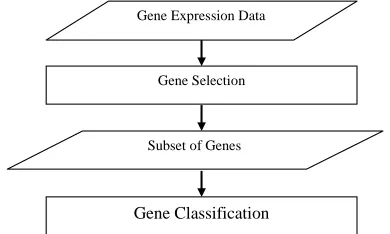
General process of classification is to train classifier by using training samples and then classify testing samples with the trained classifier. Usually, gene expression classification model has two stages: gene selection and gene classification stages [13][15]. Figure 1 shows this model which exhibits a classification stage that includes training and testing phases.
Gene Classification
Gene Expression Data
Gene Selection
Subset of Genes
Figure 1. Gene expression classification model
3.1. Filter approach and Genetic Algorithm wrapper approach for gene selection
Suppose that we have a gene expression pattern (i =
1 ~ 7129 in Leukemia data, i = 1 ~ 2000 in Colon data). Each is a vector of gene expression levels from N samples, . If the number of genes excited or not excited in category were
counted, the coefficient of the information gain becomes as follow [13][15]
i g i g ) ,..., , (1 2 N
i e e e
g =
)) (
(P gi ( ( ))
_
i
g
P (cjP(cj))
) _ ( ) ( ) , _ ( log ) , _ ( ) ( ) ( ) , ( log ) , ( ) , ( i g P j c P j c i g P j c i g P i g P j c P j c i g P j c i g P j c i g IG ⋅ + ⋅
= (1)
RA method has shown good performance in various applications such as medical and ecology [21]. The basic idea of this method is to draw instances at random, compute their nearest neighbors and adjust a gene weighting vector to give more weight of genes that discriminate the instance from neighbors of different classes. Specifically, it tries to find a good estimate of the following probability in order to assign a weight for each gene [22]
=
i g
w
P(different value of | different class) –P(different value of | same class) (2)
i
g
i
g
A detailed of GA wrapper approach (GASVM) and improved GASVM (NewGASVM) can be found in [23] and [24].
Research in this paper proposed a model of gene expression classification by using filter approach and NewGASVM.
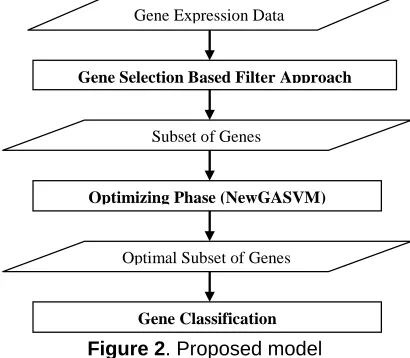
Previous works have used a gene expression classification model as shown in Figure 1 and only has 2 stages. In our approach, the model has 3 stages: gene selection, gene optimization and gene classification stages. Figure 2 shows our proposed model.
Figure 2. Proposed model
Gene selection stage removes irrelevant genes using filter approach such as IG and RA. Moreover, ranking genes by filter approach does present an overall pattern of gene expression data. It is therefore, a nice starting point for the data analysis [6]. As a result, this stage produces a small subset of genes. The optimization stage selects and optimizes subset of genes from the small subset by using NewGASVM. GASVM can also be used in this optimization stage. If the subset is small, the combinatorial of genes will not be complex and further on the NewGASVM can find easily the optimized subset. Moreover, the NewGASVM could also avoid the risk of achieving the optimal solution in local minima because the filter approach had reduced the size and complexity of searching space. Thus, the NewGASVM is more efficient using the small subset and does not need more time to complete its task. Lastly, classification stage builds SVM classifier using optimal subset of training set and tests it using testing set.
5. Experimental results
We have used two benchmark data sets to evaluate our model. These data sets are Leukemia Cancer and Colon Cancer. For Leukemia Cancer data set, we used a leave one out cross validation (LOOCV) procedure on training data and accuracy test measurement on testing data to measure classification accuracy. For Colon Cancer data set, we used the LOOCV procedure because this data set only has training data. All experiments reported in this
work had been implemented using Redhat Enterprise Linux AS release 3.2 on 1.8 GHz Athlon SMP CPUs with 2 GB of memory.
5.1. Data sets
Leukemia Cancer data set contains examples of human acute leukemia, originally analyzed by Golub et al. [18] This data set containing expression levels of 7129 genes and can be obtained at http://genome.wi.mit.edu/mpr. Training data consists of 38 samples and the remaining 34 samples were used as testing data. Colon Cancer data set contains expression levels of 2000 genes from 40 tumor and 22 normal colon tissues. The data set has only 62 samples for training data, originally analyzed by Alon et
al. [25] and downoaded from
http://microarray.princeton.edu/oncology/.
Optimizing Phase (NewGASVM) Gene Expression Data
Optimal Subset of Genes Gene Selection Based Filter Approach
Subset of Genes
Gene Classification
5.2. Experimental Environment
Our experiments were conducted by using six methods obtained from combination of GASVM, NewGASVM and filter approaches (IG and RA). Firstly, we applied GASVM and NewGASVM methods following stages as shown in Figure 1. Furthermore, by following the stages in the Figure 2 we obtained four methods; namely: IG+GASVM, RA+GASVM, IG+NewGASVM and RA+NewGASVM. We applied the filter approaches to select 100 genes from the whole of genes. Experiments are conducted 10 times and analyzed on the average bases of the results. The methods based on NewGASVM were experimented by using 5, 10, 20, 30, 40, 50, 60, 70, 80 and 90 genes to choose the optimal or the best subset of genes. However, methods based on GASVM such as GASVM, IG+GASVM and RA+GASVM did not experimented using the varied numbers of selected genes because it unable to fix the selections.
5.3. Result analysis and discussion
Two criteria were considered to evaluate the performances of the six methods. The criteria are:
• LOOCV and test accuracies • Running time
5.3.1. LOOCV and test accuracy
application of a filter and wrapper approach in proposed model of gene expression classification. These figures also indicates that the accuracy depended on the number of selected genes.
Figure 3: The change of LOOCV accuracy with respect to the number of selected genes from Leukemia Cancer data set (10 runs on average).
Figure 4. The change of test accuracy with respect to the number of selected genes from Leukemia Cancer data set (10 runs on average).
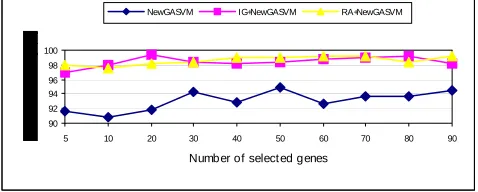
The performances of NewGASVM, IG+NewGASVM and RA+NewGASVM methods for classifying Colon Cancer samples that have shown in Figure 5 are comparable. However, the selection of 5 genes only by using RA+NewGASVM method has achieved the best result at 86.29% LOOCV accuracy. The highest accuracies of the NewGASVM and IG+NewGASVM methods achieved 82.58 % and 85.65% respectively. Hence, applying the filter approach with NewGASVM improved the accuracy by removing irrelevant genes from whole genes and optimizing the remaining genes.
Figure 5. The change of LOOCV with respect to the number of selected genes from Colon Cancer data set (10 runs on average).
Table 1 shows the highest accuracy of the six methods. In general, GASVM and NewGASVM methods produced poor result in both of the data sets. When a
filter approach was applied before the methods, the results were improved. However, the methods that applied filter approaches with NewGASVM are better than the methods that applied filter approaches with GASVM.
90 92 94 96 98 100
5 10 20 30 40 50 60 70 80 90
Number of select ed genes
NewGASVM IG+NewGASVM RA+NewGASVM
Table 1. The benchmark of the highest classification accuracies on Leukemia and Colon Cancer data sets (10 runs on average).
Leukemia Cancer Data Set
Colon Cancer Data Set Method
LOOCV Test LOOCV
GASVM 94.74 83.53 83.10
IG+GASVM 98.95 93.53 77.58
RA+GASVM 97.63 91.76 83.39
NewGASVM 95.00 80.59 82.58
IG+NewGASVM 99.47 94.71 85.65
RA+NewGASVM 99.21 94.12 86.29
70 75 80 85 90 95 100
5 10 20 30 40 50 60 70 80 90
Number of selected genes
T
e
s
t Ac
cu
racy
(%
)
NewGASVM IG+NewGASVM RA+NewGASVM
76 78 80 82 84 86 88
5 10 20 30 40 50 60 70 80 90
Number of selected genes
LOOCV accuracy (%)
NewGASVM NewGASVM+IG NewGASVM+Rel
The highest accuracy of the IG+NewGASVM method achieved 99.47% and 94.71% for LOOCV and test accuracies respectively using selected 20 genes in Leukemia Cancer data set. On the other hand, the original works of Golub et al., [18] and Slonim et al., [27] required about 50 genes to achieve the 94.74% for LOOCV accuracy and 85.29% for test accuracy. Liu et al., [14] were also applied the wrapper approach using a hybrid of parallel GA and Weight Voting classifier (GAWV). The GAWV method produced only 94.74% and 88.24% accuracy for LOOCV and test accuracies respectively using selected 29 genes. However the experiment requires recurring experiment of the hybrid method to achieve an optimal subset. Nevertheless, the result is still less than others because this method is used the original chromosome representation which is only suitable for data with small or medium features.
The highest accuracy of the RA+NewGASVM method achieved 86.29% using selected 5 genes and performed better than Ben-Dor et al., [5] work for classifying Colon Cancer samples. The previous work used SVM, Nearest Neighbor and Ada-Boost classifiers had achieved only less than 81% accuracy using the whole genes. This is possibly due to the most of the genes were not relevant and introduced noise in the classification process.
the ability to search and evaluate all possible gene subsets due to the small subset produced by filter approach. However, their performance is less than the methods that used a filter approach with NewGASVM method due to the method’s inability to fix the number of selected genes.
5.3.2. Running time
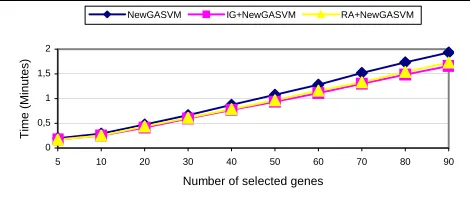
The results in Figures 6 and 7 demonstrate that it is possible to achieve almost linear execution times with NewGASVM, IG+NewGASVM and RA+NewGASVM methods for classifying Leukemia Cancer and Colon Cancer data sets, respectively. The execution times for IG+NewGASVM and RA+NewGASVM methods are almost similar and better than NewGASVM method because the filter approach (IG or RA) was applied before optimization phase. It can be observed that the running time depended on the number of selected genes that were involved in a classification method.
Figure 6:The change of times with respect to the number of selected genes from Leukemia Cancer data set (10 runs on average).
Figure 7:The change of times with respect to the number of selected genes from Colon Cancer data set (10 runs on average).
Generally, Table 2 shows that the application of a filter approach with NewGASVM method took less execution time if compared with other methods. Morevor, the method based on NewGASVM was better than method that belonged to GASVM.
Table 2. The comparison of the best execution times on the both data sets (10 runs on average).
Leukemia Cancer Data Set Colon Cancer Data Set
Method
Time
(minutes) Method
Time (minutes)
GASVM 131.47 GASVM 6.08 IG+GASVM 0.60 IG+GASVM 0.24 RA+GASVM 0.60 RA+GASVM 0.23 NewGASVM 0.12 NewGASVM 0.20 IG+NewGASVM 0.11 IG+NewGASVM 0.18 RA+NewGASVM 0.11 RA+NewGASVM 0.17
The NewGASVM method took less running time because it could reduce the combinatorial problem and complexity of searching space by fixing the number of selected genes during gene selection and classification tasks. When a filter approach was applied with the NewGASVM or GASVM method, it can also reduce the time by selecting and reducing the number of candidate genes from whole genes before optimization phase. On the other hand, the GASVM method needed more execution time due to the inability of the chromosome representation to fix the selected genes. Furthermore, it was impossible to search at all feature spaces and evaluate all possible gene subsets on the data sets.
0 0,2 0,4 0,6 0,8 1 1,2 1,4
5 10 20 30 40 50 60 70 80 90
Number of selected genes
Time
(min
u
te
s)
NewGASVM IG+NewGASVM RA+NewGASVM
6. Conclusion
In this paper, we have investigated and solved the important issues of selection a small subset of genes from thousands of gene measured on microarray that are inherently noisy. We have designed and applied a new model of gene expression classification by using filter approach with New-GASVM.
Generally, IG+NewGASVM and RA+NewGASVM methods achieved high LOOCV and test accuracies, and performed better than other methods because the filter approach was applied before optimization phase. The filter approach can produce a small subset of genes. Hence, the methods will be more efficient to produce the optimized subset of genes by using the small subset that is produced from the filter approach. The methods also took less running time because the small number of selected genes during gene selection and classification tasks could be fixed in order to reduce complexity of combinatorial problem. When a filter approach was applied, it can also reduce the time by selecting and reducing the number of candidate genes from whole genes before applying NewGASVM method. Focusing attention on a small subset of genes is useful not only because it produces the methods with good generalization capacity, but also because this subset take less execution time.
0 0,5 1 1,5 2
5 10 20 30 40 50 60 70 80 90
Number of selected genes
Time
(Min
u
te
s
)
NewGASVM IG+NewGASVM RA+NewGASVM
We are currently studying danger theory for computational system to estimate danger (cancer) susceptibility of genes like proposed by Iqbal and Maarof [28].
Acknowledgements
Ministry of Science, Technology and Environments (MOSTE).
7. References
[1]D.J. Lockhart, E. Winzeler, “Genomics, gene expression and DNA arrays”, Nature Insight, 2000, Vol. 405, pp. 827-836. [2] H. Bannai, S. Inenaga, A. Shinohara, M. Takeda, S. Miyano, “Efficiently finding regulatory elements using correlation with gene expression”, Journal of Bioinformatics & Computational Biology, 2004, Vol. 2(2), pp.173-288.
[3] T. Aittokallio, M. Kurki, O. Nevalainen, T. Nikula, A. West, R. Lahesmaa, “Computational strategies for analyzing data in gene expression microarray experiments”, Journal of Bioinformatics & Computational Biology, 2003, Vol. 1(3), pp. 541-586.
[4] I. Inza, P. Larranaga, R. Blanco, A.J. Cerrolaza, “Filter versus wrapper gene selection approaches in DNA microarray domains”, Journal of Artificial Intelligent in Medicine, 2004, Vol. 31, pp. 91-103.
[5] A. Ben-Dor, L. Bruhn, N. Friedman, I.M. Schummer, Z. Yakhini, “Tissue classification with gene expression profiles”,
Journal of Computational Biology, 2000, Vol. 7, pp. 559-584. [6] Y. Wang, I.V. Tetko, M.A. Hall, E. Frank, A. Facius, K.F. Mayer, H.W. Mewes, “Gene selection from microarray data for cancer classification – a machine learning approach”, Journal of Computational Biology & Chemistry, 2005, Vol.29, pp. 37-46. [7] M. Soukup, J.K. Lee, “Developing optimal prediction models for cancer classification using gene expression data”,
Journal of Bioinformatics & Computational Biology, 2004, Vol. 1(4), pp. 681-694.
[8] C. Ding, H. Peng, “Minimum redundancy feature selection from microarray gene expression data”, Journal of Bioinformatics & Computational Biology. 2005, Vol. 3(2), pp.185-205.
[9] J. Bins, B.A. Draper, “Feature selection from huge feature sets”, Proceeding of the International Conference on Computer Vision, 2001, Vol. 2, pp. 159-165..
[10] P. Zhang, B. Verma, K. Kumar, “Neural vs. statistical classifier in conjunction with genetic algorithm based feature selection”, Journal of Pattern Recognition Letters, 2005, Vol. 26, pp. 909-919.
[11] J. Yang, V. Hanovar, “Feature subset selection using genetic algorithm”, IEEE Intelligent System, 1998, Vol. 13, pp. 44-49.
[12] M.S. Mohamad, S. Deris, “Feature selection method using genetic algorithm for the classification of small and high dimension data”, Proceeding of the 1st International Symposium on Information and Communication Technology, 2004, pp. 13-16.
[13] S.B. Cho, H.H. Won, “Machine learning in DNA microarray analysis for cancer classification”, Proceeding of the 1st Asia-Pacific Conference on Bioinformatics, 2003, pp. 189-198.
[14] J. Liu, H. Iba, M. Ishizuka, “Selecting informative genes with parallel genetic algorithms in tissue classification”,
Genome Informatics, 2001, Vol. 12, pp.14-23.
[15] J. Ryu, S.B. Cho, “Toward optimal feature classifier for gene expression classification of cancer”, Advances in Soft
Computing – International Conference on Fuzzy System, 2002, Vol. 2275, pp. 310-317.
[16] B. Krishnapuram, L. Carin, A.J. Hartemink, “Joint classifier and feature optimization for comprehensive cancer diagnosis using gene expression data”, Journal of Computational Biology, 2004, Vol. 11(2-3), pp. 27-242.
[17] J. Doak, “An evaluation of feature selection methods and their application to computer security”, Technical Report, University of California at Davis, CA, 1992.
[18] T.R. Golub, D.K. Slonim, P. Tomayo, C. Huard, M. Gaasenbeek, J.P. Mesirov, H. Coller, M.L. Loh, J.R. Downing, M.A. Caligiuri, C.D. Bloofield, E.S. Lander, “Molecular classification of cancer: Class discovery and class prediction by gene expression monitoring”, Science, 1999, Vol. 286, pp. 531-537.
[19] D. Eads, D. Hill, S. Davis, S. Perkins, J. Ma, R. Porter, J. Theiler, “Genetic algorithms and support vector machines for time series classification”, Proceeding of the 5th International Conference on Apply Science, Neural Network, Fuzzy System & Evolutionary Computational, 2002, pp. 74-85.
[20] J. Sepulveda-Sanchis, G. Camps-Valls, E. Soria-Olivas, S. Salcedo-Sanz, C. Bousono-Calzon, G. Sanz-Romero, J. Marrugat, “Support vector machines and genetic algorithms for detecting unstable angina”, Computers in Cardiology, IEEE Computer Society Press, Menphis, USA, 2002.
[21] M.R. Sikonja, I. Kononenko, “Theoretical and empirical analysis of ReliefF and RreliefF”, 2003, Machine Learning,
Vol. 53(1-2), pp. 23-69.
[22] Y. Wang, F. Makedon, “Application of Relief-F feature filtering algorithm to selecting informative genes for cancer classification using microarray data”, IEEE Computational System Bioinformatics Conference, 2004, pp. 497-498.
[23] M.S. Mohamad, S. Deris, R.M. Illias, “A hybrid of genetic algorithm and support vector machine for features selection and classification of gene expression microarray”, International Journal on Computational Intelligent and Applications. 2005, Vol 5(1), pp. 1-17.
[24] M.S. Mohamad, A Hybrid of Genetic Algorithm and Support Vector Machine Classifier for Feature Selection and Classification of Gene Expression. Faculty of Science Computer and Information System, Universiti Teknologi Malaysia, Master Thesis, 2005.
[25] U. Alon, N. Barkai, D. Notterman, K. Gish, S. Ybarra, D. Mack, A.J. Levine, “Broad patterns of gene expression revealed by clustering analysis of tumor and normal colon tissues probed by oligonucleotide array”, Proceeding of the National Academic Sciences, 1999, Vol. 96, pp. 6745-6750.
[26] Z. Michalewicz, M. Schoenauer, “Evolutionary Algorithms for Constrained Parameter Optimization Problems”, Journal of Evolutionary Computational, 1996, Vol. 4(1), pp. 1-32.