Ultimate Pressure Capacity of ACR
©Containment With Different Concrete Models
Ahmed Awad, Ayman Saudy, and Medhat Elgohary
Atomic Energy of Canada Limited, 2251 Speakman Drive, Mississauga, Ontario, Canada L5K 1B2
ABSTRACT
The Advanced CANDU Reactor (ACR)© is developed by Atomic Energy of Canada Limited (AECL) to be the next step in the evolution of the CANDU product line. It is based on the proven CANDU technology and incorporates advanced design technologies.
The containment structure is an essential element of the overall defence in depth approach to reactor safety, and is a physical barrier against the release of radioactive material to the environment. Therefore, it is important to provide a robust design with an adequate margin of safety. The containment design pressure envelops the postulated accident pressure following any design basis accident including loss of coolant accidents and main steam line breaks.
The ACR containment structure consists of reinforced concrete basemat and post-tensioned concrete cylindrical wall and dome. A steel liner is placed on the inside surface of the basemat, the wall and the dome and is physically connected to these structural elements.
A concrete structure with reinforcing steel and post-tension tendons behaves in a highly non-linear manner, when subjected to loads above its design loads, and exhibits a complex response as cracks initiate and propagate. Therefore, detailed idealization of the prestressed concrete structure is needed to accurately predict its ultimate pressure capacity.
This paper investigates the effects of the adopted concrete material plasticity model and the contribution of the steel liner elasto-plastic stiffness on the ultimate pressure capacity of the ACR containment structure. A three-dimensional finite element model of the containment structure is developed such that its structural characteristics are idealized. Two plasticity concrete material models are investigated. Elasto-plastic plasticity models are used for the reinforcing bars, steel liner and post-tension tendons. Variability in yielding strength of steel liner material model is studied.
INTRODUCTION
The ACR containment structure, Figure 1, consists of reinforced concrete basemat and post-tensioned concrete cylindrical wall and dome. A steel liner is placed on the inside surface of the basemat, the wall and the dome and is physically connected to these structural elements. The containment structure is conservatively designed for an internal pressure of 450 kPa. This design pressure envelops the postulated accident pressure following any design basis accident including loss of coolant accidents and main steam line breaks. One of the key design requirements of the containment structure is to have an ultimate pressure capacity that is at least twice the design pressure; i.e. 900 kPa.
The ultimate pressure capacity of the containment structure is evaluated using finite element analyses. A three-dimensional finite element model of the containment structure is developed such that its structural characteristics are idealized. In developing the finite element model, considerations for the details of the containment structure and the joint to the basemat, in addition to location and weight of major equipment such as the reserve water tank, are made. Two plasticity concrete material models are used for the concrete elements of the model and elasto-plastic plasticity models are used for the reinforcing bars and post-tension tendons. The structural response of the containment structure at different stages of a monotonically applied internal pressure is determined. The failure criteria for different materials of the containment structure are applied and the ultimate pressure capacity of the containment is evaluated.
FINITE ELEMENT MODEL
The analysis of the ultimate pressure capacity for the containment structure is carried out using a 5°-sector finite element model. The effects due to the presence of the openings and the buttresses in the containment structure are not considered in this model. Figure 2 shows a 3D view of the complete finite element sector model. The model consists of the containment shell, the internal structure, the basemat, the reinforcement layers, the pre-stressing tendons, and the steel liner. Generally, ten elements are defined across the thickness of containment shell. Figure 3 shows the locations of the reinforcement layers and pre-stressing tendons within the containment wall thickness.
ANSYS and LS-DYNA finite element analysis programs are used. ANSYS employs implicit solution and LS-DYNA is an explicit solution based program. Two models and analyses are produced for verification and comparison purposes.
Geometry Model
A detailed finite element analysis is developed to idealize the geometry and different parts of the containment structure. The finite element model includes the containment shell, the reinforcing steel, the prestressing tendons, and the steel liner.
Containment Shell
SOLID65 of the ANSYS element library is used to model the concrete containment structure. SOLID65 is an 8-node 3D structural solid with three degrees of freedom at each node. This solid element is capable of cracking in tension and crushing in compression. Five elements are used along the circumferential (hoop) direction of the dome, wall and base slab. Ten elements are used across the thickness of the dome, wall and base slab. Finer mesh sizes are specified at the wall/base slab joint where stress and strain concentrations are anticipated. The same concrete solid mesh is used with LS-DYNA model with material type 84 known as Winfrith concrete model.
SOLID45 of the ANSYS element library is used to model the concrete internal structure. SOLID45 is an 8-node 3D structural solid with three degrees of freedom at each node. The internal structure is modeled as a sector of a cylinder of equivalent mass and stiffness. The mass of the internal structure is used to determine the density of the material used for the idealized cylinder. The internal structure is not included in LS-DYNA model.
Steel Reinforcement
SHELL43 of the ANSYS element library is used to model the reinforcement layers. SHELL43 is 4-node plastic large strain shell element with six degrees of freedom at each node. The shell elements used for the reinforcement layers and the solid elements used for the concrete share the same nodes.
Hoop and meridian reinforcements are not identical in the containment wall. Therefore, double shell elements overlying each other are modeled in the wall to represent the steel reinforcements in both directions. Both shell elements are sharing the same nodes with the concrete elements. The shell elements identified for the wall hoop reinforcement are assigned a very small value for the modulus of elasticity in the meridian direction and the shell elements identified for the meridian reinforcement are assigned a very small value for the modulus of elasticity in the hoop direction.
For LS-DYNA model, truss elements are used to model the hoop and meridianal reinforcements in the wall. Shell elements are used to model the reinforcement in the dome. The truss and the shell elements share the same nodes with concrete elements.
Prestressing Tendons
Two sets of pre-stressing tendons are used for the containment shell. The first set is vertical inverted U-shape tendons that are equally spaced around the circumference of the containment wall. The second set is hoop tendons that start at 2.40m above the base and end at approximately half the height of the dome. Generally, the containment shell is covered with two perpendicular layers of pre-stressing tendons except at four regions in the dome where there are three layers of pre-stressing tendons; two layers of vertical tendons and one layer of hoop tendons.
LINK8 of the ANSYS element library, a uni-axial tension-compression, is used to model the hoop tendons. SHELL43 is used to model the vertical tendons. However, an orthotropic material with very small modulus in the hoop direction is specified for the shell elements modelling the vertical tendons in the wall. In the dome, an isotropic material is defined to force the shell element modelling the vertical tendons to act in the hoop and vertical (meridian) directions.
The shell elements modeling the tendons do not share the same nodes with the concrete elements but they are coincident. Coupling between the tendons nodes and the corresponding coincident concrete nodes are established in such a way that the tendons are allowed to slide in the meridian direction for both the dome and the wall. The wall hoop tendons elements share the same nodes with the concrete elements.
For LS-DYNA model, truss elements are used to model the hoop and meridianal tendons in the wall. Shell elements are used to model the tendons in the dome. The vertical tendons truss elements in the wall and dome shell elements, representing the dome tendons, do not share the same nodes with concrete elements. Meridional sliding is allowed. The wall hoop tendons elements share the same nodes with the concrete elements.
Steel Liner
Shell elements are used to model the steel liner for both the ANSYS and LS-DYNA models. The steel liner is 6 mm plate and is stiffened by meridian and hoop stiffeners. To account for the effect of the stiffeners, an assumed equivalent thickness of 12 mm is assigned to the liner elements. The liner elements share the same nodes with concrete.
Boundary Conditions
The boundary conditions for the finite element model are consistent with the symmetry assumption of the loads to be applied to the model. Gravity load, pre-stressing load, and the internal pressure load are considered axi-symmetric with
respect to the model geometry. Therefore, symmetric boundary conditions are used at all nodes located on the two radial planes. All nodes on the bottom surface of the base slab are restrained in the three global directions.
Material Properties
The material models for concrete, steel reinforcements (rebars), post-tensioned pre-stressing tendons and steel liner are defined using different material models in ANSYS and LS-DYNA.
Concrete Material Model
ANSYS uses the five-point William and Wranke failure criterion, Reference [1]. Figure 4 shows the biaxial concrete failure criterion. The parameters defining the failure criterion are presented in Table 2. The two parameters for the compressive strengths f1 and f2 are consistent with the condition for the hydrostatic stress all nodes. LS-DYNA concrete
material model used in the analysis is material type 84 known as Winfrith concrete model. The Winfrith concrete model is a smeared crack, smeared rebar model, implemented in the 8-node single integration point continuum element. The model is developed in Reference [2].
Reinforcement and Prestressing Tendon Material Model
The reinforcing steel and prestressing tendons are assumed to be elasto-plastic material. Bilinear Kinematic Hardening (BKIN) material model is used in the analysis. The values used for the steel reinforcement and prestressing tendons modelling are presented in Table 3.
Steel Liner Material Model
The liner steel is assumed to be elastic-plastic material. Bilinear Kinematic Hardening (BKIN) material model was used to model the liner steel. Values used for modelling the liner steel material are shown in Table 3. Two analyses are carried out for two different values of the steel liner yield strength: 260 and 400 kPa.
LOADING
The finite element model of the containment structure is subjected to three loading conditions. The loading conditions include the effects of the weight of the reactor building, the pre-stressing load, and the internal pressure. The dead load and the pre-stressing load are applied in one load step. The internal pressure load is applied to the inside surface of the model in many load increments.
The gravitational acceleration is applied to the whole model in the axial direction statically for both ANSYS and LS-DYNA Models. By applying a differential temperature on the elements representing the vertical and hoop tendons, the forces in the tendons are developed, and consequently, compressive stresses in the containment shell are developed.
The inside faces of the elements representing the steel liner are loaded with a uniform pressure. The internal pressure load is applied incrementally up to the maximum pressure, which is set at more than three times the design pressure. For ANSYS model, the pressure load is applies statically. The automatic time-stepping feature of ANSYS is invoked to march to a solution at each load increment. For LS-DYNA model, implicit static solution is employed for the first four seconds and then switched to explicit dynamic solution for the rest of the analysis. The four second load the concrete structure just below the general major cracking in the hoop direction of the wall. The pressure load is applied on total time of 10 seconds.
The radial degree of freedom at a node located at half the height of the containment wall is selected to monitor the solution progress. The selection is made based on numerous test runs indicating the location of maximum deformation.
RESULTS
Figures 5 and 6 show the deformed shape of the containment structure at different loading increments of the analysis for ANSYS and LS-DYNA. Figure 7 shows the principle plastic strain of the concrete elements at different loading increments produced by ANSYS. The plastic strain indicates the zones where concrete cracks have occurred. Figure 8 shows the cracks developed in the concrete for four major milestones produced by LS-DYNA.
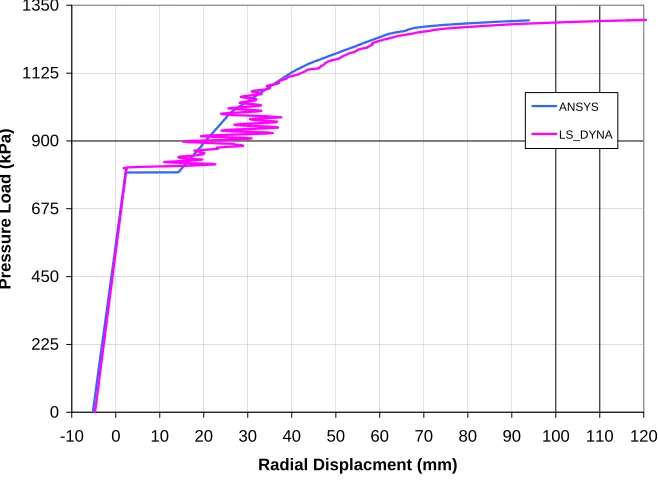
A load-displacement curve is presented in Figure 9. The load variable represents the internal pressure and the displacement variable represents monitored radial displacement at mid-wall height. The load-displacement curve indicates a linear response up to a pressure of 796 kPa for ANSYS and 812 kPa for LS-DYNA. This small difference is due to the difference in concrete model used by each program. This pressure level is about 1.8 times the design pressure. Beyond this pressure level, the deformation abruptly increases with a marginal pressure increase indicating that the structure is softening; i.e. cracking. In fact, major degradation of the structure stiffness due to major hoop cracking has already taken place. At pressure level of about 800 to 820 kPa, an increase in the stiffness is observed. After the major hoop cracking occurred and the rapid degradation of stiffness, the loads carried by the concrete started to transfer to the prestressing tendons and the reinforcement steel. This explains the increase of the stiffness after the hoop cracking. It is also noted that LS-DYNA reported the dynamic effect resulted from the rapid hoop cracking in the model. This explains difference in the response
between LS-DYNA and ANSYS starting at the hoop crack pressure (796 to 812 kPa) up to 1080 kPa. Beyond this region, LS-DYNA and ANSYS responses are matched very closely. The analyses are stopped at a pressure level of 1300 kPa for ANSYS and 1750 kPa for LS-DYNA where cracking has spread over almost the whole structure, refer to Figures 7 and 8. It is also noted that although ANSYS and LS-DYNA employ different concrete material model, the results are in an excellent agreement.
The analysis proceeded to a pressure level that is high enough to cause yielding in the steel liner and rebar and also in the wall hoop tendons in addition to the full structural degradation of the concrete containment. Table 4 summarizes the results of the ultimate pressure capacity analysis. It lists the pressure levels at which important stages in the containment structure behaviour occur during the internal pressure load history, such as the first cracking of pre-stressed concrete containment, first yielding of rebar, pre-stressing tendons, and/or steel liner. The ratios of these pressure levels to the containment design pressure are provided as well.
The containment structure behaves generally within the elastic range for a pressure up to 1.75 times the design pressure. No yielding in the steel liner or in the steel reinforcement is expected before the internal pressure load exceeds twice the design pressure. The ultimate pressure capacity is expected to exceed 1300 kPa, which is about 2.89 times the design pressure.
Non-linear Behaviour of Structural Elements
The first crack in the model occurs at a pressure level of 635 kPa and is located at the inside surface of the wall at the wall/basemat joint. Only one element is cracked at this pressure level and this crack takes place in the radial, meridian and hoop directions.
At a pressure level of 796 kPa, cracking starts at the wall mid-height. The cracking in this region occurs across the whole thickness of wall and takes place mostly in the hoop direction. The first crack in the dome takes place at pressure level of 796 kPa, as well, and is located at the inside surface at spring line. Few dome elements are cracked at this location and this cracking takes place in the radial, meridian and hoop directions.
At pressure level of 1260 kPa, all elements of the wall are cracked in the radial, meridian and hoop directions. At the same pressure level, the cracking in the dome extends beyond the spring line location towards the dome apex. By the end of the analysis, in addition to fully cracked elements of the wall, all dome elements are cracked in the radial, meridian and hoop directions. The steel liner started to yield in the hoop direction at pressure of 980 kPa at a point 10.60m above the base slab.
The wall hoop tendons started to yield at a pressure of 1275 kPa. At a pressure of 1300 kPa, the maximum elastic and plastic strain equal to 0.86% and 0.139%, respectively. Based on LS-DYNA results, the vertical tendons yielded at pressure of 1600 kPa. The inside face layer of the wall hoop steel reinforcement started to yield at pressure level of 1122 kPa at a point 10.60m above the base slab. The outside face layer started to yield at a pressure level of 1138 kPa. The inside layer of the wall meridian steel reinforcement started to yield at a pressure level of 1218 kPa at very localized region at the wall/basemat joint.
Discussion
The failure of the containment structure is defined and monitored when strain responses of individual structural element (i.e. liner, reinforcement and tendons) exceed specified strain limits. These strain limits are less than the nominal and test ultimate strain for the structural elements of the containment. Table 5 summarizes the specified strain limits, the attained strain responses at pressure load of 1300 kPa, and the calculated capacity factor (i.e., strain limit/strain response due to pressure).
The yielding of the hoop tendons in the containment wall governs the ultimate pressure capacity analysis for the containment as reposted previously in Reference [3] and confirmed in this paper using LS_DYNA model. This failure mode is common and is reported as the governing failure mode for past analyses performed for pre-stressed concrete containments structures, References [4] and [5].
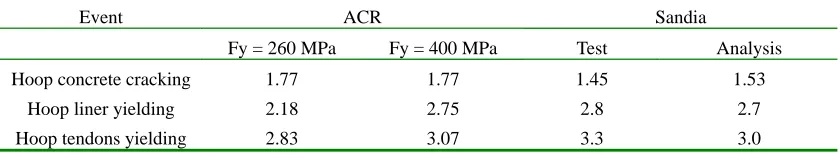
In 2000, a ¼ scale PCCV model was tested in Sandia National Laboratories to assess the over-pressurization of pre-stressed concrete containments. Pre- and post-test analyses were conducted to predict and investigate the containment behaviour during the test, References [6], [7] and [8]. A comparison between the reported containment behaviour of the PCCV model and the results of the ACR ultimate pressure capacity analysis is made and presented in Table 6 and Figure 10. Table 6 presents the ratio of the pressure attained at important stages to the design pressure for the ACR containment with 260 MPa and 400 MPa steel liner yield strength in addition to Sandia test and analysis results. Figure 10 illustrates the steel liner strain at the containment wall mid-height during the internal pressure load history normalized to the design pressure for both the ACR and the ¼ scale PCCV. The ACR containment overall behaviour and comparison with Sandia test results are reported, in Figure 10, for the two analyses carried out based on the two values of steel liner yield; i.e. 260 and 400 kPa. It should be mentioned that the yield strength of the steel liner for the PCCV model and analysis is 400 kPa.
A very close agreement is found between the predicted behaviour of the ACR containment structure and that established for the PCCV model under internal pressure. The close agreement is found primarily in the plastic behaviour of the steel liner, steel reinforcement and the hoop tendons. A sudden degradation of the containment structure due to the concrete hoop cracking is observed while a rather smoother transition is observed in the PCCV case. This finding is attributed to the concrete material constitutive models used in both analyses. Despite the different concrete models, the overall behaviour of the ACR containment closely matches that of the PCCV. Also an excellent agreement between results produced by implicit solution based program and explicit solution based program, ANSYS and LS-DYNA.
Both the explicit and implicit solutions help in understanding the behavior of concrete containment past cracking, crushing and yielding of different elements. Explicit solution by LS-DYNA is able to capture the behavior and proceed with the analysis further than the implicit solution. Explicit solution by LS-DYNA provides a quite speedy solution in comparison with that of the implicit solution.
SUMMARY AND CONCLUSIONS
In this study, detailed non-linear analyses of the ACR containment structure are performed to evaluate its ultimate pressure capacity. A sector finite element model of the containment structure is developed including steel reinforcement, pre-stressing steel, and the steel liner. Provisions are made to account for the interaction with the concrete internal structures. Non-linear analyses are carried out with applicable loadings taking into account the sequence of load application. Analyses are performed for fixed base condition using implicit and explicit solutions. The concrete material model used in the implicit solution is different from that used in the explicit solution. The containment is loaded with internal pressure in steps to capture the significant changes of the containment stiffness due to concrete cracking, yielding of reinforcement, pre-stressing tendons, and the steel liner.
The analyses conclude that the containment can sustain an internal pressure 1300 kPa, which is about three times the design pressure. Therefore, the design of the ACR containment structure provides a significant margin of safety against failure due to any potential accident in the containment. This margin provides for significant protection level to the public.
REFERENCES
1 . Willam, K. and Warnke, E.P. “Constitutive Model for the Triaxial Behavior of Concrete”, International Association of
Bridge and Structural Engineering Seminar on Concrete Structures Subjected to Triaxial Stresses, ISMES, Bergamo,
May 17-18, 1974, publ. in Proc. IABSE Report 19, Zurich, 1975, III-I, pp. 1-30.
2 . Broadhouse, B.J., “The Winfrith Concrete Model in LS-DYNA3D”, Report: SPD/D(95)363, Structural Performance Department, AEA Technology, Winfrith Technology Centre, U.K. (1995).
3 . Saudy A.M., Awad A.S., Elgohary M., “Ultimate Pressure Capacity of the ACR Containment Structure”, 18th Int. Conf.
on Structural Mechanics in Reactor Technology, (SMiRT-18), H9-06, Beijing, China, August 7-12, 2005.
4 . Krishnaswamy C.N., Namperumal R., Al-Dabbagh A., 1983, “Ultimate Internal Pressure Capacity of Concrete Containment Structures”, 7th Int. Conf. on Structural Mechanics in Reactor Technology, (SMiRT-7), vol. J3/6, p.
139-146, Chicago, August 22-26, 1983.
5 . Amin, M., Eberhardt, A.C., Erler, B.A., “Design Considerations For Concrete Containments Under Severe Accident Loads”, Nuclear Engineering and Design, vol. 145(3), p. 331-338, 1993.
6 . Luk, V.K., Pretest Round Robin Analysis of a Pre-stressed Concrete Containment Vessel Model, NUREG/CR-6678, 2000.
7 . Dameron, R.A. et al., “Posttest Analysis of the NUPEC/NRC 1:4 Scale Prestressed Concrete Containment Vessel Model”, NUREG/CR-6809, 2003.
8 . Hessheimer, M.F. et al., “Overpressurization Test of a 1:4-Scale Prestressed Concrete Containment Vessel Model”,
NUREG/CR-6810, 2003.
Table 1: Concrete Material Properties
Property Value Property Value
Mass Density (ton/m3) 2.4 Tensile strength (MPa) 3.55
Modulus of Elasticity (MPa) 28000 Shear Retention/Crack Opened 0.1
Poisson Ratio 0.15 Shear Retention/Crack Closed 0.16
Ultimate compressive strength (MPa) 35
Table 2: Concrete Material Model and Failure Criterion
Parameter Description Value
fc Ultimate uni-axial compressive strength 35 MPa
ft Ultimate uni-axial tensile strength 0.6 fc
fcb Ultimate biaxial compressive strength 1.20 fc
f1 Ultimate compressive strength (biaxial + ambient hydrostatic stress state) 1.45 fc
f2 Ultimate compressive strength (uni-axial + ambient hydrostatic stress state) 1.725 fc
Table 3: Material Properties of Reinforcing Steel, Tendons and Steel Liner
Property Steel Rebars Tendons Steel Liner
Mass Density (ton/m3) 7.85 7.85 7.85
Modulus of Elasticity (MPa) 200000 195000 200000
Tangent Modulus(MPa) 2000 2000 2000
Poisson Ratio 0.3 0.3 0.3
Yield strength (MPa) 400 1670 260 and 400
Table 4: Pressure Levels (kPa) at Important Stages
Event Pressure Pressure/Design Pressure
1st base slab radial cracking 635 1.41
1st wall meridian cracking 645 1.43
1st wall hoop cracking 796 1.77
1st yield of hoop rebar in wall 1122 2.49
1st yield of meridian rebar at wall/base slab joint 1218 2.71
1st yielding in liner 980 2.18
1st yielding of hoop tendons in wall 1275 2.83
Last converged solution pressure 1300 2.89
Table 5: Capacity Factors for Major Elements in Containment Structure at Pressure of 1300 kPa
Parameter Acceptance Criteria Attained Strain Capacity Factor
Hoop Tendons Yield strain = 0.01 0.0099 1.01
Vertical Tendons Yield strain = 0.01 0.0065 1.54
Steel Liner 12 × yield strain = 0.016 0.0048 3.33
Hoop Reinforcement 5 × yield strain = 0.01 0.0047 2.13
Meridian Reinforcement 5 × yield strain = 0.01 0.0038 2.63
Table 6: Pressure/Design Pressure Comparison with Results of SNL ¼ Scale PCCV at Important Stages
Event ACR Sandia
Fy = 260 MPa Fy = 400 MPa Test Analysis
Hoop concrete cracking 1.77 1.77 1.45 1.53
Hoop liner yielding 2.18 2.75 2.8 2.7
Hoop tendons yielding 2.83 3.07 3.3 3.0
Figure 1: ACR Containment Structure Figure 2: Reactor Building Sector Model
σyp
ft
Cracking fc
σxp
fc
ft Cracking Cracking
Crushing Steel liner
Outside Face Outside Rebar Layer Hoop Tendons
Meridian Tendons Inside Rebar Layer
Figure 3: Layers Across Thickness Figure 4: Biaxial Concrete Failure Criterion
(a) (b)
(c) (d)
Figure 5: ANSYS Deformation at pressures (a) 0 kPa, (b) 450 kPa, (c) 796 kPa, and (d) 1300 kPa
(a) (b)
(c) (d)
Figure 6: LS-DYNA Deformation at pressures (a) 0 kPa, (b) 450 kPa, (c) 830 kPa, and (d) 1300 kPa
(a) (b)
(c) (d)
Figure 7: Plastic strain at (a) first crack, (b) hoop cracking, (c) at 840 kPa, and (d) at 865 kPa
(a) (b)
(c) (d)
Figure 8: LS-DYNA Crack Propagation (a) first crack, (b) through base crack, (c) wall hoop crack, and (d) at 1750 kPa
0 225 450 675 900 1125 1350
-10 0 10 20 30 40 50 60 70 80 90 100 110 120
Radial Displacment (mm)
Pressure Load (kPa)
ANSYS
LS_DYNA
Figure 9: Load-Displacement Histories at Wall Mid-Height
0.0 0.5 1.0 1.5 2.0 2.5 3.0 3.5 4.0
-0.05 0.00 0.05 0.10 0.15 0.20 0.25 0.30 0.35 0.40 0.45 0.50
Strain (%)
Pr
essur
e
Load / D
esign Load
ACR, Liner Fy = 260MPa - ANSYS Hoop Liner Yielding @ 2.18 Pd Hoop Tendon Yielding @ 2.83 Pd Hoop Concrete Cracking @ 1.77 Pd Sandia Test
Hoop Liner Yielding @ 2.8 Pd Hoop Tendon Yielding @ > 3.3 Pd Hoop Concrete Cracking @ 1.45 Pd Sandia Analysis
Hoop Liner Yielding @ 2.7 Pd Hoop Tendon Yielding @ 3.0 Pd Hoop Concrete Cracking @ 1.53 Pd ACR, Liner Fy = 400MPa - ANSYS Hoop Liner Yielding @ 2.75 Pd Hoop Tendon Yielding @ 3.07 Pd Hoop Concrete Cracking @ 1.77 Pd ACR, Liner Fy = 260MPa - LS-DYNA
Figure 10: UPC of ACR Containment and SNL ¼ Scale PCCV