3D Seismic Analysis of Irregular Buildings
using STAAD.Pro
Karma Tempa
1, Kintu
2, Nima Dorji
2, Ugyen Dorji
2Lecturer, Department of Civil Engineering and Architecture, College of Science and Technology,
Phuentsholing, Bhutan1
Civil Engineer, Zhemgang Dzongkhag,, Zhemgang, Bhutan2
Civil Engineer, Ministry of Agriculture, Thimphu, Bhutan2
Civil Engineer, Thimphu City Corporation, Thimphu, Bhutan2
ABSTRACT: The Kingdom of Bhutan is situated in the Himalayas and is highly prone to earthquake and considered in Zone V of seismic zonation of India. Irregular buildings are common in the country, mainly due to the traditional architectural features, geographical conditions and functional requirements. The behaviour of a building during an earthquake depends on its overall size, shape and geometry, in addition to how the earthquake forces are carried into the ground. This study focuses on understanding the seismic behaviour of irregular structures and an attempt is made to investigate the appropriateness of several seismic analysis procedures for irregular buildings. For irregular buildings, International codes of practice recommends complete dynamic analysis using Time History method or a Response Spectrum method for seismic design.
KEYWORDS: Irregularity, Seismic Behaviour, Time History, Response Spectrum, Dynamic analysis.
I.INTRODUCTION
The irregularities of buildings in Bhutan are mainly due to the traditional architectural features projecting at the building façade and the geographical conditions. For study purpose, four different irregular buildings are analysed using different analysis methods for El Centro (S00E, 1940) ground motion and code spectrum (IS 1893: 2002) and the corresponding responses are compared. The buildings are modelled as a 3D frame for dynamic analysis and a lumped mass modal for static analysis. Bureau of Indian Standards (BIS) Code IS 1893 (part1): 2002 recommends dynamic analysis for the regular buildings, whose height is greater than 40m in zone IV and V and those greater then 90m in height in zone II and III, and irregular buildings higher than 12 m in zones IV and V, and those greater then 40m height in zones in II and III. IS 1893 (part1): 2002 defines two types of irregularities; (1) Plan irregularities namely, torsion irregularity, re-entrant corners, diaphragm discontinuity, out-of-plane offsets and non-parallel systems, (2)Vertical irregularities, namely, stiffness irregularity-soft storey and extreme soft storey,mass irregularity, vertical geometric irregularity, in-plane discontinuity in vertical elements resisting lateral force and discontinuity in capacity-weak storey.
II. RELATEDWORK
Also, Shaikh Abdul Aijaj Abdul Rahman and Girish Deshmukh (2013) performed seismic response of vertically irregular RC frame with stiffness irregularity at fourth floor to study the seismic response of the building using CSI -ETABS (version 9.7).
III. STRUCTURAL DESCRIPTIONS
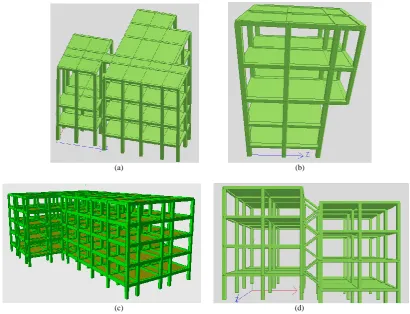
The performance of the structure subjected to seismic force depends on the configuration of buildings; therefore the building with the irregularities in their shape has to be dynamically analysed as per the specifications and provision of the codes with different methods and comparisons made accordingly. To study the behaviour of the irregularity of the buildings as a one unit, the buildings are modelled in 3D using STAAD.Pro. The rigidity of floor slab is modelled as plate element and the weight of the floor slab is taken into account using the floor load option available in STAAD.Pro. The analysis is performed for the following four different irregular buildings:
1. Wing type: Commercial Building
2. Building which is supported at different elevations: Commercial Building 3. L-shaped building: Public Building
4. Twin building supported at different elevations and interconnected with a stair case: Residential Building.
(a) (b)
(c) (d)
IV.SEISMICLOAD
The seismic weight of the building is the sum of the seismic weights of all the floors. Any weight supported in between storey are distributed to the floors above and below in inverse proportion to its distance from the floor. For various loading classes as specified in IS 875 (part2): 1987, the earthquake force is calculated for the full dead load plus the percentage of imposed load as given in Table 8. of IS 1893(part 2)-2002. While computing for seismic weight of each floor, the weight of the columns and walls in any storey is equally distributed to the floors above and below the storey.The loads are then combined as per the specification of Bureau of Indian Standard, IS 875(part5)-1987.
V.METHODSANDANALYSIS
a) Time History
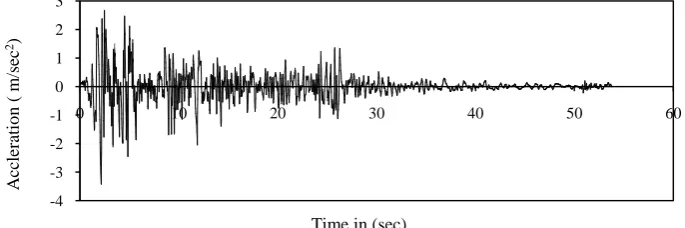
The most general approach for the solution of the dynamic response of structural systems can be achieved by „Direct Integration‟ which is the direct numerical integration of the dynamic equilibrium equations. Most methods use equal time intervals. The popular numerical techniques used for this one is Newmark‟s method, Central difference method and Wilson‟s method. It is an analysis for the dynamic response of the structure at each increment of time, when its base is subjected to a specific ground motion time history. Normally for earthquake loading, direct numerical integration is very slow. This method requires greater computational efforts for calculating the response at discrete times. An advantage of this procedure is that the relative signs of response quantities are preserved in the response histories. In this study the time history analysis is performed using the ground motion üg of El Centro (S00E, 1940)
ground motion. The horizontal component of El Centro (1940) ground motion is shown in Figure 2. The time interval Δt used for study is 0.02 seconds.
Fig. 2. El Centro (S00E, 1940) Spectrum for Time History Analysis
b) Response Spectrum Method
STAAD.Pro allows the user to analyse the structure for seismic loading by response spectrum analysis for any supplied response spectrum (either acceleration vs. period or displacement vs. period) and joint displacements, member forces, and support reactions may be calculated. Modal responses may be combined using one of the square root of the sum of squares (SRSS), the complete quadratic combination (CQC), and the absolute (ABS) methods to obtain the resultant responses.The maximum modal displacement, for a structural model, can now be calculated for a typical mode „n‟ with period Tn and corresponding spectrum response value SD. The maximum modal response associated with period T is given by:
D n MAX 2 n
S
x
=
ω
The maximum modal displacement response of the structural model is calculated from
ω2S
D = ωSV = SA
-4 -3 -2 -1 0 1 2 3
0 10 20 30 40 50 60
A cc lera ti o n ( m /se c 2)
The corresponding internal modal forces, fkn, are calculated from standard matrix structural analysis using the same
equations as required in static analysis.
c) Code Method
A seismic code of practice gives the guidelines to the designer to safely design the structure for its intended purpose. BTS-002-2003 refers to Indian code IS 1893:2002 for calculating seismic design force. According to the seismic zoning, Bhutan lies in zone V in which the earthquake forces are very severe. All the seismic parameters are as per the specification of code for zone V. The base shear depends on the mass and seismic coefficient of the structure; the later in turn depends on properties like seismic zone in which structure lies, importance factor, its stiffness, the soil on which it rests, and its ductility. The code deals with assessment of seismic loads on various structures and buildings. The provision of the code is based on the calculation of base shear and its distribution over different floor height.
d) Modal Analysis
Modal analysis (modal superposition method)has become a standard tool, for the solution of linear dynamic problems particularly in the seismic analysis of structural systems. The method is widely used, already classic on the subject, uncouples a set of „N‟ second degree differential equations governing the dynamic behaviour of „N‟ degree of freedom systems. Solution becomes that of a collection of N independent differential equations convenient for computation.
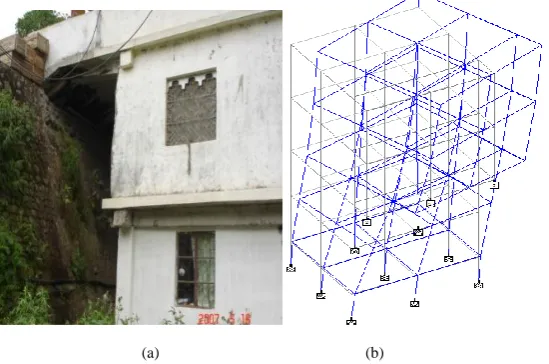
(a) (b)
Fig. 3. (a) Building supported at different level (b) Twisting mode
The dynamic response of an MDOF system to external forces P(t) can be computed by model analysis, as summarized below,
1. Define the structural properties
a. Determine the mass matrix m and stiffness matrix k b. Estimate the model damping ratio ζn
2. Determine the natural frequencies ωn and modes φn
3. Compare the response in each mode by following steps: a. Set up the equation, 𝑀𝑥..𝑛+C𝑛𝑥
.
𝑛+K𝑛𝑥𝑛=P𝑛(𝑡) and solve for xn, Where xn is modal coordinates,
M =𝜑𝑇mφ, C=.𝜑𝑇cφ and K=𝜑𝑇kφ
b. Compute the nodal displacements un from equation 𝒖𝑛(𝑡)=φ𝑛𝑥𝑛 , the total displacements is given by the
following equations: 𝒖 = 𝑁n=1𝜑𝑛𝑥𝑛, Where, φn is the nth natural vibration mode.
The elastic properties and mass of the building cause to develop a vibratory motion when they are subjected to dynamic action. The vibration of the building consists of fundamental modes of vibration and the additional contribution of various modes, which vibrates at higher frequencies. Therefore each mode has their own frequencies and mode shape corresponding to modes and frequencies. The animation of the mode shapes of the building supported at the different level shows that the first mode is torsion
e) Modal Response Combination
The conservative method that is used to estimate the peak value of displacement or force within a structure is to use the sum of the absolute value of the modal responses. This approach assumes that the maximum modal values, for all modes, occur at the same point in time. Another very common approach is to use the Square Root of the Sum of the Squares, SRSS, on the maximum modal values in order to estimate the values of displacement or forces. The SRSS method assumes that all of the maximum modal values are statistically independent. For three dimensional structures, in which a large number of frequencies are almost identical, this assumption is not justified. Another method which will consider the effect of correlation between different modal responses is the Complete Quadratic Combination (CQC)based on random vibration theories is the CQC method. The peak value of a typical force can now be estimated, from the maximum modal values, by the CQC method.
f) Static Lateral Force Method
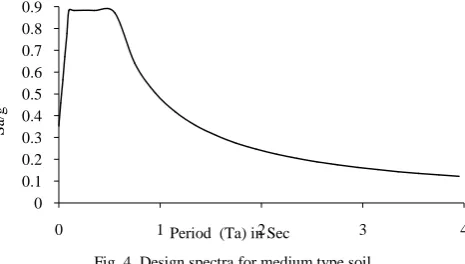
Further response spectrum method of analysis is conducted on a lumped mass model of the structure and the results are compared. In this method, IS 1893(Part 1): 2002 is used to analyse the building. The lumped mass calculated is used to determine the base shear. All the masses of each degree of freedom are added up. Building under consideration is analysed neglecting the infill. Therefore the fundamental time period (Ta), in seconds, of the frame is given by,
Ta = 0.075h
0.75 , Where „h‟ is height of the building.
Fig. 4. Design spectra for medium type soil
The total design seismic base shear (VB)along any principal direction shall be determined and distributed along the
height of the building for static analysis. The analysis is based on the concept that the buildings components if in any case is not adequate, then the failures are due to fundamental modes of failure only as recommended in the IS Code IS 1893(part1): 2002.
0 0.1 0.2 0.3 0.4 0.5 0.6 0.7 0.8 0.9
0 1 2 3 4
S
a/
g
Fig. 5. Lumped mass modelling for Twin building supported at different levels
VI.RESULTSANDDISCUSSION
The appropriateness of 3D frame models and 2D lumped mass models for the seismic analysis of the irregular structures was studied by comparing the response. The results are as discussed below:
1. The fundamental period calculated using the approximate code formula is approximately equal to the fundamental period calculated using the 3D modal analysis for all the four irregular buildings.
Table 1: Time Period Comparison in sec
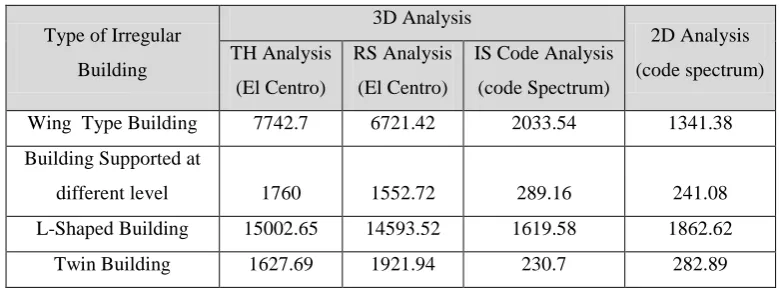
2. The base shear calculated by CQC method shows larger difference in 3D dynamic analysis as compared to 2D static analysis. As difference were observed due to building irregularities in all the four buildings considered in this study. Table 3 shows the summary of the base shear for each type of methods.
Table 3: CQC base shear in KN
Type of Irregular
Building
3D Analysis
2D Analysis
(code spectrum) TH Analysis
(El Centro)
RS Analysis
(El Centro)
IS Code Analysis
(code Spectrum)
Wing Type Building 7742.7 6721.42 2033.54 1341.38
Building Supported at
different level 1760 1552.72 289.16 241.08
L-Shaped Building 15002.65 14593.52 1619.58 1862.62
Twin Building 1627.69 1921.94 230.7 282.89 Type of Irregular Building 3D Dynamic analysis 2D lumped Mass Modelling
Wing Type Building 0.603 0.682
Building supported at different level 0.601 0.557
L-shaped building 0.484 0.542
3. It is observed that the areas of cross section of certain structural members are inadequate for building supported at different level and twin building supported at different elevation under 3D dynamic analysis.
(a) (b)
Fig. 6. Structural member failures: (a) Building supported at different level, (b) Twin building
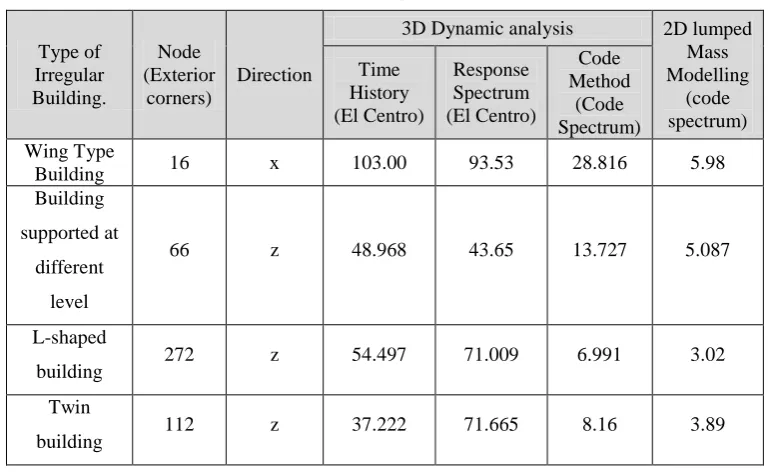
4. Similarly, the 3D dynamic analysis show higher nodal displacement and the base shear compared to 2D static analysis.
Table 2: Displacement in „mm‟
Type of Irregular Building.
Node (Exterior
corners)
Direction
3D Dynamic analysis 2D lumped Mass Modelling
(code spectrum) Time
History (El Centro)
Response Spectrum (El Centro)
Code Method
(Code Spectrum) Wing Type
Building 16 x 103.00 93.53 28.816 5.98
Building
supported at
different
level
66 z 48.968 43.65 13.727 5.087
L-shaped
building 272 z 54.497 71.009 6.991 3.02
Twin
building 112 z 37.222 71.665 8.16 3.89
VII.CONCLUSION
1. The current study show large difference in displacementand very high base shear differences between 3D dynamic analysis and 2D analysis and hence 3D dynamic analysis is recommended for irregular buildings.
2. Under 3D dynamic analysis, some structural members are found to be inadequate as in the case of building supported at different level and twin building interconnected with staircase with different level of support in the current study.
3. The fundamental mode shape may not be displacement mode for an irregular building as in the case of irregular building such as building supported at different level in the current study.
4. Since the contribution of high frequency modes is negligible, missing mass correction has no effect on the analysis. 5. In this study it is observed that the first 25 modes are quite adequate for their use in seismic analysis of the
irregular buildings, since the contributions of the higher modes are negligible.
6. The results have indicated that 3D dynamic seismic analysis is necessary to be conducted for irregular building to avoid the underestimation of seismic responses which may led to structural failure.
VIII.ACKNOWLEDGEMENT
The authors are thankful to Mr. Dhileep.M, Lecturer, Department of Civil Engineering, College of Science & Technology for his guidance throughout the study.
REFERENCES
[1] Oman S., Suresh S. K., and Aruna R., “Seismic Analysis of Vertical Irregular RC Building with Stiffness and Setback Irregularities”, IOSR Journal of Mechanical and Civil Engineering, Vol.14, pp.40-45, 2017.
[2] Shaikh S. J., and Shinde S.B., “Seismic Response of Vertically Irregular RC Frame with Mass Irregularity”, International Journal of Civil Engineering and Technology (IJCIET), Vol.7, pp.257-264, 2016.
[3] Shaik A. A. A.R, and Girish D., “Seismic Response of Vertically Irregular RC Frame with Stiffness Irregularity at Fourth Floor”, International Journal of Emerging Technology and Advanced Engineering, Vol.3, pp.377-385, 2013.
[4] Ashok, K. J., “Reinforced Concrete, Limit state Design”, 1999.
[5] Chopra, A.K., “Dynamics of Structures, Theory and Application to Earthquake Engineering”, 2005. [6] Pankaj A., and Manish S., “Earthquake Resistant Design of Structure”,2006.
[7] Clough R.W., and Penzien J., “Dynamics of Structures”, 1993.
[8] IS 456-2000, “Code of practice for Design Loads (other than Earthquake) for building and Structures”, Bureau of Indian Standards New Delhi.. [9] IS 875-1987, “Code of practice for Design Loads (other than Earthquake) for building and Structures”, Bureau of Indian Standards New Delhi. [10] IS 1893 (part1)-2002,“Criteria for earthquake resistant design of structures”; Bureau of Indian Standards, New Delhi.