112
Effect Of Diet Counseling On Type 2 Diabetes
Mellitus
Kusumaneela Bolla, Santhi K.V, K.Sara Afnan, P.Krishna Veni, M.Kusuma
Abstract: Diabetes is a metabolic disorder. Metabolism is the way the uses digested food for growth & energy. Importance of diet in diabetes can be treated back to the days of the ancient ayurvedic physician Sushreeta. Type of diabetes, age of the patient, body weight, severity of the hyperglycemia associated complications and mode of treatment being followed determine the exact allowance and type of diet. This needs to be worked out for each individual diabetic. Dietary management is the corn stone of diabetes treatment and should receive the almost consideration by the patient and by the treating physician. Objective: To assess The Nutritional Status and To Study the Effect Of Diet Counseling on Type II Diabetic Patients. Methodology:
For this study from diabetic hospital in Vijayawada were selected. In this study 40 samples age 30 to 60 years. They belong to age between 30 to 60 years. Preparation of Questionnaire to collect the General information (age, sex, past history of subjects) Anthropometric data, Biochemical information, Dietary information. Conclusion: There is significant changes in the blood sugar levels after the diet counseling. Intake of the high amounts of the fiber, low glycemic foods and functional foods helps to reduce the blood sugar levels randomly.
Index: Diabetes, Complications, Diet, Low Glycemic Foods, Diet Counseling.
————————————————————
INTRODUCTION
Diabetes is a metabolic disorder. Metabolism is the way the uses digested food for growth & energy. Glucose is the product of our food after all the processes of injection assimilation & absorption which means anything that is consumed, finally break down into glucose is the main sources of fuel for the body and is required form the production of energy, once digestion is over, next comes the process known as the assimilation. After the digestion process, the glucose that passes into the blood stream needs to be utilized by cells for growth and energy. To aid the glucose getting into the cells, we require a hormone called the insulin. Insulin is a hormone produced by the pancreas (islets of Langerhans), a large gland behind the stomach (Nagarathnam jetty, 2009).Diabetes mellitus increases the risk for coronary heart diseases 2-4 times and other sclerosis is rapidly progressive. Macro vascular complications are encountered more often in the type II than type I diabetes (Purnima Dey Sarkar et al., 2004). Diabetes is a metabolic disorder which has a variety of platelet functional disorders including increased platelet adhesiveness and an increased tendency to aggregation leading to macro vascular complications (Shakele et al., 1993). Diabetes mellitus is a life-long disease, which makes people worry about the quality and longevity of their life after being diagnosed with it. The complications of diabetes are influenced not only chronic glycemia, which is measured most reliably with glyciated hemoglobin assay
(Neil et al., 2002). Central obesity is an independent risk factor for cardio vascular disease, particularly in women. In most developed countries, the pre-valance of obesity is increasing steadily, and has reached epidemic proportion is in some populations with a resultant increase in cardio vascular disease burden. The fundamental basis of the association between obesity and Type-II diabetes mellitus
is a subject under intense scrutiny. Genetic susceptibility, environmental and dietary factors, and sedentary life style have also been implicated. Individual with Type-II diabetes mellitus are at particular risk of the adverse consequences of the metabolic syndrome culminate complication and the associated reduction in quality of life (Shera et al., 2004).
OBJECTIVES
To assess The Nutritional Status of type II diabetic patients.
To study the Biochemical Parameters like Blood Glucose Levels.
To Study the Effect Of Diet Counseling on Type II Diabetic Patients.
METHODS AND MATERIALS
SAMPLE SELECTION
For this study from diabetic hospital in Vijayawada were selected. In this study 40 samples age 30 to 60 years. They belong to age between 30 to 60 years.
PREPARATION OF QUESTIONNAIRE
To collect thea) General information, age, sex, past history of patient
b) Anthropometric data c) Biochemical information d) Dietary information.
ANTHROPOMETRIC DATA
Height, weight and BMI were noted.DIETARY SURVEY
Protein, Energy, Fat, Carbohydrates, Calcium, Vitamin-A, Thiamine, Riboflavin, Vitamin-c.
GENERAL INFORMATION
Data regarding age, sex, occupation, education, family size, activity, type of family, complications, duration of the condition and type of diet was collected from the subjects.
HEIGHT
_____________________ Kusumaneela Bolla, Santhi Sri.K.V, Department of
Food & Nutritional sciences, Acharya Nagarjuna University.
K.Sara Afnan, P.Krishna Veni, M.Kusuma
113 The subject was made to stand on a even floor (with the
back to buttocks, shoulders and back of head touching up right). The head was made erect with the lower border of the orbit in the same horizontal plane and arms hanging at the sides in a natural manner. A wooden scale was gently placed firm above to press the hair, making contact on the head the subject was requested to come out without disturbing the scale was marked height was measured with a metal tape from the point down measured with a metal tape wall. The height was measured with a metal tape from the point downward to the bottom on the wall. The height was measured in centimeters.
WEIGHT
The weight was measured in kilograms using the produce describe by Jelliffe (1996) using the bathroom scales. The balance was placed on even floor. The subjects were requested to come with light clothes (0.4-0.6kg) the subjects were made to stand on the centre of the balance (foot rest place) with head erect. The weight was recording avoiding parallel errors.
The weight was expressed in kg, up to the nearest 0.5kg. The sample balance was checked periodically with standard weight adjusting this scale to zero in the resting position.
BODY MASS INDEX [BMI]
Obesity index of the subjects was calculated by using the formula. BMI= weight in kg’s / Height in (mt2
) (Ferro Luzi et al., 1992). Subjects were classified according to the international classification of adult under weight, overweight, and obesity according to BMI as in the below table.
WAIST / HIP RATIO:- (WHR)
Waist / Hip ratio is widely accepted from fat patterning measurement. According to Jelliffe (1991), the waist hip ratio is calculated using the formula waist circumference/hip circumference. A waist hip ratio 1.0 centimeter is grater in men and 0.85 centimeter or greater in women is an accepted clinical method for identifying subjects with abdominal fat accumulation (Ghai & Guptha, 1999).
IDEAL BODY WEIGHT:
IBW of the subject was calculated by using the formula given by Jelliffe in 1996.
IBW (For Women) = Height in Cms × 350 1000
IBW (For Men) = Height in Cms × 400 1000
BIOCHEMICAL INFORMATION:
2 to 3ml of blood was drawn by venipuncture with a disposal syrine. Immediately the blood was transfer slowly into the acid washed test tube and allowed to clot at room temperature. The obtained serum is used immediately for the estimation of glucose all the reagents are stored back immediately at 2-8c. Source:- WHO (1998), James and Luizz et al., (1992).
DIET SURVEY:
Data on dietary consumption of subjects was collected by using 24hrs recall method, the total calorie, protein, fats, fiber, carbohydrates, calcium, Iron, 𝛽-Carotene, thiamine, riboflavin, niacin, Vit-c and folic acid were calculated. Standardized big and small steel katories, a set of tea and table spoons generally used in the nutritional laboratory were distributed to the subject to collect the data on quantitative cooked food intakes. The subjects were requested to report about their dietary intake for the previous days (24hrs recall) particularly information regarding individuals general pattern of consumption of fiber, sugar, sweet, etc were also obtained from the subjects under study. The nutritive values of the cooked diets were calculated using the raw weight of the ingredients. From this the nutritive value were back calculated for the cooked foods. Thus the nutrient intakes of the individuals were obtained.
RESULT & DISCUSSION
:
The study subjects were asked about their health-related behavior at base line and subsequently at each annual follow-up examination Self-Reported Change in Dietary and Exercise Habits during the First Year of the Intervention, According to Treatment Group. The subjects in the intervention group were more likely to report changes in dietary and exercise habits. Success in achieving the goals of the intervention was estimated on the basis of the food records and exercise questionnaires collected. The study subjects were asked about their health-related behavior at base line and subsequently at each annual follow-up examination Self-Reported Change in Dietary and Exercise Habits during the First Year of the Intervention, According to Treatment Group. The subjects in the intervention group were more likely to report changes in dietary and exercise habits. Success in achieving the goals of the intervention was estimated on the basis of the food records and exercise questionnaires collected at the one-year examination Success in Achieving the Goals of the Intervention by One Year, According to Treatment Group. The proportion of subjects in the intervention group who succeeded in achieving a particular goal varied from 25 percent (fiber intake) to 86 percent (exercise).examination Success in Achieving the Goals of the Intervention by One Year, According to Treatment Group ( Jaakko Tuomilehto, 2001). There is rapid increasing epidemic of type-2 diabetes in India other as Asian countries. People in the Indian sub continent have faced under nutrition for many generations, and Indian babies are among the smallest in the world. However, the diabetes is more common on among urban than rural Indians despite the higher birth weight of urban babies for a given BMI, Indians have a higher percentages of the body fat and more visceral fat than members of other population. The study found that the local prevalence of type II diabetes will be more than able from 135 million in 1995 to 300 million by 2025 (simha et al., 2003). Urban life styles, including poor diet & sedentary habits, promote further obesity, insulin resistance and type-2 diabetes.
3.1: General information 3.2: Clinical parameters
3.3: Anthropometric & health status
114 3.5 : Impact of diet counseling on blood glucose levels
3.1 GENERAL INFORMATION:
General information was obtained from all the students about age, occupation, family history, vegetarians or non vegetarians.
Age:
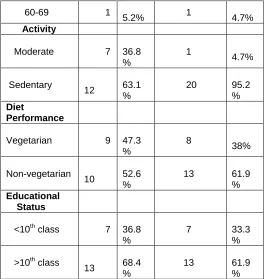
In this subjects 0% of the women and men (5.2%) were 20-29 yrs. (10.5%) of the men and (38%) women were 30-39 yrs. (47.3%) men and women (33.3%) were 40-49 yrs.(31.5%) men and (23.8%) women were 50-59 years. (5.2%) men and (4.7%) women were 60-69 years.
Activity:
Occupation of the subjects was also noted. The different occupation of the subjects is farmers and labors, house wives, business, tailor, teachers, at tenders, mechanics and people others. Moderate(36.8%) in men and women (4.7%) and sedentary (63.1%) in men and women (95.2%). A new study by researcher in the uk reported that people with gazette occupation are more prone to develop diabetes because of more perceived stress levels (arch et al.,2008).
Diet performance:
Most of the individuals were non-vegetarian in men (52.6%) and women (61.9%) and vegetarians (47.3%) in men and (38%) in women. A vegetarian diet is scientifically proven to be healthier than non vegetarian diet due to the exclusion of meat which is a huge contributor towards cholesterol and saturated fat intake in humans. Non vegetarians are more prone to diabetes, obesity, heart disease etc (banersi et al., 2000).
Educational status:
Regarding to the educational status is (36.8%) in men and women (33.3%) studied less than 10th class and (68.4%) in men and (61.9%) in women studied greater than 10th class.
TABLE: 8
General information of diabetic men and women with numbers and percentage
Parameters
Men (n=19 ) No.
%
Women(n=21 )
No.
% Characteristic
s
Age
20-29 1
5.2% 0
0%
30-39 2
10.5 %
8 38%
40-49 9
47.3 %
7
33.3 %
50-59 6 31.5 %
5
23.8 %
60-69 1
5.2% 1
4.7%
Activity
Moderate 7 36.8 %
1 4.7%
Sedentary 12
63.1 %
20
95.2 %
Diet
Performance
Vegetarian 9 47.3 %
8 38%
Non-vegetarian 10
52.6 %
13
61.9 %
Educational Status
<10th class 7 36.8 %
7
33.3 %
>10th class 13
68.4 %
13
61.9 %
Association Between age and Diabetes:
0.00% 20.00% 40.00% 60.00% 80.00% 100.00%
Males Females
3.2 CLINICAL PARAMETERS:
Clinical parameters were obtained from all the subjects about their duration period. Diabetes subjects mainly suffer with fiber like poly urea, poly phagia, and poly dypsia.100% of both males and females, 26.3% was observed in males and 47.3% females suffer with poly phagia, 47.3% was observed in males and 42.8% females suffer from poly dypsia. Eye problem was observed in 47.3% in males and 66.6% females.
Table No: 9
Clinical Factors of men and women with percentage:
Visual problem
Males Females
Yes 47.3% 66.6%
No 52.6% 33.3%
Poly urea
115 No 0% 0%
Poly dypsia
Yes 26.3% 47.6%
No 73.6% 52.3%
Poly phagia
Yes 47.3% 42.8%
No 52.6% 33.3%
3.3 ANTHROPOMETRIC AND HEALTH STATUS:
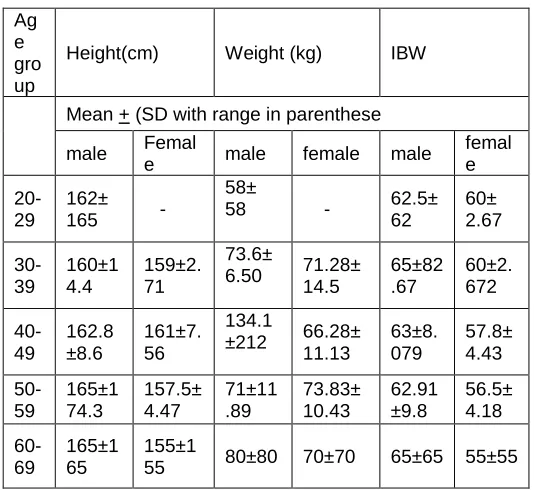
Anthropometry is a science of measurements of body size and complication [body height, weight, arm circumstance, abdominal circumstances and hip circumference]. This information was useful for assessing growth, nutritional status and body composition.BMI is a measure to show the grade of malnutrition and over nutrition from the height and weights of individuals. The mean BMI of both men and women were 1.975 respectively.
Table No: 10
Mean anthropometric Data of men and women:
Mean Anthropometric measurements if the both men and women in 5 age groups:
Ag e gro up
Height(cm) Weight (kg) IBW
Mean + (SD with range in parenthese
male Femal
e male female male
femal e
20-29
162± 165 -
58±
58 - 62.5± 62
60± 2.67
30-39
160±1 4.4
159±2. 71
73.6±
6.50 71.28± 14.5
65±82 .67
60±2. 672
40-49
162.8 ±8.6
161±7. 56
134.1
±212 66.28± 11.13
63±8. 079
57.8± 4.43
50-59
165±1 74.3
157.5± 4.47
71±11 .89
73.83± 10.43
62.91 ±9.8
56.5± 4.18
60-69
165±1 65
155±1
55 80±80 70±70 65±65 55±55
The mean height in the age group 20-29 years is162± 165 males and 0 females 30-39years is160±14.4maes and159±2.71 females 40-49years 162.8±8.6 males and 161±7.56 females 50-59 years is165±174.3 males and 157.5±4.47 females 60-69 years is 165±165 males and155±155 females. The most frequently used index today is the quetelet (or) body mass index (BMI). TDhe correlation of the BMI with body fat is relatively high (ranging from 0.6-0.8 depending on age) and correlates with the body height is generally low (Khosla and lowe 1967; Keysetal, 1972; Womersley and Durinn 1977; Garrow
andWebster 1985; Deurgenburg etal 1991). The index can be used as crude index to judge relative body weight. Table (10) also show the mean ideal body weight (IBW) of the women. The mean ideal body weight (IBW) in the 20-29 years is 62.5±62 males and 60± 2.67females is 30-39 years and 65±82.67 female and 60±2.672 females 40-49 years and 63±8.079 males and 57.8±4.43 females 50-59 years is 62.91±9.8males and 56.5±4.18 females 60-69 years 65±65 males and 55±55 female.
Heights:-In the present study in females and height is not affected in the age groups. The mean height of the 163.3cms and that of the females are 155 cms. The ICMR standards for males are 173.63 cms and for females are 156 cms. Thus it is observed that there is slight difference when compared to the standards and similarly when compared between males and females also there is slight difference.
Weights:-
Weight was one of the important indicator of health, the weight of the subject was measured and they are compared with standard weights (60 kgs for males and 50 kgs for females) out 40 subject 50% shows normal weight and the remaining 50% shows over weight than the standard weights. The mean height in the age group 20-29 years 58± 58 males and 0 females 30-39years73.6±6.50males 71.28±14.5 females 40-49years 134.1±212 males and 66.28±11.13 females 50-59 years is 71±11.89 males and 73.83±10.43 females 60-69 years is 80±80 males and 70±70 females.
BMI (Body Mass Index)
BMI is being increasingly accepted as the simplest means of diagnosing chronic protein energy deficiency. The BMI includes both fat and lean tissue. The BMI of the women is present study table showed that 43.26% are in normal range and 39.98% are overweight and 3.3% are grade-I obesity and 3.3% are grade-II obesity and 6.6% chronic energy deficiency grade-I and 3.3% , grade-III.
James etal(1988) stated that in chronic energy malnutrition BMI decreases. Hence, any change in the weight can reflect in the BMI and can serve as a valid indicator of chronic energy deficiency.
3.4 DATA ON DIETARY INTAKES AND NUTRITIONAL STATUS:
Adequate basic information on diabetes enable the diabetic to comprehend and improve their psychological acceptance of the disease. In addition the importance of following the dietitian instructions regarding diet.
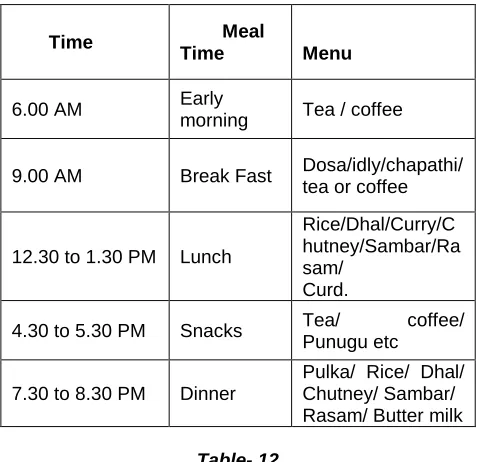
Dietary pattern:
116 exceptions. Lunch usually has rice, dhal, curry, chutney,
sambar, rasam, curd or buttermilk is must in lunch. The dinner items are also almost similar to lunch pattern.
Table No:11
24 recall Dietary pattern of diabetes subjects
Time Meal Time
Menu
6.00 AM Early
morning Tea / coffee
9.00 AM Break Fast Dosa/idly/chapathi/ tea or coffee
12.30 to 1.30 PM Lunch
Rice/Dhal/Curry/C hutney/Sambar/Ra sam/
Curd.
4.30 to 5.30 PM Snacks Tea/ coffee/ Punugu etc
7.30 to 8.30 PM Dinner
Pulka/ Rice/ Dhal/ Chutney/ Sambar/ Rasam/ Butter milk
Table- 12
nutrients for mean and standard value & campared to RDA
Nurients Mean± standard deviation
RDA values
Protein(g) 92.95496±
11.25827 50
Fat(g) 49.45593±14.25469 65 Fiber(mg) 292.4998±33.6671 25 Carbohydrate(g) 307.3873±38.1375 300 Energy(k.cal) 1992.604±114.7643 2,100 Calicum(mg) 403.9154±78.47419 1000 Iron(mg) 34.25807±1.8486 18 Carotene(µg) 2271.074±71.01424 2400
Energy Intakes:-
Energy is essential for rest, actively and growth. It is well known that even when the body is at rest, it expends certain amount of energy for essential functions such as respiration, blood circulation, digestion, absorption. Excretion & maintenance of the body temperature etc. In the present study the sample is form moderate workers. The mean consumption of women in the 30 – 45years age 2052, after counseling the energy value is 2136. When we check the weights with the intakes in the present study the weight of ICMR and only 50kg may be this difference in energy intake account for the extra body weights in this study group.
Protein:-
The protein intake in women before counseling 49.84g and the after counseling slightly increases 52.52gms.The RDA for womens it 50gms. According to the pass more and Durin (1995) Durin & pass more (1967) indicated that the energy cost for moderate activity is up to 7 Kcal/min
Calcium:-
Calcium is an important nutrient, it should be included in the diet for optimum health. Calcium helps in the bone formation, contraction of muscle and blood sircium from dairy products interfaces significantly with iron absorption of both harm and non-harm iron. The mean consumption of calcium in women 828.2mg, which are significantly higher than RDA.m glucose (fasting) was estimated for all the selected subjects under study.
3.5 Impact of diet counseling:
Impaired glucose tolerance is an intermediate category between normal glucose tolerance and overt diabetes,10, 11 and it can be identified by an oral glucose-tolerance test. Subjects with impaired glucose tolerance have an increased risk of type 2 diabetes12 and therefore form an important target group for interventions aimed at preventing diabetes. The Finnish Diabetes Prevention Study was conducted to determine the feasibility and effects of a program of changes in lifestyle designed to prevent or delay the onset of type 2 diabetes in subjects with impaired glucose tolerance.Vladislav Moltchanov, 344:1343-1350). The subjects in the intervention group were given detailed advice about how to achieve the goals of the intervention, which were a reduction in weight of 5 percent or more, in total intake of fat to less than 30 percent of energy consumed, and in intake of saturated fat to less than 10 percent of energy consumed; an increase in fiber intake to at least 15 g per 1000 kcal; and moderate exercise for at least 30 minutes per day. Frequent ingestion of whole-grain products, vegetables, fruits, low-fat milk and meat products, soft margarines, and vegetable oils rich in monounsaturated fatty acids was recommended. The dietary advice was tailored to each subject on the basis of three-day food records completed four times per year. Each subject in the intervention group had seven sessions with a nutritionist during the first year of the study and one session every three months thereafter. These subjects also received individual guidance on increasing their level of physical activity. Endurance exercise (such as walking, jogging, swimming, aerobic ball games, or skiing) was recommended as a way to increase aerobic capacity and improve cardio respiratory fitness. Supervised, progressive, individually tailored, circuit-type resistance-training sessions were also offered with the aim of improving the functional capacity and strength of the large muscle groups; subjects were instructed to perform a moderate to high number of repetitions and to take a break of 15 to 60 seconds between the stations on the circuit. ( Vesa Martikkala)
Suggested nutrients ratio:
Carbohydrates - 55-60%
Proteins - 20% or 1g/kg body weight
Fats - 20-25%
Some functional foods like fenugreek seeds, drumstick leaves, use of 3 fresh garlic, and less oil(4tsp/day)
TableNo: 13
Impact of diet counseling on fasting blood glucose levels
117
Mean± SD (mg/dl)
Initial Final
1 Male
175.0895± 75.28034
80.231± 56.8210
2 Female
151.9048± 46.9152
90.8901± 37.8671
TableNo: 14
Impact of diet counseling on fasting blood glucose levels
s.no Gender
Blood Glucose Post Prandial levels
Mean± SD (mg/dl) Initial Final
1 Male 212.8842± 82.75405
160.7814± 73.4210
2 Female 197.85± 51.46514
170.81± 45.8134
SUMMARY AND CONCLUSIONS
Importance of diet in diabetes can be treated back to the days of the ancient ayurvedic physician Sushreeta. Type of diabetes, age of the patient, body weight, severity of the hyperglycemia associated complications and mode of treatment being followed determine the exact allowance and type of diet. This needs to be worked out for each individual diabetic. Dietary management is the corn stone of diabetes treatment and should receive the almost consideration by the patient and by the treating physician. The sample as selected from hospital in Vijayawada. Data was collected from 40 samples from both sexes about their general information, clinical information and anthropometry and nutrient intakes. The results of this data resummarized and concluded are in this chapter. Clinical parameters were obtained from all the subjects about their duration period. Diabetes subjects mainly suffer with fiber like polyurea, polyphagia, and polydypsia.100% of both males and females, 26.3% was observed in males and 47.3% females suffer with poly phagia, 47.3% was observed in males and 42.8% females suffer from poly dypsia. Eye problem was observed in 47.3% in males and 66.6% females.
There is significant changes in the blood sugar levels afte diet counseling. Intake of the high amounts of the fiber, low glycemic foods and functionl foods helps to reduce the blood sugar levels randomly.
BIBLIOGRAPHY
[1] American Diabetes Association, standards of medical care in diabetes, diab.care 27 [suppl.1] [2004]515-535.
[2] World Health Organization, Definition, Diagnosis and classification of diabetes mellitus and it’s complications: Report of a WHO consultation. Part 1: Diagnosis and classification of Diabetes
mellitus, Geneva, World Health Organisation, 1999.
[3] Ramachandran A, Snehalatha C, kapur A, Vijay V, Mohan V, Das AK,et.al. Diabetes Epidemiology Study Group in India [DESI]. High prevalence of diabetes and impared glucose tolerance in India:
[4] Andrew JK.diabetes Churchill living stone: New York; 2000.
[5] Balde NM, Youla A, Balde MD, Kake A, Diallo MM, Balde MA, Maugendre D.herbal medicine and treatment of diabetes in Africa: an example from Guinea. Diabetes Metab2006:32:171-5.
[6] Dey L, Attele AS Yuan CS. Alternative therapies for type 2 diabetes.Altern Med Rev 2002; 7:45-58.
[7] Diabetes Merlin T, Con T, Richard M, George J. Anemia in Diabetes an Emerging Complication of Micro vascular Disease. Curr Diab Rev 2005; 1:107-26.
[8] Eddouks M, Maghrani M, Lemhadri A, Ouahidi ML, Jouad H. Ethno pharmacological survey of medicinal plants used for the treatment of diabetes mellitus, hypertension and cardiac diseases in the south-east region of Morocco (Tafilalet). J Ethnopharmacol2002; 82:97-103.
[9] Michael PK, AsimAB, Robert SB. The utility of Oral Diabetes Medications in Type 2 Diabetes of the Young.Curr Diab Rev2005:1:83-92.
[10]Ranjan C, Ramanujam R. Diabetes and Insulin resistance associated disorders: Disease and the therapy. Curr Sci. 2002:83:1533-38.
[11]Satyavati GV, Tandon N, Sharma M. Indigenous Plant Drugs for Diabetes Mellitus. [Updated 1989 October; cited 2007 June 14].
[12]Shankar P, Sundarka Mk. Management of type 2 Diabetes: Evidence based Approach. J Indian Acad Clin Med 2001; 2; 244-50.
[13]Subbulakshmi g, Naik M. Indigenous foods in the treatment of diabetes mellitus. Bombay Hospital J. 2001; 43(4); 548-61.
[14]Torben H.Genetics of type2 diabetes. Curr Sci 2002; 83:1477-82.
[15]Gold fine AB, Bouche C, Parker RA, king c, Kerivan A, Solldner JS, Martin BC-, warm JH, Kahn CR; Insulin resistance is poor predictor of type-2 diabetes in individuals with no family history of diseases. Proc. Notl Acad. Sci USA100: 2724-2729, 2003.
118 glucose and pancreatic beta cell function in Latino
women at high risk for type-2 diabetes. Diabetes 55:1074-1079, 2006.
[17]Ramachandran A. Epidemiology of diabetes in India- Three decades of research. J Assocphysicans India 2005; 53: 34-8.
[18]McCarthy MI: Progress in defining the molecular basis of type-2 diabetes mellitus through susceptibility gene identification, Hum mol Genet 13 [Spec.No.1]: R33-R41, 2204.
[19]Zimmet p, Alberti KGMM, Shaw J, Global and Scietil Implications of the diabetes epidemic. Nature.2001; 414:782-787.
[20]Howarth NC, Saltzman E, Roberts SB. Dietary fiber and weight regulation. Nutr Rev 2001; 59:129-39.
[21]Stratton, I.M., Adler, A. I., Neil. H.A.et.al [2002].Association of glycemia with macro vascular and micro vascular complications of Type-2 diabetes [UK PDS 35] Prospective observational study. B MJ 321, 405-412.
[22]Ramachandran A, Snehalatha C, Kapur, et.al, Diabetologia.2001; 44: 1094-1101.
[23]Mohan V, Sandeep S, Deepa R, Shah B, Varghese C, epidemiology of Type 2 diabetes: Indian scenario. Indian J Med 2007; 125:217-30.
[24]King H., Aubert, R.E and Herman, W.H., Diab.Care, 1998, 21, 1414-1431.
[25]Ramachandran A, Snehalatha C, Kapur, et.al,. Diabetologia. 2001; 44:1094-1101.