RESEARCH ARTICLE
WAVELET ANALYSIS OF AIR POLLUTION DUE TO GROUND LEVEL NITROGEN DIOXIDE
*Dr. Anil Kumar
Associate Professor, Department of Physics, Hindu College, Moradabad (U. P.) India
ARTICLE INFO
ABSTRACT
Nitrogen dioxide comes from vehicles, power plants, industrial emissions and off-road sources such as construction, lawn and gardening equipment. All of these sources burn fossil fuels. Unlike ozone and particle pollution, which can be of concern over large regions, NO2levels are appreciably higher in close proximity to pollution sources. Health effects associated with NO2are much less likely farther away from these pollution sources. Scientific evidence links short-term NO2exposures, ranging from 30 minutes to 24 hours, with adverse respiratory effects including airway inflammation in healthy people and increased respiratory symptoms in people with asthma. The wavelet is a new analytical tool for chaotic data to the physics community. It allows detection and characterization of short-lived structures in data. Daubechies 4 wavelet is orthogonal and compactly supportive and therefore, it is useful for multiresolution analysis of average NO2 data. Approximation and Detailed coefficients provide information in average and difference form. Skewness and Kurtosis parameter describe lack of the symmetry of data.
Copyright©2017, Dr. Anil Kumar. This is an open access article distributed under the Creative Commons Attribution License, which permits unrestricted use, distribution, and reproduction in any medium, provided the original work is properly cited.
INTRODUCTION
The Earth’s atmosphere is a gaseous envelope, retained by
gravity, surrounding the Earth. The density falls rapidly with height: 90 % of the mass of the atmosphere is contained within the first 20 km, 99.9 % within the first 50 km. Nitrogen dioxide oxide (NO2) concentrations are 0.3 ppm (by volume) rising at 0.25 % per year. The concentration is now about eight times that of the pre-industrial period. Sources are fertilisers, chemical industry (nylon production) and deforestation. Concentrations in rural areas are generally much lower and vary with distance from source. The concentration of NO2is a complex function of the meteorological situation, the emission rate of nitrogen oxides, the oxidation of NO to NO2 and the oxidation rate of NO2to other species. Dispersion, deposition and chemical transformation cause the concentration of nitrogen oxides to decrease with distance from an emission source. Emission of nitrogen oxides arise mainly from anthropogenic combustion sources, where NO is formed by reaction between the nitrogen and the oxygen in the combustion air and to some extent by oxidation of nitrogen in the fuel. The amounts formed depend on the pressure and temperature of the combustion process. The main anthropogenic sources are mobile combustion sources (road, air and water traffic) and stationary combustion sources (including industrial combustion).
*Corresponding author: Dr. Anil Kumar,
Associate Professor, Department of Physics, Hindu College, Moradabad (U. P.) India.
Nitrogen oxides from industrial processes may be mainly emitted as NO2, while the industrial combustion sources mainly emit NO. Since the amount of Nox emission is dependent on combustion conditions and process loads, estimates of emissions from different types of sources and areas will always be uncertain. In some cases the degree of uncertainty may be large. Its presence in air contributes to the formation and modification of other air pollutants, such as ozone and particulate matter, and to acid rain (L. J. Clapp et
al., 2001).Nitrogen Dioxide (NO2) is a reddish-brown, highly
reactive gas formed when another pollutant (nitric oxide) combines with oxygen in the atmosphere. Once it has formed, NO2reacts with other pollutants, such as volatile organic
compounds. Eventually these reactions result in the formation of ground level ozone. The Environmental Protection Agency uses its Air Quality Index to provide general information to the public about air quality and associated health effects. An Air Quality Index (AQI) of 100 for any pollutant corresponds to the level needed to violate the federalhealth standard for that pollutant. For nitrogen dioxide, an AQI of 100 corresponds .053 parts per million (averaged over 24 hours) the current federal standard. Short-term health effects for NO2do not
occur until index values are above 200; therefore, an AQI value is not calculated below 201 for NO2. An index value of
201 for NO2corresponds to an NO2level of 0.65 parts per
million (averaged over 24 hours). Unlike ozone and particle pollution, which can be of concern over large regions, NO2 levels are appreciably higher in close proximity to pollution sources (e.g., vehicles on major freeways, factories) (J.
ISSN: 0976-3376
Vol. 08, Issue, 08, pp.5218-5222, August, 2017Asian Journal of Science and TechnologySCIENCE AND TECHNOLOGY
Article History: Received 17thMay, 2017
Received in revised form 22ndJune, 2017 Accepted 14thJuly 2017
Published online 31stAugust, 2017
Key words:
Nitrogen dioxide, Air Pollution, Wavelet,
Flemming et al., 2005). Health effects associated with NO2 are much less likely farther away from these pollution sources. Monitoring studies have shown that within approximately 50 meters of heavy traffic/freeways, NO2concentrations may be 30 to 100 percent higher. Nitrogen compounds are present in the atmosphere in both reduced and oxidised forms. The reduced compounds include ammonia (NH3 ) and ammonium (NH4 ). The oxidised compounds include nitrous oxide (N2O), nitrogen oxide (NO), nitrogen dioxide (NO2 ), nitrous acid (HNO2 ), nitric acid (HNO3), peroxyacetylnitrate (PAN) and particulate nitrate (NO3). Nox is defined as NO+NO2. Nitrous oxide (N2O) is emitted to the atmosphere due to bacterial activity in the soil. It is emitted also from anthropogenic sources (e. g. catalytic reduction processes) and acts as a greenhouse gas. However, it is disconnected from the Nox chemistry in the atmosphere and is not important for assessment of air quality. Nitrogen oxides are emitted mainly (in most cases >90%) as NO. NO2 is formed relatively rapidly from NO by reaction with ozone or radicals, such as HO2 or RO2. Via a number of different atmospheric reactions some nitrogen oxides will finally become HNO3 /NO3, which, with NO2 are removed from the atmosphere via wet and dry deposition processes. Although it is not the major nitrogen oxide species in all areas, NO2 is one of the most important air pollutants in urban areas, as it is the most significant nitrogen oxide species from a human health point of view. Nitrogen oxides play a key role in the formation of photochemical oxidants, and this position paper will deal mainly with nitrogen dioxide and to a lesser extent, NO in air. The various sources, concentrations in urban and rural air, and the environmental effects of nitrogen oxides are considered. The environmental effects include human health effects, material damage and ecosystem (acidification and eutrophication) effects caused by NO2 n the air, and deposition of nitrogen compounds (S. Beirle et al., 2003). Effects on the ecosystems will mainly be the same, whether oxidised or reduced nitrogen compounds are deposited. For this reason, reduced nitrogen compounds will impact the assessment of oxidised nitrogen in the environment. A further factor is the interaction between nitrogen oxides and ammonia in the atmosphere.
Study on human populations indicate that long-term exposure to NO2levels currently observed, may decrease lung function and increase the risk of respiratory symptoms such as acute bronchitis and cough and phlegm, particularly in children. NO2 alone has been shown to cause acute health effects in controlled human exposure studies. Several studies have shown that NO2 exposure increases allergic responses to inhaled pollens. In setting standards to protect public health from the effects of air pollutants, the concept of thresholds may not be useful, because certain population groups are very sensitive, and effects are detected even at low levels. To enable the development of effective risk reduction strategies based on qualitative and quantitative knowledge, further data analysis and more comprehensive monitoring is required.
Fourier sine’s extracts only frequency information from a time
signal, thus losing time information, while wavelet extracts both time evolution and frequency composition of a signal (M. Farge, 1992). Wavelet is a special kind of the functions which exhibits oscillatory behaviour for a short time interval and then dies out. In wavelet we use a single function and its dilation and translation to generate a set of orthonormal basis functions to represent a signal. Number of such functions is infinite and we choose one that suits to our application.
The range of interval over which scaling function and wavelet function are defined is known as support of wavelet. Beyond this interval (support) the functions should be identically zero. There is an interesting relation between length of support and number of coefficients in the refinement relation. For orthogonal wavelet system, the length of support is always less than no. of coefficients in the refinement relation.
Theoretical Background
Wavelet cuts up data into different frequency components and then study each component with a resolution matched to its scale. The wavelet technique has great advantage of approximating the signals which contain discontinuities and sharp spikes. Wavelet analysis emerged as a widely applied technique in many disciplines. This methodology has recently been used to trace the changes in trends and cycles, rainfall variability ( O. A. Lucero et al., 2000, H-S. Oh et al., 2002) in the last decade analysis of variance (F. W. Zwiers et al., 1996 ) and regression models have also been used to evaluate possible environmental change scenerios and inhomogenity within climate records. The detection of non-stationarities (i. e. interruptions or non-persistence in the temperature variability record) is particularly crucial when making statistical interferences (A. Bundle et al., 2001). These earlier
inhomogeneity analysis models filtered out inhomogenies as differences compared to specific trends (i. e. regressive trend) or bandwidths ( i. e. by using low pass filters utilizing moving averages), while wavelet transform presents inhomogenities in time series as the sum of temporal changes in the amplitude and phase of records over a wide since wave bandwidth. One of the most significant and recurrent patters of atmospheric variability over the middle and high latitude of the northern hemisphere is known as NAO- North Atlantic Oscillation. Most of the regression methods are linear in responses.
relation between length of support and number of coefficients in the refinement relation. For orthogonal wavelet system, the length of support is always less than no. of coefficients in the refinement relation. It is also very helpful to require that the mother function have a certain number of zero moments, according to:
The environmental change is still an open problem in atmospheric environmental science and wavelet transform has opened up a new avenue for tackling this problem in as much more accurate manner.
Wavelet Transforms
The mother function can be used to generate a whole family of wavelets by translating and scaling the mother wavelet.
Here is the translation parameter and is the dilation or
scaling parameter. Provided that ψ(t) is real-valued, this collection of wavelets can be used as an orthonormal basis. A critical sampling of the continuous wavelet transform is
is obtained via , where and are integers representing the set of discrete translations and discrete dilations. Upon this substitution, we can write discrete wavelet transform as;
Wavelet coefficients for every (a, b) combination whereas in discrete wavelet transform, we find wavelet coefficients only at very few points by the dots and the wavelets that follow these values are given by;
These wavelet coefficient for all and produce an
orthonormal basis. We call as mother wavelet. Other wavelets are produced by translation and dilation of mother wavelet. The wavelet transform of a signal captures the localized time frequency information of the signal. Suppose
we are given a signal or sequences of data
sampled at regular time interval t . is split into a
“blurred” version a1 at the coarser intervalt2and “detail” d1 at scale t . This process is repeated and gives a sequence , , , , ,…..of more and more blurred
versions together with the details , , , ,
…….removed at every scale ( in and ).
Here s are approximation and details of original
signal. After N iteration the original signal can be reconstructed as
METHODOLOGY
The primary and most important work in the spectral analysis of any signal using wavelet transforms is the selection of suitable wavelet according to the signal. Suitable wavelet is selected on the basis of compatibility with signal characteristics. Accurate wavelet selection retains the original signal and also enhances the frequency spectrum of reconstructed signal. Wavelet extracts both time evolution and frequency composition of a signal. A multiresolution analysis
for introduced by S. G. Mallat, 1989, consists of a
Sequence , of closed subspaces of . Let f (x) be a
function in . We can write fxin space,
Since
where
Therefore
where
= ,
and
=
Here , , , , , , , are approximations of
signal and , , , , , , , are details of
signal at various scale or time frames. A signal can be decomposed as in simplest form;
where and are called Approximation and Details of the
given signal . Approximation is average of the signal and hence represents low frequency components, while Detail is the difference of the signal and hence represents high frequency components. Detail plays very important role and provides hidden information of any signal. Skewness is a measure of symmetry, or more precisely, the lack of symmetry. A distribution, or data set, is symmetric if it looks the same to the left and right of the centre point. Kurtosis is a measure of whether the data are peaked or flat relative to a normal distribution. That is, data sets with high kurtosis tend to have a distinct peak near the mean, decline rather rapidly, and have heavy tails. Data sets with low kurtosis tend to have a flat top near the mean rather than a sharp peak (M. Rockinger
et al., 2002 and D. Telloni et al., 2009)).
RESULTS AND DISCUSSION
Our study area is Anand Vihar, Delhi and we have used data (online) observed at DPCC, Anand Vihar. We have taken average quantity of NO2for a day from 01-07-2016 to 13-03-2017.
Fig. (1) Average NO2(in ppb)
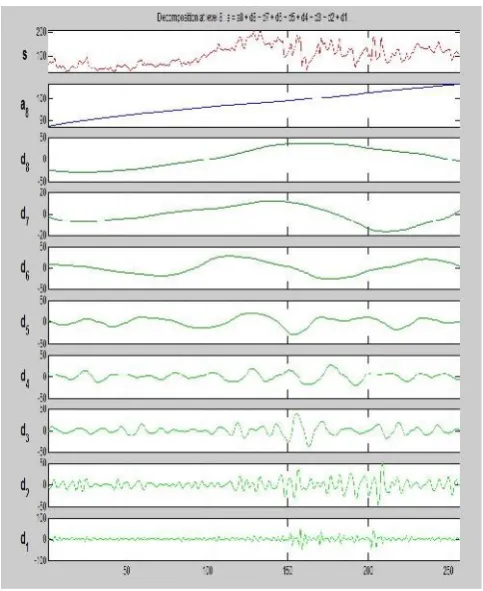
In above figure, the quantitative behaviour of NO2for given time period is shown. For more detailed investigation, we decompose the time series of NO2at different scale by using discrete wavelet transform (Daubechies 4 level 8 (I. Daubechies, 1992). A full decomposition of NO2time series is shown in Fig. (2). In decomposition figures is
approximation at level 8 while , , , , , ,
and are details of the of NO2time series at different time modes. Original time series is the average value of NO2, taken as one day interval. Approximation a8 represents the behaviour of the signal S at level 8.
Fig. (2) Wavelet decomposition of time series of NO2
Fig. (3) Histogram and cumulative histogram
While details exhibits per day variation, shows 2-days
, , , and are variation in the value of NO2in 8, 16, 32, 64, and 128 days mode, respectively. The peak in a detail shows rapid fall or rise in the value of NO2in that time mode. The measurement of NO2 depends on anthropogenic driving forces. Fluctuation in quantity of NO2over time may be as a result of effluent load. In data analysis, the low-frequency content of the signal is an important part, because it gives the identity of the signal. Trend is the slowest part of the signal means lowest frequency part of the signal. In wavelet analysis terms, this corresponds to the greatest scale value. As the scale increases, the resolution decreases, producing a better estimate of the unknown trend. A trend of the NO2 signal exhibits in fig. (3). Histogram depicts the trends of average value of NO2for Approximation. A cumulative histogram is a mapping that counts the cumulative number of observations in all of the bins up to the specified bin. The histogram provides important information about the shape of a distribution. A variance in the value of NO2during time interval (01-07-2016 to 13-03-2017) in individual sampling spot is clearly depicts in approximation of the decomposition. We have calculated value of skewness parameter for ground level Nitrogen Dioxide 0.33455 and Kurtosis parameter -0.73358. Positive value of skewness indicates that data are skewed right. The behaviour of skewness parameter tells about the intermittency phenomenon.
Conclusion
The wavelet method allows the decomposition of signal according to different frequency levels which characterize the intensity of natural and man-made disturbances. A histogram is a graphical representation showing a visual impression of the distribution of data. According to the behaviour studied, it is possible to conjecture that the difference between all-time series can be directly associated with the large number of anthropogenic activity. Taking into account these results we have shown, the wavelet analytical approach provides a simple and accurate framework for modelling the statistical behaviour of NO2variation. Global Environmental Changes is one of the most interesting fields for atmospheric environmental physics. Wavelet Transforms provide a spectra-analytical tool and allow the extraction of the space time evolution of the Environmental Changes. Positive value of skewness for ground level NO2 indicates that data are skewed right. The behaviour of skewness parameter tells about the intermittency phenomenon. The histogram is an effective graphical technique for showing both the skewness and kurtosis of data set.
REFERENCES
Antoine, J. P. 2004. Wavelet analysis: A new tool in Physics,
Wavelets in Physics, Van Der Berg, J. C., ed., pp. 9-21.
Beirle, S., Platt, U., Wenig, M. and Wagner, T. 2003. Weekly cycle of NO2 by GOME measurements: A signature of anthropogenic sources, Atmos. Chem. Phys., Vol. 3, pp. 2225–2232.
Bunde, A., Havlin, S., Koscielny-Bunde, E. and Schellnhuber, H. J. 2001. Long term persistence in the atmosphere: Global laws and tests of climate models, Physica A, Stat.
Mech. Apps Vol. 302, pp. 255-267.
Clapp, L. J. and Jenkin, M. E. 2001. Analysis of the relationship between ambient levels of O3, NO2 and NO
as a function of NOx in the UK, Atmos. Environ., Vol. 35, pp. 6391–6405.
Comrie, A. C. 1997. Comparing neural networks and regression models for ozone forecasting, J. of Air and
Waste Management Ass., Vol. 47, 653-663 (1997).
Daubechies, I. 1992. Ten lectures on wavelets, CBS-NSF,
Regional Conference in Applied Mathematics, SIAM
Philadelphia, Vol. 61, pp. 278-285.
Dobrovolski, S. G. 2009. Stochastic Climate Theory, Models and Applications, Nerlin-Heidelberg, Springer.
Farge, M. 1992. Wavelet transforms and their applications to turbulence, Annu. Rev. Fluid Mech., Vol. 24, pp. 395–457. Flemming, J., Stern, R. and Yamartino, R. J. 2005. A new air quality regime classification scheme for O3, NO2, SO2
and PM10 observations sites, Atmos. Environ., Vol. 39, pp. 6121–6129.
Grinsted, A., Moore, J. C. and Jevrejeva, S. 2004. Application of the cross wavelet transform and wavelet coherence to geophysical time series, Nonl. Proc. Geophy., Vol. 11, pp. 561-566.
Jacobson, M. J. 199., Development and application of new air pollution modelling system II, Aerosol Module structure and Design, Atmos. Environ., Vol. 31, pp. 131-144. Kumar, A., Kumar, S. and Pathak, J. K. 2015. Spectral
Analysis of River Ramganga Hydraulics using Discrete wavelet transform, Proceedings of International Conference of Advance Research and Innovation,
pp.370-373, 2015.
Kumar, S., Kumar, A., Kumar, R., Pathak, J. K. and Alam, M. 2014. Spectral Analysis of Biochemical Oxygen Demand in River Water: An Analytical Approach of Discrete Wavelet Transform, American Journal of Mathematics
and Statistics, Vol. 4(2), pp. 107-112.
Lucero, O. A. and Rodriguez, N. C. 2000. Statistical characteristics of interdecadal fluctuations in the southern oscillation and the surface temperature of the equatorial pacific, Atmos. Res., Vol. 54, pp. 87-104.
Mallat, S. G. 1989. A theory for multiresolution signal decomposition; The wavelet representation, IEEE Trans.
On Pattern Analysis and Machine Intelligence, Vol. 11,
pp. 674-693.
Mann, M. E. and Lee, J. M. 1996. Robust estimation of background noise and signal detection in climate time series, Climate Change, Vol. 33, 409-445.
Oh, H.S., Amman, C. M., Naveau, P., Nychika, D. and Otto-Bliesner, B. L. 2002. Multiresolution time series analysis applied to Solar irradiance and climate reconstructions, J.
Atmos. Phy., Vol. 65, pp. 191-201.
Rockinger, M. and Jondeau, E. 2002. Entropy Densities with an Application to Autoregressive Conditional Skewness and Kurtosis, Journal of Econometrics Vol. 106(1), pp. 119—142.
Telloni, D., Bruno, R., Carbone, V., Antonucci1, E. and Amicis, R. D' 2009. Statistics of density fluctuations during the transition from the outer solar corona to the interplanetary space, The Astrophysical Journal Vol. 706, 238-243.
Walnut, D. 2001. An introduction to wavelet analysis, Applied
and Numerical Harmonic Analysis, Boston, Birkhauser,
pp. 335-363.
Zwiers, F. W. and Kharin, V. V. 1996. Interocomparision of interannual variability and potential predictability, An AMIP diagnostic project, Clim. Dyn., Vol. 14, pp. 517-528.