http://www.sciencepublishinggroup.com/j/ijdsa doi: 10.11648/j.ijdsa.20190506.13
ISSN: 2575-1883 (Print); ISSN: 2575-1891 (Online)
Review Article
Issues of Class Imbalance in Classification of Binary Data:
A Review
Samuel Adewale Aderoju
1, *, Emmanuel Teju Jolayemi
21
Department of Statistics and Mathematical Sciences, Kwara State University, Ilorin, Nigeria
2
Department of Statistics, University of Ilorin, Ilorin, Nigeria
Email address:
*
Corresponding author
To cite this article:
Samuel Adewale Aderoju, Emmanuel Teju Jolayemi. Issues of Class Imbalance in Classification of Binary Data: A Review. International Journal of Data Science and Analysis. Vol. 5, No. 6, 2019, pp. 123-127. doi: 10.11648/j.ijdsa.20190506.13
Received: September 25, 2019; Accepted: November 8, 2019; Published: November 17, 2019
Abstract:
Handling classification issues of class imbalance data has gained attentions of researchers in the last few years. Class imbalance problem evolves when one of two classes has more sample than the other class. The class with more sample is called major class while the other one is referred to as minor class. The most classification or predicting models are more focusing on classifying or predicting the major class correctly, ignoring the minor class. In this paper, various data pre-processing approaches to improve accuracy of the models were reviewed with application to terminated pregnancy data. The data were extracted from the 2013 Nigeria Demographic and Health Survey (NDHS). The response variable is “terminated pregnancy” (asking women of reproductive age whether they have ever experienced terminated pregnancy or not), which has two possible classes (“YES” or “NO”) that exhibited class imbalanced. The major class (“NO”) is 86.82% (of the sample) representing Nigerian women of age 15 – 49 years who had never experience terminated pregnancy while the other category (minor class) is 13.18%. Hence, different resampling techniques were exploited to handle the problem and to improve the model performance. Synthetic Minority Oversampling Technique (SMOTE) improved the model best among the resampling techniques considered. The following socio-demographic factors: age, age at first birth, residential area, region, education level of women were significantly associated with having terminated pregnancy in Nigeria.Keywords:
Classification, Class Imbalanced, Resampling Techniques, Logistic Model, Terminated Pregnancy1. Introduction
In real life applications, more often than none, large amount of data is generated with skewed distribution. Classification and/or prediction usually suffer from data exhibiting class imbalance. When data have imbalance classes, prediction and classification usually favour major class while minor class suffer. A data set is said to be imbalance if sample from one class is significantly higher compared to other class [1, 2]. In this case, the class with higher observations is referred to as major class while the class with few observation is referred to as minor class [3, 2].
In applications such as: where medical diagnosis prediction of uncommon but significant and unignorable disease is more crucial than regular treatment; detecting fraud
in banking operations, detecting network intrusions [4]; managing risk and predicting failures of technical equipment [3]; text classification [5], credit scoring [6]. In such situations most of the classifier are biased towards the major classes and hence show very poor classification rates on minor classes [3]. It is not uncommon that model predicts everything as major class and ignores the minor class out-rightly. For such problems, it is required to build models with reasonable performance on the minority class.
both. The process of addition of new sample to existing minor class is known as over-sampling while process of subtracting sample from major class is known as under-sampling. Second method for solving class imbalance problem is that of creating or modifying algorithm [2]. Applying an algorithm alone is not good idea because size of data and class imbalance ratio may be high and hence a new technique which is the combination of sampling method with algorithm is used [8].
Longadge et al., [3] noted that in classification, algorithm generally gives more importance to correctly classify the major class samples. In many applications misclassifying a rare event (minor class) can result to more serious problem than common event [9]. “For example in medical diagnosis in case of cancerous cell detection, misclassifying non-cancerous cells may leads to some additional clinical testing but misclassifying cancerous cells leads to very serious health risks. However in classification problems with imbalanced data, the minor class examples are more likely to be misclassified than the major class examples, due to their design principles, most of the machine learning algorithms optimizes the overall classification accuracy which results in misclassification of minor classes” [3].
The paper is organized as follows: section two contains logistic regression model. Section three gives the review of data reprocessing approach to improve model’s performance. Applications of the techniques to pregnancy terminated data are discussed in section four while discussion (of the results) and conclusion are presented in section five.
2. Logistic Regression
In machine learning, generalized linear models have always been one of the most popular learning methods. They are intuitively easy to explain and the implementation is straightforward. One of the most common classification
models is the logistic regression, which is presented as [10]:
= 1| = = (1)
where = + + +. . . + .
Note that,
= 1 = "0 = "No" ℎ $ ! " !#$% & !'#$ & "! ($ %)" ℎ ! " !#$% & !'#$ & "! ($ %)
Obviously, equation (1) can be expressed as:
log . / 0 = ln 2 3/34 = (2)
ln 2 3/34 is the log odds or simply the logit, and
, , … are the parameters of the model to be estimated. The logistic regression model in equation (2) does not assume normality of error terms nor does it assume constant error variances. The result in equation (2) can be re-presented as:
= 7! = 8 (3) ln 7 = + + +. . . + (4)
where odds refers to the odds of Y being equal to (1).
From equation (2) and (4), it is clear that logistic regression model has log-odds (left hand side of the equation) that are linear in X.
The usual procedure to fit the logistic regression model is via maximum likelihood estimation using the probability function defined in equation (4), which is commonly implemented in most statistical softwares like R, STATA, SPSS and so on.
The accuracy of your model can be obtained as:
9%%:! %) =;<= >?@ABAC ;> ;<= D EFBAC @ ;D GFH@ >?@ABAC G> GFH@ D EFBAC @ GD;<= >?@ABAC ;> ;<= D EFBAC @ ;D , (5)
where the TP is the sum of instances of class 1 (that is, “YES”) correctly predicted, TN is the sum of instances of class 0 (that is, “NO”) correctly predicted, the FP is the sum of instances of class 0 classified as class 1, and the where the FN is the sum of instances of class 1 classified as class 0.
From confusion matrix, Specificity and Sensitivity can be derived as illustrated below:
Table 1. Confusion Matrix.
Predicted
Yes No
Actual Yes TP FN
No FP TN
I $ #&# #&) JK L!: 7 #&# K & =;> GD;> (6)
I" %#M#%#&) JK L!: N ( &# K & =;D G>;D (7)
O1 − I $ #&# #&)Q JK R S N ( &# K & =;> GDGD (8)
O1 − I" %#M#%#&)Q JK R S 7 #&# K & =G> ;DG> (9)
! %# #7$ =;> G>;> (10)
K % SS =;> GD;> (11)
3. Data Pre-Processing Approach to
Improve Model’s Performance
The literature survey suggests many algorithm and techniques that solve the problem of imbalance distribution of sample. Of the approaches, resampling methods are discussed in this study. Sampling techniques are used to solve the problems with the distribution of a dataset, sampling techniques involve artificially re-sampling the data set, it also known as data pre-processing method [3]. Sampling can be achieved by: under-sampling the major class, oversampling the minor class, or by combining over and under-sampling techniques.
Under-sampling: The most important method in under-sampling is random under-sampling method which trying to balance the distribution of class by randomly removing major class sample. The problem with this method is loss of valuable information [3].
Over-sampling: Random Oversampling methods also help to achieve balance class distribution by replicating minor class sample. There is no need to add extra information, it reuse the data [8]. However, this problem can be solved by generating new synthetic data of minor sample. Chawla et al., [5] proposed a powerful over-sampling approach called
“SMOTE”, which stands for Synthetic Minority
Oversampling Technique. SMOTE generates synthetic minority examples to over-sample the minor class. In this method learning process consume more time because original data set contain very small number of minority samples [3].
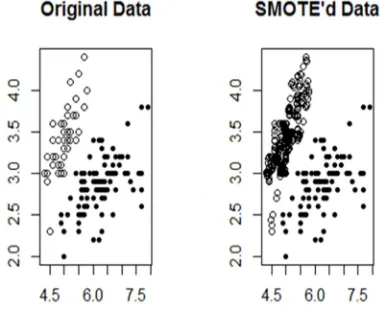
However, considering an example with a data set created artificially from the IRIS available in “DMwR” package in R for illustration [13]. The figure below (Figure 1) gives a visual check of new data created with “SMOTE” function. The first figure tagged “Original Data” is the raw data before
resampling while the other figure on the right hand side is the plot of resampled data using function “SMOTE” in package in R version 3.5.2. [14]
Figure 1. The plots of original data and “SMOTE’d” data.
4. Application to Pregnancy Terminated
Data
The data from the 2013 Nigeria Demographic and Health Survey (NDHS) [15] were used in this study. The data comprises of 27,440 observations with eight variables. The summary of the variables are presented in Table 2. The female respondents of ages ranging between 15 – 49 years were interviewed. Of the 27,440 respondents, 3616 (13.18%) reported “Yes” and 23824 (86.82%) reported “No” to ever having terminated a pregnancy. Obviously, the “Yes” class is minor class while “No” class is major class. The sociodemographic factors: age, age at first birth, region, etc of the respondents are explanatory variables.
Table 2. Summary of data used in the study.
Variable name Description Coding structure count
Pregnancy Termination Ever had a pregnancy terminated? No = 0 No = 23824 (86.82%)
Yes = 1 Yes = 3616 (13.18%)
Age Age of the respondents Ranging from 15 – 49 years
Region Geo-political zone
North Central (NC) NC = 4188
North East (NE) NE = 5094
North West (NW) NW = 7726
South East (SE) SE = 2621
South South (SS) SS = 3827
South West (SW) SW = 3984
Residence Place of residence Rural Rural: 17663
Urban Urban: 9777
Education Highest education level
No Education 11946
Primary 5950
Secondary 7473
Higher 2071
Wealth Financial status of the respondents
Poor 11370
Middle 5587
Rich 10483
Age at first birth Respondent’s age at first child birth Ranging from 12 – 45 years
All statistical analysis were performed using R version 3.5.2 [14] applying logistic regression model. The two classes in the outcome variable are heavily imbalance. Majority of women (‘No’ = 86.81%) had never experienced pregnancy termination while minority (‘Yes’ = 13.19%) had ever experienced pregnancy termination. Hence, some resampling techniques were applied using ‘ROSE’, ‘DMwR’ and ‘caret’ packages in R [16, 13, 17] to improve the model sensitivity and precision which were initially zero.
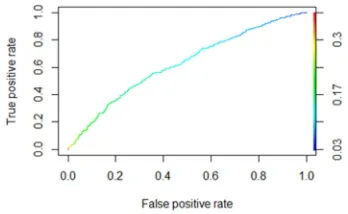
Figure 2. ROC curve.
Table 3. The models’ performance at different ratios of train to test data.
P Models Accuracy B. Acc. Sensitivity Specificity Precision TN Recall AUC
Train: 80%
Raw 86.45 50 0 100 0 86.45 0 61.18
Down 57.58 58.08 58.76 57.40 17.78 89.87 58.76 61.11
Up 57.7 54.35 50.0 58.71 13.62 90.01 50.0 61.18
SMOTE 74.10 64.62 50.0 79.25 34.0 88.13 50.0 60.11
Both 59.47 55.40 50 60.80 15.18 89.65 50.0 61.27
Table 4. The output of Logistic regression.
variables Est. SE Z Pvalue
resid
Cons. -1.884 0.09155 -20.579 <0.001
age 0.03518 0.00168 20.984 <0.001
afb -0.0133 0.00344 -3.86 <0.001
urb 0.40557 0.03078 13.175 <0.001
region
NE 0.60708 0.04927 12.321 <0.001
NW 0.20259 0.04867 4.163 <0.001
SE 0.35882 0.05544 6.472 <0.001
SS 0.2256 0.05256 4.292 <0.001
SW 0.23063 0.05163 4.467 <0.001
wealth mid 0.08861 0.03941 2.249 0.02454
ric -0.0159 0.03765 -0.422 0.67336
edu
pry 0.33094 0.0387 8.552 <0.001
sec 0.40618 0.03951 10.28 <0.001
high 0.36463 0.05836 6.248 <0.001
The logistic regression model is:
ln 7 P1.88 0.035 ( P 0.013 MW 0.406:!W 0.607 N[ 0.203 N] 0.359 I[ 0.226 II
0.231 I] 0.089'# P 0.016!#% 0.331"!) 0.406 % 0.365 #(
5. Discussion and Conclusion
We used 80% training data as shown in Table 3. Based on model’s “Accuracy”, “Precision” and “Specificity”, the results show that, of all the resampling methods used to improve the model’s performance, SMOTE yields better result compared to the random resampling techniques considered. The model’s “Sensitivity”, and “Recall” values improved from 0% to 50% and 32.43% respectively after correcting for the imbalance issue in the data using SMOTE. However, it is worthy to note that all the resampling methods used improved the performance of the model better than when the raw data were fitted. The ROC curve is presented in Figure 2 and AUC values given in Table 3.
Moreover, the results in Table 4 shows that keeping other factors constant, at a unit increase in age at first birth the odds of having terminated pregnancy decreases by 3.6%; at a
unit increase in age the odds of having terminated pregnancy increases by 1.3%; Women living in urban area 50% odds of experiencing pregnancy termination compare to women living in rural area; women from North East (NE), North West (NW), South East (SE), South South (SS) and South West (SW) were 83.5%, 22.5%, 43.2%, 25.3% and 25.9%, respectively, more likely to experience pregnancy termination than women from North Central (NC); women with primary, secondary and higher levels of education were 39.2%, 50.1% and 44%, respectively, more likely to experience pregnancy termination compared to women with no education. The wealth status is partially insignificant factor.
Conflicts of Interest
References
[1] Wang, S., Member, and Xin Yao, (2012), “Multiclass Imbalance Problems: Analysis and Potential Solutions”, IEEE Transactions On Systems, Man, And Cybernetics—Part B: Cybernetics, Vol. 42, No. 4.
[2] Nitesh V. Chawla, Nathalie Japkowicz, Aleksander Ko lcz, (2004) “Editorial: Special Issue on Learning from Imbalanced Data Sets”; ACM SIGKDD Explorations Newsletter; Volume 6, Issue 1 - Page 1-6. Doi: 10.1145/1007730.1007733.
[3] Longadge. R., Dongre. S. S., and Malik, L., (2013), Class Imbalance Problem in Data Mining: Review; International Journal of Computer Science and Network (IJCSN); Vol. 2, Issue 1.
[4] Galar, M. and Fransico, (2012) “A review on Ensembles for the class Imbalance Problem: Bagging, Boosting and Hybrid Based Approaches” IEEE Transactions on Systems, Man, And Cybernetics—Part C: Application and Reviews, Vol. 42, No. 4.
[5] Chawla V. N., Bowyer K. W., Hall L. O., Kegelmeyer W. P., (2002), SMOTE: Synthetic Minority Over-Sampling Technique, Journal of Artificial Intelligence Research, 16 (2002), 321-357.
[6] Brown, I. and C. Mues, (2012), An Experimental Comparison of Classification Algorithms for Imbalanced Credit Scoring Data Sets, Expert Systems withApplications, 39 (2012), no. 3, 3446-3453. http://dx.doi.org/10.1016/j.eswa.2011.09.033. [7] Seiffert C., Taghi M. Khoshgoftaar, Jason Van Hulse, Amri
Napolitano, (2008) “A Comparative Study of Data Sampling and Cost Sensitive Learning”, IEEE International Conference on Data Mining Workshops. 15-19.
[8] Liu, P., Lijun Cai, Yong Wang, Longbo Zhang, (2010) “Classifying Skewed Data Streams Based on Reusing Data”; International Conference on Computer Application and System Modeling (ICCASM 2010).
[9] Tang, Y., Zhang, Y., Chawla, N. V., and Sven Krasser; (2009), “Correspondence SVMs Modeling for Highly Imbalanced Classification”; IEEE Transactions on Systems, Man, and Cybernetics—Part B: Cybernetics, Vol. 39, No. 1.
[10] Agresti, A., (2002) Categorical Data Analysis, John Willey & Sons, Inc, New York.
[11] Fawcett, T., (2006), An Introduction to ROC analysis, Pattern
Recognition Letters, 27, 861-874.
http://dx.doi.org/10.1016/j.patrec.2005.10.010.
[12] Hanifah, F. S, Wijayanto, H. and Kurnia, A. (2015). SMOTE Bagging Algorithm for Imbalanced Dataset in Logistic Regression Analysis. Applied Mathematical Sciences, Vol. 9,
2015, no. 138, 6857-6865.
http://dx.doi.org/10.12988/ams.2015.58562.
[13] Torgo, L. (2010). Data Mining with R, learning with case studies Chapman and Hall/CRC. URL: http://www.dcc.fc.up.pt/~ltorgo/DataMiningWithR.
[14] R Core Team (2018). R: A language and environment for statistical computing. R Foundation for Statistical Computing, Vienna, Austria. URL https://www.R-project.org/.
[15] National Population Commission (NPC) [Nigeria] and ICF International. 2014. Nigeria Demographic andHealth Survey 2013. Abuja, Nigeria, and Rockville, Maryland, USA: NPC and ICF International.
[16] Lunardon, Giovanna Menardi, and Nicola Torelli (2014). ROSE: a Package for Binary Imbalanced Learning. R Journal, 6 (1), 82-92.