R E S E A R C H
Open Access
Evaluation of a questionnaire to assess
nutritional knowledge, attitudes and
practices in a Thai population
Rungnapa Pongkiatchai
1, Rewadee Chongsuwat
1*, Nopporn Howteerakul
2, Patcharanee Pavadhgul
1,
William Ollier
3and Artitaya Lophatananon
3Abstract
Background:The rapid increase in non-communicable chronic diseases in people of working age has had a major effect on health care utilization, productivity and economy. Lifestyle and diet are recognized as being major risk determinants involved. Disease prevention strategies need to be based on people’s understanding of nutritional knowledge, attitudes and practice. This study evaluates the validity of a new nutritional knowledge and practice questionnaire specifically developed for assessing individuals of working age in a Thai population.
Methods: The questionnaire was constructed and based on previous relevant literature and its content validity was scrutinized by an expert panel. An exploratory factor analysis (EFA) was performed to reduce the number of questions included. Subsequently, data from a cross-sectional study of 1,032 participants were used to evaluate the reliability and validity of this questionnaire. The validity of the questionnaire constructed for assessing knowledge and attitude was evaluated using Confirmatory Factor Analysis (CFA). For the practice component, set criteria were applied to determine the final variables used.
Results:CFA of the nutritional knowledge component suggested that all the variables in the model fitted with the data (χ2= 80.17,df= 66,p> 0.05, CFI = 0.99, RMSEA = 0.01, SRMR = 0.02). The CFA final model for the nutritional knowledge included three factors (food recommendation, nutrients related to diseases, and healthy diet) with a total of 14 questions. For nutrition attitude, CFA also revealed a good fit (χ2= 178.14,df= 93,p< 0.001, CFI = 0.99, RMSEA = 0.03, SRMR = 0.03). The final CFA model for nutritional attitude included three factors (food choice, healthy diet and food recommendation) with a total of 16 questions. For practice items, the number of questions was reduced from 76 to 60.
Conclusions:Questionnaire development should use a logical, systematic and structured approach. Results from our evaluation process demonstrates the construction validity of the nutritional knowledge and practice questionnaire developed. This questionnaire can be further modified for use in other countries within the region.
Keywords: Chronic disease, Nutritional knowledge, Nutritional attitude, Nutritional practice, Working age
© The Author(s). 2019Open AccessThis article is distributed under the terms of the Creative Commons Attribution 4.0 International License (http://creativecommons.org/licenses/by/4.0/), which permits unrestricted use, distribution, and reproduction in any medium, provided you give appropriate credit to the original author(s) and the source, provide a link to the Creative Commons license, and indicate if changes were made. The Creative Commons Public Domain Dedication waiver (http://creativecommons.org/publicdomain/zero/1.0/) applies to the data made available in this article, unless otherwise stated. * Correspondence:[email protected]
1Department of Nutrition, Faculty of Public Health, Mahidol University, 420/1
Background
Changes in society and the global economy during the past two to three decades have resulted in significant changes in the nutritional status and health of popula-tions, particularly in developing countries [1]. Thailand is no exception; this country has undergone significant social and economic changes since 1997 [2]. These changes have led to the increasing introduction of a western lifestyle where Thai people consume higher fat foods and “fast-foods” together with an increasing con-sumption of a less healthy diet and a more sedentary life-style [1]. These are major causes of non-communicable diseases (NCDs) such as cardiovascular disease, osteopor-osis, and diabetes [3–5]. Thus changes in society have led to subsequent changes in disease prevalence; reciprocally, increases in chronic disease prevalence then changes soci-ety further [6].
Level of educational attainment is one of a number of factors that influence nutritional knowledge. Further-more, nutritional knowledge and attitude are correlated with each other and both play key roles in influencing nutritional behavior [7]. Given a changing and increasing trend of western lifestyle in Thailand, it is important to gain a clear insight into the population-based knowledge of diet and the changing patterns of behavior, both in-creasing risk of chronic disease development, especially in those of working age [4]. This knowledge will facili-tate the introduction of interventions that prevent or reduce future disease development. Epidemiological studies into the relationship between chronic disease de-velopment and nutritional risk exposures can only be achieved through the appropriate collection of robust in-formation on the factors that determine our knowledge, attitudes, practices and preferences relating to food and nutrition. Such data can only be generated by the devel-opment of appropriate questionnaires and these have to be validated and assessed within the social context of the populations they are designed for. This study evalu-ates a questionnaire specifically constructed to assess nutritional knowledge, attitude, and practice in a work-ing Thai population.
Methods Study design
This study was conducted using a cross-sectional ap-proach. Study approval was gained from the Ethical Re-view Committee for Human Research, Faculty of Public Health, Mahidol University, Thailand (COA. No. MUPH 2014–189). Data were collected using the nutritional knowledge and practice self-administered questionnaire for the period from October 2015 to September 2016.
Participants were recruited from the Northern, Southern, Northeastern and Central regions of Thailand between January and September of 2015. The criteria for study
inclusion were (i) Thai nationality (ii) living in a selected area for a minimum of 3 months (iii) being aged between 18 and 60 years (iv) ability to read and write Thai (v) being in good health and not affected with diseases such as can-cer and cardiovascular disease (vi) giving informed consent.
Questionnaire development
Prior to this study, a nutritional knowledge and practice questionnaire was developed by combining a trawl of relevant information in peer-reviewed published litera-ture with that gained from discussion with an expert panel. The initial questionnaire list of 131 questions/ items aimed at measuring nutritional knowledge, atti-tude and practice in Thai people working age. The knowledge component comprised multiple-choice ques-tions, each with 4 answers. Correct answers scored one point and incorrect answers zero points. All answers re-ported as ‘don’t know’ were coded as incorrect. For the
“attitude” component a 5-point scale ranging from 1 (strongly disagree) to 5 (strongly agree) was used. A Likert scale was used to quantify the results of“attitude”. For “nutritional practice” (P), the response scale was classified as: seldom eaten (0-1 days/week), often eaten (2–3 days/week) and always eaten (4–7 days/week).
Validation process
Prior to the validity process, Exploratory Factor Analysis (EFA) was employed to both identify important factors and to selectively reduce the number of items in the questionnaire. The process of questionnaire develop-ment is depicted in the flow chart (see Additional file1: Figure S1). Results from EFA were used to derive a sub-sequent version of the questionnaire (see Additional file2: Table S1 and S2). In this article, we present results from data collected using the refined version of the question-naire after EFA analysis. Data were collected from 1080 subjects residing in the Northern, Northeast, Southern, and Central regions of Thailand. The participants’ weight and height were also measured. Body mass index was computed and classified into 4 categories according to World Health Organization recommendation on body-mass index (BMI) cut-off points for determining overweight and obesity in Asian populations [8, 9]. 48 subjects were excluded due to missing data. Data from 1032 subjects were included in the analysis.
Data analysis
the factors they were designed to measure [10]. Further-more, these factors should be correlated. Finally, errors across variables should be uncorrelated. It is noted that smaller factor loadings result in larger error variances, however this can be improved by re-specification of the model. To estimate the parameters of the model, the model itself must be properly defined.“Goodness-of-fit” measures underlying the analysis of the CFA [11], in-cluded chi-square (X2) which shows the difference be-tween observed and expected covariance matrices; values closer to zero indicate a better fit. Researchers may fail to reject an inappropriate model where sample sizes are small and reject an appropriate model where sample sizes are large. Consequently, other measures of
‘goodness of fit’ have been developed. Comparative fit index (CFI) analyzes the model fit by examining the dis-crepancy between the data and the hypothesized model, while adjusting for the issues of sample size inherent in the chi-squared test of model fit, and the normed fit index. The standardized root-mean-square residual (SRMR) is the square root of the discrepancy between the sample covariance matrix and the model covariance matrix. The root mean square error of approximation (RMSEA) avoids issues due to sample size by analyzing the discrepancy between the hypothesized model, with optimally chosen parameter estimates, and the popula-tion covariance matrix. The accepted approach for asses-sing goodness of fit requires that the chi-square (X2) analysis should have a non-significant p-value and aX2/
dfvalue that is at 3 or below. It is important to consider that the modifiedX2from re-specification is usually up-wardly biased with sample size [12, 13]. The calculated value for CFI should lie between 0 and 1, with a value over 0.90 indicating a good fit. A value for SRMR should be at 0.08 or below. RMSEA values of approximately 0.06 or below indicates an acceptable fit, with values 0.05 or less, indicating good fit [14]. If the analysis indicated a possible data-model misfit, model modification was applied. This modification involved further re-specification by (i) adding a parameter in the model with a large modification index (MI) and (ii) deleting a parameter from the model with a non-significant path.
For the“practice component”, the items included were based on a food frequency questionnaire (FFQ) [15]. The criteria used to exclude food items included: (i) food items deemed as being seasonal food, (ii) any food item that was consumed in less than 60% of our subjects, (iii) food items that had never been consumed by study subjects. This process was used to reduce and refine of items included.
Results
Demographic characteristic
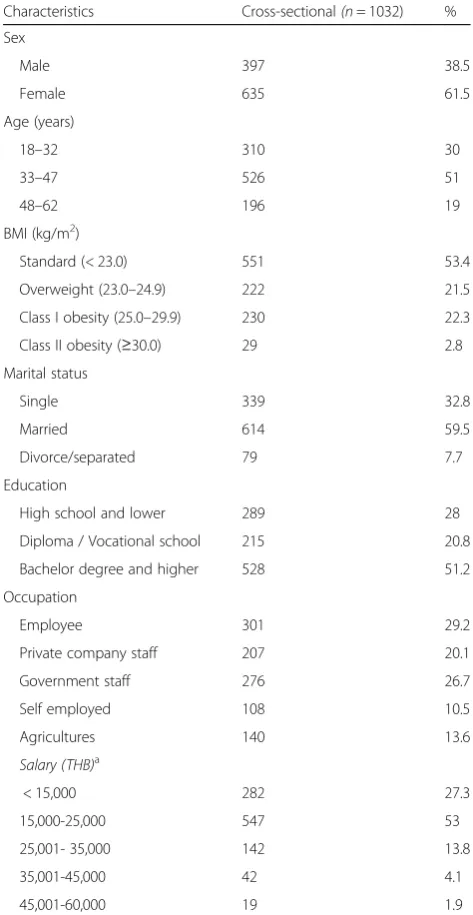
Demographic characteristic of the population sample are summarized in Table 1. 1,032 out of 1,080 participants
completed the nutritional knowledge and practice ques-tionnaire, (response rate 95.6%). Most of participants were female (62%), married (59.5%) and had attained an undergraduate university degree or higher (51.2%). The participants’age ranged from 18 to 62 years with a mean age of 38 years. For BMI, 21.5% of subjects were classi-fied as overweight, 22.3% were class I obese and 2.8% were class II obese.
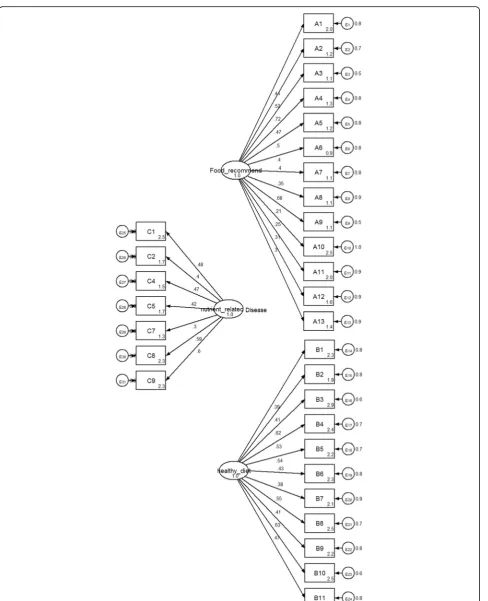
CFA results for nutritional knowledge
The initial fitted hypothesized model (3 factors; food rec-ommendation, nutrient related to diseases and healthy diet, with a total of 31 items) suggested a model misfit
Table 1General characteristics of participants
Characteristics Cross-sectional(n= 1032) %
Sex
Male 397 38.5
Female 635 61.5
Age (years)
18–32 310 30
33–47 526 51
48–62 196 19
BMI (kg/m2)
Standard (< 23.0) 551 53.4
Overweight (23.0–24.9) 222 21.5
Class I obesity (25.0–29.9) 230 22.3
Class II obesity (≥30.0) 29 2.8
Marital status
Single 339 32.8
Married 614 59.5
Divorce/separated 79 7.7
Education
High school and lower 289 28
Diploma / Vocational school 215 20.8
Bachelor degree and higher 528 51.2
Occupation
Employee 301 29.2
Private company staff 207 20.1
Government staff 276 26.7
Self employed 108 10.5
Agricultures 140 13.6
Salary (THB)a
< 15,000 282 27.3
15,000-25,000 547 53
25,001- 35,000 142 13.8
35,001-45,000 42 4.1
45,001-60,000 19 1.9
a
(χ2)3178.83, df = 434,p-value = 0.000, CFI = 0.59, RMSEA = 0.08 and SRMR =0.14 withχ2/df = 7.32, (Fig.1). The modi-fication indices (MIs) showed the expected parameter change statistics for each item. The model was re-specified and eventually 9 items with a low factor item loading from three factors were excluded. To ensure the model fitted well, covariance values were also added. The final CFA
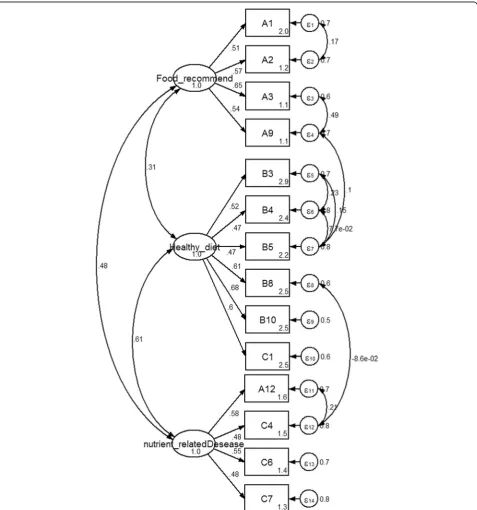
model for “nutritional knowledge” was composed of three factors (food recommendation, nutrient related to diseases and healthy diet) with a total of 14 items. Parameter estima-tion results after model modificaestima-tion revealed a good fit for the model as indicated by a reduced chi-square value (from 465.5 to 80.2 with 66 degrees of freedom, p-value> 0.05). The value of CFI, RMSEA and SRMR were 0.99, 0.01 and
0.02 respectively, indicating a large improvement in the model fit. The parameter estimates of the CFA are shown in Fig.2.
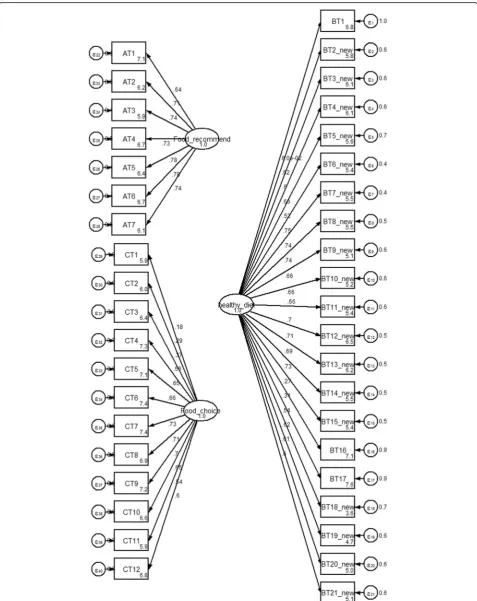
CFA results for nutritional attitude
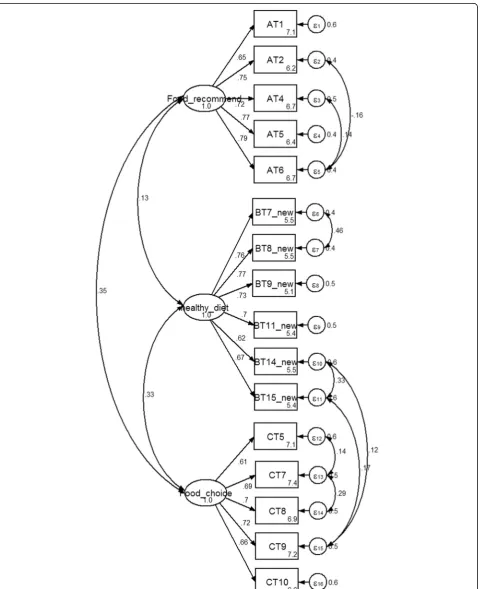
The first hypothesized model consisted of 3 factors (food choice, healthy diet and food recommendation with a total of 40 items), revealed aχ2value of 5503.0, df = 740, p-value = 0.000, CFI = 0.75, RMSEA = 0.08 and SRMR = 0.11 with χ2/df = 7.4 (Fig. 3). The initial model did not fit the sample data. Fifteen items were excluded due to low factor item loading. Any non-significant paths from the three factors were also deleted. Covariance values were added. This procedure significantly improved the model. The final CFA model for the nutritional atti-tude was composed of three factors (food choice, healthy diet and food recommendation with a total of 16 items). The Chi-square value was reduced from 801.1 to 178.1 with 93 degrees of freedom. The three factor model failed to achieve an exact fit (χ2/df = 1.9,
p< 0.05). An acceptable fit was indicated by CFI, RMSEA and SRMR values (0.99, 0.03 and 0.03, re-spectively) [16]. All of the standardized factor load-ings were greater than 0.4. The parameter estimates of the CFA are shown in Fig. 4.
The results of nutritional practice (FFQ)
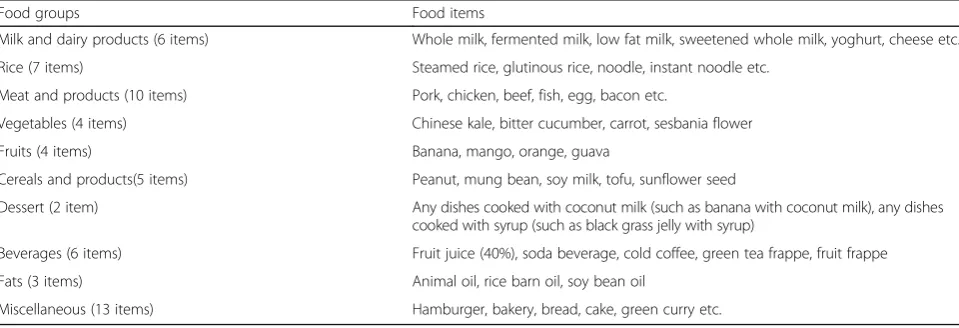
The process of model refinement reduced the food items (practice) from the original 76 to 60 items, including 6 items on milk and dairy products, 7 items on rice, 10 items on meat and products, 4 items on vegetables, 4 items on fruits, 5 items on cereal, 2 items on dessert, 6 items on beverages, 3 items on fats, 13 items on miscel-laneous (Table2).
Discussion
Previous studies both in Europe and China have assessed nutritional knowledge, attitude and eating behavior using
local inventory questionnaires [17,18]. These studies have focused mainly on either the nutritional knowledge, attitudes and practices of undergraduate students or of elderly populations. In Thailand, previous studies have de-veloped nutritional knowledge attitude and practice ques-tionnaires for specific age groups such as children and the elderly [19, 20] however none has reported instrument validation process.
This study has developed and evaluated the construct validity of the Thai adult nutritional knowledge, attitude and practice questionnaire for just such purposes. Meas-uring nutritional knowledge, attitude and practice in adults is challenging as an appropriate questionnaire has not been available. Other research instruments that exist are well established but are unlikely to be appropriate for Thais [21–23]. The nutritional knowledge attitude and practice questionnaire has social and cultural fea-tures that should be considered in a number of dimen-sions. To obtain information on nutritional behavior in any population, the instrument should include questions related to knowledge and attitudes related to food con-sumption and practice [24].
Confirmatory factor analysis can be used to verify the structure of a set of observed variables in order to deter-mine whether the extracted items show acceptable fit for the data collected. Cut-off points of model fit criteria can be set and used to determine acceptable values for the model of nutritional knowledge [25–27]. CFA is often used to confirm hypotheses and uses pathway ana-lysis diagrams to represent variables and factors [28]. In this study, the CFA results helped evaluate the nutri-tional attitude structure of the questionnaire. The model showed an acceptable fit with indices close to the nom-inal value. The CFA results for attitude, however, initially failed to fit the collected data as demonstrated by the highly significant Chi-square test for goodness of fit. It has been suggested that this test is overly sensitive to sample size [13, 25, 26]. The highly significant goodness
Table 2Food frequency questionnaire with 60 items
Food groups Food items
Milk and dairy products (6 items) Whole milk, fermented milk, low fat milk, sweetened whole milk, yoghurt, cheese etc.
Rice (7 items) Steamed rice, glutinous rice, noodle, instant noodle etc.
Meat and products (10 items) Pork, chicken, beef, fish, egg, bacon etc.
Vegetables (4 items) Chinese kale, bitter cucumber, carrot, sesbania flower
Fruits (4 items) Banana, mango, orange, guava
Cereals and products(5 items) Peanut, mung bean, soy milk, tofu, sunflower seed
Dessert (2 item) Any dishes cooked with coconut milk (such as banana with coconut milk), any dishes
cooked with syrup (such as black grass jelly with syrup)
Beverages (6 items) Fruit juice (40%), soda beverage, cold coffee, green tea frappe, fruit frappe
Fats (3 items) Animal oil, rice barn oil, soy bean oil
of fit test may have been affected by the external factors such as sample size, the number of parameters and the degrees of freedom to sample size ratio [13, 29]. Never-theless, the other indices suggested an acceptable fit. It was concluded that the nutritional knowledge and atti-tude components of the questionnaire yielded logical construct validity.
With regard to nutritional practice, we applied the food frequency questionnaire to evaluate eating behavior. The food items reported in the FFQ were covered by five food groups and dietary guidelines for Thais [30]. We applied 3 criteria to reduce the number of items. The remaining items are those normally consumed by Thai people.
Our current study still has some limitations as we did not stratify our analysis by gender as a variable. Males and females may potentially display different knowledge and attitudes to nutrition. Future studies should investi-gate this in Thai adults using the nutritional knowledge and practice questionnaire. Furthermore the age range for the adult working population is relatively broad and within this range some variation on attitude and know-ledge relating to nutrition may also exist.
Conclusion
This study demonstrates that final version of the ques-tionnaire has acceptable levels of constructed validity and can be used to assess nutritional knowledge, attitude and practice in a general adult working population of Thais. This questionnaire can be further modified for use in neighboring countries in the region that share a similar culture.
This questionnaire can also be used to identify gaps in the public’s nutritional knowledge and to evaluate the success of public health education campaigns and nutri-tional interventions. It can also identify nutrinutri-tional knowledge and practice determinants associated with diseases risk.
Additional files
Additional file 1:Figure S1.Flow chart describing the development and validation of the NKAP 1 questionnaire. (PDF 13 kb)
Additional file 2:Table S1.Results of the EFA of the nutritional knowledge component in validation study (n= 103)*.Tables S2.Results of EFA of the nutritional attitude component in validation study (n= 103). (PDF 53 kb)
Abbreviations
CFA:Confirmatory Factor Analysis; CFI: Comparative Fit Index; df: Degree of freedom; EFA: Exploratory Factor Analysis; FFQ: Food Frequency questionnaire; RMSEA: Root Mean Square Error of Approximation; SRMR: Standardized Root-Mean-square Residual
Acknowledgments
We extend our appreciation to all study participants. The Faculty of Public Health, Mahidol University financially supported the publication of the study.
Authors’contributions
RP and RC conceived the study concept and design. RP and PP conducted the survey and supervised data collection. RP and AL performed analysis and interpretation of data. Manuscript was prepared by RP, AL, WO and RC. Manuscript revision was done by RP,AL, NH, and WO. All authors read and approved the final manuscript.
Funding
Suan Dusit University in Thailand provided Dr.PH scholarship to the lead author. AL is supported by the NIHR Manchester Biomedical Research Centre.
Availability of data and materials
The datasets used and/or analyzed during the current study available from the corresponding author on reasonable request.
Ethics approval and consent to participate
This study was approved by the Ethical Review Committee for Human Research, Faculty of Public Health, Mahidol University, Thailand (COA. No. MUPH 2014–189).
Consent for publication Not applicable.
Competing interests
The authors declare that they have no competing interests.
Author details
1Department of Nutrition, Faculty of Public Health, Mahidol University, 420/1
Ratchawithi RD., Ratchathewi District, Bangkok 10400, Thailand.2Departments of Epidemiology, Faculty of Public Health, Mahidol University, 420/1 Ratchawithi RD., Ratchathewi District, Bangkok, Thailand.3Division of
Population Health, Health Services Research & Primary Care, School of Health Sciences, Faculty of Biology, Medicine and Health, The University of Manchester, Manchester, UK.
Received: 23 March 2019 Accepted: 4 July 2019
References
1. Ministry of Public Health. Thailand Health Profile Report 2008-2010. 2008.
http://wops.moph.go.th/ops/thp/images/stories/Report_pics/CD_ROM53/ Eng/Chapter4.8.pdf. Accessed 11 May 2019.
2. Ministry of Public Health. Thailand Health Profile Report 2008-2010. 2008.
http://wops.moph.go.th/ops/thp/images/stories/Report_pics/CD_ROM53/ Eng/Chapter4.1.pdfAccessed 11 May 2019.
3. Aekplakorn W. Thai National Health Examination Survey, NHES V. Nonthaburi:. The Graphico system co.Ltd.; 2014.
4. Health Information System Development Office. Thailand Health Profile 2008-2010. 2010.https://www.hiso.or.th/hiso5/report/report9.php. Accessed 10 July 2017.
5. Murakami K, Okubo H, Sasaki S. Effect of dietary factors on incidence of type 2 diabetes: a systematic review of cohort studies. J Nutr Sci Vitaminol (Tokyo). 2005;51(4):292–310.
6. Kosulwat V. The nutrition and health transition in Thailand. Public Health Nutr. 2002;5(1A):183–9.
7. Azizi M, Aghaee N, Ebrahimi M, Ranjbar K. Nutrition knowledge, the attitude and practices of college students. Facta Universitatis. 2011;9(3):349–57. 8. Expert Consultation WHO. Appropriate body-mass index for Asian
populations and its implications for policy and intervention strategies. Lancet. 2004;363(9403):157–63.
9. Jitnarin N, Kosulwat V, Rojroongwasinkul N, Boonpraderm A, Haddock CK, Poston WS. Prevalence of overweight and obesity in Thai population: results of the National Thai Food Consumption Survey. Eat Weight Disord. 2011; 16(4):e242–9.
10. Mueller RO, Hancock GR. Factor analysis and latent structure, confirmatory. In: Smelser NJ, Baltes PB, editors. International encyclopedia of the Social & Behavioral Sciences. Oxford: Pergamon; 2001. p. 5239–44.
11. Brown TA. In: Kenny DA, editor. Confirmatory factor analysis for applied research. New York: The Guilford Press; 2006.
13. McCoach DB, Gable RK, Madura JP. Instrument development in the affective domain. 3rd ed. New York: Springer; 2013.
14. Fonseca M. Principles and practice of structural equation modeling, third edition by rex B. Kline. Int Stat Rev. 2013;81(1):172–3.
15. Pongkiatchai R. A study of nutrient intake of high school students in Bangkok using semiquantitative food frequency questionnaire Bangkok. Bangkok: Mahidol University; 1999.
16. Chen X, Hu Y, Zhu D, Li J, Zhou L. Chinese version of the aging perceptions questionnaire (C-APQ): assessment of reliability and validity. Aging Ment Health. 2016;20(6):567–74.
17. Parmenter K, Wardle J. Development of a general nutrition knowledge questionnaire for adults. Eur J Clin Nutr. 1999;53(4):298–308. 18. Marietta AB, Welshimer KJ, Anderson SL. Knowledge, attitudes, and
behaviors of college students regarding the 1990 nutrition labeling education act food labels. J Am Diet Assoc. 1999;99(4):445–9. 19. Polsiri A. Knowledge, attitudes and behaviors about food consumption of
Ramkhamhaeng University undergraduate students. Ramkhamhaeng J. 2008;11(1):49–60.
20. Piaseu N, Tatsanachantatanee D, Kittipoom S, Putwatana P. Nutritional knowledge, attitude toward food, food behavior, and nutritional status among nursing students. Rama Nurs J. 2009;15:48–59.
21. Feren A, Torheim LE, Lillegaard IT. Development of a nutrition knowledge questionnaire for obese adults. Food Nutr Res. 2011;55.https://doi.org/10.34 02/fnr.v55i0.7271.
22. Hendrie GA, Cox DN, Coveney J. Validation of the general nutrition knowledge questionnaire in an Australian community sample. Nutr Diet. 2008;65(1):72–7.
23. Medeiros LC, Hillers VN, Chen G, Bergmann V, Kendall P, Schroeder M. Design and development of food safety knowledge and attitude scales for consumer food safety education. J Am Diet Assoc. 2004;104(11):1671–7. 24. Green EC. Can qualitative research produce reliable quantitative findings?
Field Methods. 2001;13(1):3–19.
25. Hair JF, Black WC, Babin BJ, Anderson RE. Multivariate data analysis: a global perspective. 7th ed. New Jersey: Pearson Education; 2010.
26. Kline RB. Principles and practice of structural equation modeling. 3rd ed. New York: Guilford Press; 2015.
27. Lim T-P, Chye FY, Sulaiman MR, Suki NM, Lee J-S. A structural modeling on food safety knowledge, attitude, and behaviour among Bum Bum Island community of Semporna, Sabah. Food Control. 2016;60:241–6. 28. Yong AG, Pearce S. A Beginner’s guide to factor analysis: focusing on
exploratory factor analysis. Tutor Quant Methods Psychol. 2013;9(2):79–94. 29. Marsh HW, Balla J. Goodness of fit in confirmatory factor analysis: the effects
of sample size and model parsimony. Qual Quant. 1994;28(2):185–217. 30. Bureau of Nutrition. Food-based dietary guidelines for Thai: Bangkok
Ministry of Public Health; 2001.http://www.fao.org/3/a-as887e.pdf. Accessed 28 June 2016.
Publisher’s Note