Leanness Evaluation in 6 Manufacturing MSME‖s
using AHP & SEM Techniques
Ravikumar M.M
1*, Marimuthu.K
2, Parthiban.P
3, Abdul Zubar.H
41 Research scholar, Pallavan College of Engineering, white gate, kanchipuram, Anna University, India, 631502 (Email ID: [email protected]),+919444691455
2
Professor, Department of Mechanical Engineering, Coimbatore Institute of Technology, Coimbatore. 3 Associate professor, Department of Production Engineering, National Institute of Technology, Tiruchirappalli,
4 Associate professor, Department of Mechanical Engineering, Knowledge Institute of Technology, Salem.
Abstract-- Leanis developed into a management method, which improves the overall standard of an organization. This study aims at providing a detailed outline of lean implementation helping managers to implement lean in their premises. The factors which affect lean implementing has been carved out of various literature works taking guidelines from experts from both industries and academies. For developing independent and latent variables Structural Equation Modelling is used. For organizing and taking complex decisions used for ranking alternatives Analytical Hierarchy Process technique is used.
Index Term
--
Lean, management approach, StructuralEquation Modeling, Analytic hierarchy process (AHP).
1. INTRODUCTION
Lean manufacturing is one technique that many major organizations have been trying to implement in their premises in order to contain with a volatile global market. The main objective of lean is to reduce costs without affecting the quality of the product. Lean integrates with Discrete Manufacturing Systems since the integration with Continuous Manufacturing Systems is limited, due to a less urgent need for major development activities (Abdullah & Rajagopal, 2003).
Despite growing recognition, lean implementation is not developing into a successful system which might be due to inadequate knowledge in lean concepts (Behrouzhi & Wong, 2011). The only bright spot is the Toyota Production Systems which aims at eliminating waste (Agarwal et al, 2006). This study investigates the importance of critical success factors in lean implementation. The success factors were obtained after consulting experts from industries and from the academies. SEM is used for loading independent variables for determining latent variables while AHP is used for analyzing complex decision for ranking the organization based on their growths.
2. LITERATURE REVIEW
A large number of studies have been done on lean concept and its various parameters in lean implementation across the globe. Yang et al, in his investigation reveals the road blocks in lean implementation in China. S. Taj conducted
studies on the various ways of lean implementation in China. Doolean & Hacker used explanatory approach to investigate the effect of leanness in electrical industries in the northwest pacific region (Doolean & Hacker, 2005). Salleh et al, researched on integrating TQM with lean in Malaysia. All these extensive works help to understand the effects of various cultures in different countries. These studies clearly suggest that cultural difference does not play a key role in implementing lean. Various studies have been conducted in different industries. Bayou & Korvin investigated the lean technique implemented at Ford & General Motors Automobile industries (Bayou & Korvin, 2008). Billesbach, J.T, used leanness in a process facility industry (Billesbach, J.T, 1994). Marby& Morrison studied how lean practices were transformed in the automobile industry (Marby& Morrison, 1996). Sayed et al analysed the performance of organization leanness using simulation (Sayed et al, 2013). Cagliano et al, performed a cluster analysis to evaluate lean and agile strategies (Cagliano et al, 2004). Ashish Agrawal et.al used ANP to model the matrices of Lean in Supply chain (Agarwal et.al 2005). Meade et.al carried out the financial analysis of the theoretical framework of lean manufacturing using the hybrid simulation technique. Apart from these, studies have also been carried out to integrate lean approach with various other aspects of manufacturing industry. Yang et.al studied the impact of Lean Manufacturing and environmental management on business performance (Yang et.al 2011). Rachna Shah and Peter Ward undertook the study regarding the context, practices and performance of Lean Manufacturing (Shah and Ward 2002). T Melton extensively analyzed the benefits of the Lean concept in the business process (T Melton, 2005). In this research we have used Structural equation modelling as the tool to analyze the critical factors that affect the implementation of Lean Manufacturing in the SMEs in India and analytic hierarchy process (AHP) technique is used for ranking the companies.
a. Structural Equation Modelling
estimation method used, and the distributional characteristics of observed variables (Kline, 2005).
Larger models often contain a large number of model parameters demanding larger sample sizes. Sample size for SEM analysis can also be determined based on prior power considerations. There are different approaches to power estimation in SEM (MacCallum, Browne & Sugawara, 1996) on the root mean square error of approximation (RMSEA) method; (Satorra & Saris, 1985; Yung & Bentler, 1996)on bootstrapping (Muth‘en&Muth‘ en, 2002). SEM software programs continuously update the goodness-of-fit indices among which some are better than the other appropriate conditions. Generally the multiple indices are prescribed simultaneously when the overall model fit is evaluated
b. Analytic hierarchy process (AHP)
Among the various MCDM techniques proposed, the Analytic Hierarchy Process (AHP) proposed by Saaty (1980) is very popular and has been applied in a wide variety of areas including planning, selecting a better alternative, resource allocation and resolving conflicts. Given the growing number of AHP applications, a number of papers have been surveying its applications have been published regularly. Zahedi (1986) has provided one of the earliest reviews of AHP. She has outlined four decision steps of AHP and categorized the diverse application fields of AHP in terms of evaluation, selection and prediction. She has also found that all the studies have applied AHP for decision problems with more qualitative data. Most of the applications in her review were theoretical, which had not yet been applied in corporate context. Recent overviews have been provided by Forman and Gass (2001), Vaidya and Kumar (2006) and Sipahi and Timor (2010). Forman and Gass(2001). They have discussed applications of AHP for decisions such as choice, prioritization/evaluation, resource allocation, benchmarking, quality management, public policy, health care and strategic planning. However, since AHP has been applied in a huge variety of application fields, some recent reviews have
focused on the application of AHP in specific fields: marketing (Wind and Saaty, 1980; Mark, 2001), energy (Pohekar and Ramachandran, 2004), medical and health care decision making research and development (R&D) project selection and resource allocation. Wind and Saaty (1980) have reviewed applications of AHP in marketing such as portfolio decisions and desired target portfolio, directions for new product development, and generation and evaluation of marketing mix strategies. Mark (2001) has emphasized the used of adaptive AHP for customized marketing decision problems. He reviewed standalone AHP application and recommended that knowledge base to be incorporated in complex marketing decision problems. Pohekar and Ramachandran, (2004) have analyzed the applicability of multi criteria decision making methods in 90`s published articles related to renewable energy planning, energy resource allocation, building energy management, transportation energy systems, project planning and electric utility planning. A main strength of AHP is its ability to consider subjective opinions of decision-makers. This feature has made it especially attractive for combining with other methodologies that are usually developed to deal with objective data.
3. PROBLEM DESCRIPTION
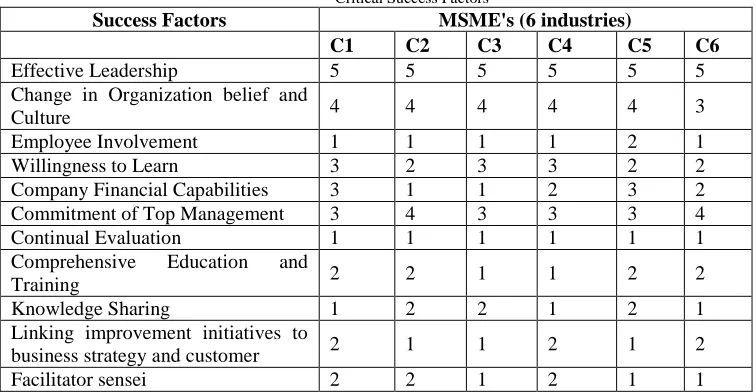
In general, successful lean practice in a particular organization depends on the organization characters and not that all organizations should follow the same practices. Larger firms has started implementing lean but small organizations are still struggling to adapt due to various reasons. A few organizations adapted but could not persist with the changes. To make things simple, success factors for better lean implementation have been prescribed by experts from both the industry and academies helping organizations adapt to lean in a better way. Based on the prescribed factors a questionnaire covering all aspects has been framed, helping to measure the parameters that block the way to reaching better production techniques i.e., leanness. The respondents were thoroughly briefed about the parameters.
Table I Critical Success Factors
Success Factors MSME's (6 industries)
C1 C2 C3 C4 C5 C6
Effective Leadership 5 5 5 5 5 5
Change in Organization belief and
Culture 4 4 4 4 4 3
Employee Involvement 1 1 1 1 2 1
Willingness to Learn 3 2 3 3 2 2
Company Financial Capabilities 3 1 1 2 3 2
Commitment of Top Management 3 4 3 3 3 4
Continual Evaluation 1 1 1 1 1 1
Comprehensive Education and
Training 2 2 1 1 2 2
Knowledge Sharing 1 2 2 1 2 1
Linking improvement initiatives to
business strategy and customer 2 1 1 2 1 2
Nearly 30 critical factors were obtained from experts, consultants and 11 most prominent factors (table 1) were identified from them. Later ranking was obtained from the organizations after various analyzes in their performance.
A structural equation model was developed to examine the critical factors. SEM is following explanatory approach for solving hypothesis by including observed and latent variables. The SEM model can be grouped into two – measurement model and the path diagram. Measurement models examine the relationships between each construct and their associated measures; while path models examine the relationships between constructs. The SEM model relates the criteria and lean concept. The series of equations is summarized on its configuration. The hypothesized conceptual model with LISREL notations are presented in Table.1
Linear Structural Relations (LISREL) model integrates data analysis and theory construction. The series of equations is summarized on its configuration. As such, we need to address the factor structure.
a. Effective Leadership: Strong committed executive leadership is an important requirement for successful lean implementation. Transformational leaders are most in all levels in the company.
H1. High level of Effective Leadership helps in higher lean implementation.
b. Change in organizational belief and culture: A multiple case study by (Czabke, Hansen & Doolen, 2008) report results of four case studies of secondary wood manufacturer from Germany and United States and one of the most important of the factor found was organizational culture and readiness to change.
H2. Higher resistance to change leads to lower lean implementation.
c. Employee Involvement: Employees working in the process must get involved in analyzing the present state and to develop for the future state. Workers must have sufficient participation.
H3. Higher employee Involvement leads to higher lean implementation.
d. Willingness to learn: The goal of learning is to provide positive impact outcomes as a result of effective adaptation to environmental changes and improved efficiency in the process of learning.
H4.Willingness to learn leads to higher levels of lean implementation.
e. Comprehensive Financial capabilities: The financial capabilities of the companies are one of the critical factors for successful implementation of Lean. Financial resources are needed for employee training programs, external consultants, etc.
H5. Adequate financial benefits are important for successful
lean implementation.
f. Commitment of Top Management: Consistency in management commitment is emphasized as an important element in effective implementation of changes in organizations (Kotter, 2007). Strong Management is must to take the right decisions at the right time.
H6.Higher Commitment of Top Management helps in higher levels of lean implementation.
g. Continual Evaluation: To monitor the result and to take the advantage of the change introduced in the organization it is imperative to measure the performance in the holistic manner.
H7. Continual Evaluation is important for better Lean implementation.
h. Comprehensive Education and Training: Education and training equips the employees with the adapting capabilities. The goal of education and training is to provide positive impact outcomes as a result of effective adaptation to environmental changes and improved efficiency in the process.
H8. Higher level of education and training leads to higher level of lean implementation.
i. Knowledge Sharing: Implementation of lean requires Knowledge Sharing Networks. It also can help break the higher price and input cost cycle.
H9. Higher Knowledge Sharing leads to higher levels of lean implementation.
j. Linking improvement initiatives to business strategy and customers: Various experts from industry have led a due emphasis on the fact that thinking development is must for the company to be motivated for the implementation of lean concept in the organization.
H10. Higher thinking development leads to higher level of lean implementation.
k. Facilitator Sensei: An expert full time lean consultant is critical for successful lean implementation.
H11.Higher Facilitator sense leads to higher levels of success in lean implementation.
3.1 QUESTIONNAIRE PREPARATION
3.2 ANALYSIS OF SURVEY
The survey was analyzed using Structural Equation Modelling. The SEM Structural Equation model was developed to get the score of all the 11 critical factors.
Measurement models are used to examine the relationships between each construct and their associated measures; and a
path model to examine relationships between constructs. The SEM model denotes the relationship between the criteria and lean concept. We can write the series of equations that summarizes its configuration.
Fig. 1. Conceptual model for lean implementation
The factor structure equations are
Y1 = λ11 + 1 , Y2 = λ21 + 2 , Y3 = λ31 + 3, Y4 = λ41 + 4 ………...Yn = λnn + n and the equation can be written in vector form as:
n n
n
Y
Y
Y
Y
Y
Y
4 3 2 1
4 3 2 1
4 3 2 1
Also, the above structure can be summarized as:
YY
Where,
is the factor loadings and ε is measurement error terms. After determining the face validity through experts to ensure convergence and discriminated validity of the model, the confirmatory factor analysis was performed. The factor loadings and loading and the respective items‘ Cronbach alpha scores have gained high loadings, which indicate a good convergent validity and reliability. The model for lean implementation has been portrayed in figure 1. A total of 45questionnaires were distributed in the company, out of which 29 completed questionnaires were received. The values obtained from the questionnaire were received and tabulated in order to obtain the relative weights for the critical factors.
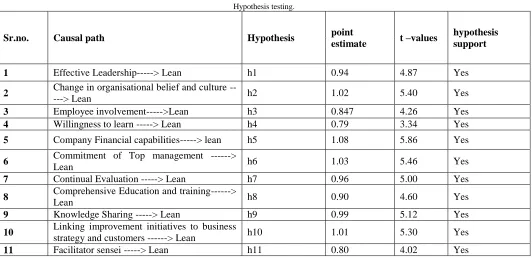
4. HYPOTHESIS TESTING
The causal path model was tested by SEM in LISREL version 8.80. The t-values of the variables range from 3.04 to 5.86, well within the range of expected levels at the level of significance at 0.05. Result of hypothesis has been tabulated in table II.
Table II Hypothesis testing.
Sr.no. Causal path Hypothesis point
estimate t –values
hypothesis support
1 Effective Leadership---> Lean h1 0.94 4.87 Yes
2 Change in organisational belief and culture
---> Lean h2 1.02 5.40 Yes
3 Employee involvement--->Lean h3 0.847 4.26 Yes
4 Willingness to learn ---> Lean h4 0.79 3.34 Yes
5 Company Financial capabilities---> lean h5 1.08 5.86 Yes
6 Commitment of Top management --->
Lean h6 1.03 5.46 Yes
7 Continual Evaluation ---> Lean h7 0.96 5.00 Yes
8 Comprehensive Education and training--->
Lean h8 0.90 4.60 Yes
9 Knowledge Sharing ---> Lean h9 0.99 5.12 Yes
10 Linking improvement initiatives to business
strategy and customers ---> Lean h10 1.01 5.30 Yes
11 Facilitator sensei ---> Lean h11 0.80 4.02 Yes
The factors (Latent factors) given by the SEM model is considered for the relative weighting of the criteria. The
relative weighting of the criteria is found out and tabulated in the table III.
Table III
Weight age of the critical factors
Eff ec ti v e Lea d ersh ip Ch an g e in Org an iza ti o n b eli ef an d Cu lt u re Emp lo y ee In v o lv em en t Wi ll in g n ess to Lea rn Co m p an y F in an cial Ca p ab il it ies Co m m it m en t o f To p M an ag em en t Co n ti n u al Ev alu ati o n Co m p re h en si v e Ed u ca ti o n an d Train in g Kn o wle d g e S h arin g Li n k in g imp ro v em en t in it iati v es to b u sin ess stra teg y an d co st F ac il it ato r se n se i
0.099 0.178 0.0891 0.836 0.1144 0.1089 0.1023 0.0946 0.1045 0.1067 0.0847
5. ANALYTICAL HIERARCHY PROCESS PROCEDURE
In this method,
Information is decomposed into a hierarchy of alternatives and criteria.
Both qualitative and quantitative information can be compared using informed judgments to derive weights and priorities.
Goal:
Choose the best Alternative Prioritize the set of Alternative
Set of Criteria
AHP procedure
Step 1. Prioritize the Criteria
Step 2. Prioritize the Alternatives in terms of each Criteria Step 3. Normalize the prioritization of Alternatives
Table IV
Thomas L. Saaty‘s Scale: pair wise comparison scale.
Numerical value Verbal scale Explanation
1.0 Equal importance of both elements. Two elements contribute equally.
3.0 Moderate importance of one element over
another.
Experience and judgment favour one element over another.
5.0 Strong importance of one element over
another.
An element is strongly favoured.
7.0 Very strong importance of one element
over another.
An element is very strongly dominant.
9.0 Extreme importance of one element over
another.
An element is favoured by at least an order of magnitude.
2.0, 4.0, 6.0, 8.0 Intermediate values. Used to compromise between two judgments.
Pair wise comparison scale is shown above in table IV.
Step 1: Pair wise comparison of alternatives. Table V
Pair-wise comparison of alternatives.
C1 C2 C3 C4 C5 C6 C1 1 3 2 6 5 5
C2 1 3 5 3 1
C3 1 3 1 0.333333
C4 1 0.25 0.2
C5 1 0.333333
C6 1
Pair wise comparisons of alternatives are shown in table 5.After pair wise comparison of alternatives we get the value of relative weight for each alternative, and we have concluded that got more weightage in table VI.
Table VI
Relative weights of alternatives. Maximum Eigen
Value =6.45738 C.I.=0.0914762 Weights (Eigen Vector)
0.418056 C1
0.188783 C2
0.0955092 C3
0.0358614 C4
0.0816405 C5
0.18015 C6
1.0000001 TOTAL
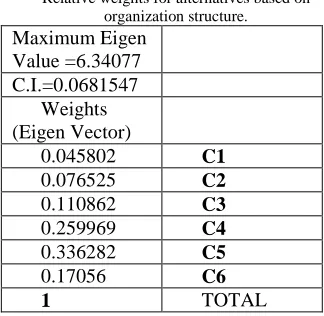
Step 2: Pair wise Comparison in terms of ORGANIZATION STRUCTURE
Table VII
Pair wise Comparison in terms of ORGANIZATION STRUCTURE
C1 C2 C3 C4 C5 C6
C1 1 0.33333 0.5 0.25 0.166667 0.25
C2 1 0.333333 0.25 0.25 0.5
C3 1 0.5 0.25 0.333333
C4 1 1 2
C5 1 3
C6 1
A pair wise comparison is made by paring all the MSME against each other is given in the above table VII.
Table VIII
Relative weights for alternatives based on organization structure. Maximum Eigen
Value =6.34077 C.I.=0.0681547
Weights (Eigen Vector)
0.045802 C1
0.076525 C2
0.110862 C3
0.259969 C4
0.336282 C5
0.17056 C6
1 TOTAL
The relative weight-age obtained for alternatives based on organizational structure are given in the above table 8. The relative weight-age of the second MSME is higher where as the weight-age of the first MSME is the lowest of the six.
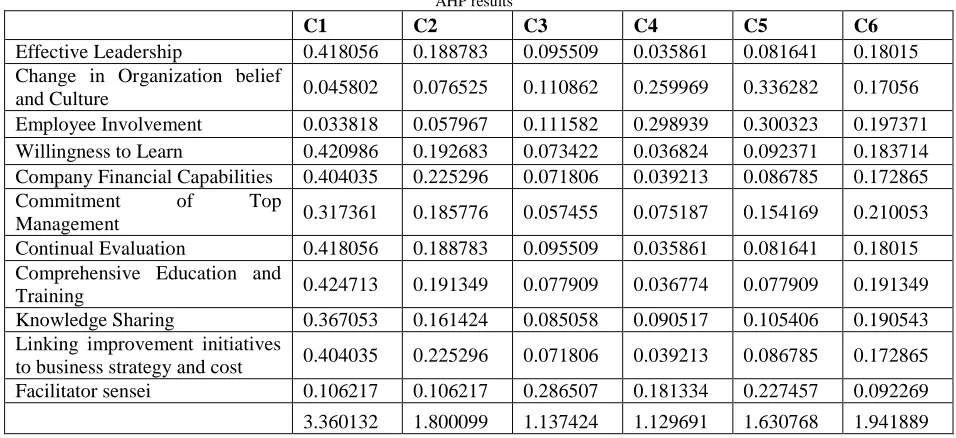
5.1 AHP RESULTS
criteria‘s and thus we get the result which is shown below in Table IX.
Table IX AHP results
C1 C2 C3 C4 C5 C6
Effective Leadership 0.418056 0.188783 0.095509 0.035861 0.081641 0.18015
Change in Organization belief
and Culture 0.045802 0.076525 0.110862 0.259969 0.336282 0.17056
Employee Involvement 0.033818 0.057967 0.111582 0.298939 0.300323 0.197371
Willingness to Learn 0.420986 0.192683 0.073422 0.036824 0.092371 0.183714
Company Financial Capabilities 0.404035 0.225296 0.071806 0.039213 0.086785 0.172865
Commitment of Top
Management 0.317361 0.185776 0.057455 0.075187 0.154169 0.210053
Continual Evaluation 0.418056 0.188783 0.095509 0.035861 0.081641 0.18015
Comprehensive Education and
Training 0.424713 0.191349 0.077909 0.036774 0.077909 0.191349
Knowledge Sharing 0.367053 0.161424 0.085058 0.090517 0.105406 0.190543
Linking improvement initiatives
to business strategy and cost 0.404035 0.225296 0.071806 0.039213 0.086785 0.172865
Facilitator sensei 0.106217 0.106217 0.286507 0.181334 0.227457 0.092269
3.360132 1.800099 1.137424 1.129691 1.630768 1.941889
The results obtained after performing analytical hierarchy process on the 11 critical success factors in 6 MSME are formulated. The different critical factors are tabulated and the importance given to each by the 6 MSME‖s.
6. RESULTS
Lean manufacturing is an integrated manufacturing strategy which is focused on the maximization of capacity and minimization of system variability. The factors (Latent factors) given by the SEM model is considered for the relative weighting of the criteria. The relative weighting of the criteria is founded out from LISREL and tabulated in the Table X.
Table X
Weight ages of the Critical Factors
Critical Success Factors Weights
Effective Leadership 0.099
Change in Organization belief
and Culture 0.1078
Employee Involvement 0.0891
Willingness to Learn 0.0836
Company Financial Capabilities 0.1144
Commitment of Top
Management 0.1089
Continual Evaluation 0.1023
Comprehensive Education and
Training 0.0946
Knowledge Sharing 0.1045
Linking improvement initiatives
to business strategy and cost 0.1067
Facilitator sensei 0.0847
The above table gives relative weight ages for all the 11 success factors and shows that financial capabilities turned out to be the most important factor industries prefer.
Table XI AHP ranking:
MSMEs Rank
C1 1
C2 3
C3 5
C4 6
C5 4
C6 2
Also using AHP will provide the support to our results. The ranking provided by these techniques shows that there is a better implementation of lean techniques in C1 industries.
7. CONCLUSIONS
REFERENCES
[1]. Abdullah, F., Rajagopal, J., 2003.Lean manufacturing in the process industry.Proceedings of the IIE Research Conference, CD-ROM, Portland, OR, IIE, Norcross, GA.
[2]. AshishAgarwal, Ravi Shankar, M.K. Tiwari2006.Modeling the metrics of lean, agile and leagile supply chain: An ANP-based approach European Journal of Operational Research 173 (2006) 211–225.
[3]. Billesbach,J.T.,(1994).Applying Lean Production Principles to a Process Facility, Production and Inventory Management Journal, 3rd Quarter, pp. 40-44
[4]. Bollen, K. A. 1989. Structural Equations with Latent Variables. New York: Wiley.
[5]. Brandon G. Mabry, Kenneth R. Morrison, (1996). Transformation to lean manufacturing by an automotive component supplier. Proceedings of 19th International Conference on Computers and Industrial Engineering,31 (1-2), 95-98. [6]. Czabke, J., Hansen, E.N. &Doolen, T.L.2008, "A multisite field
study of lean thinking in US and German secondary wood products manufacturers", Forest Products Journal,vol.58, no.9, pp.77-85. [7]. David J Meade et al.(2006), ―Financial Analysis of a Theoretical
Lean Manufacturing Implementation Using Hybrid Simulation Modelling‖, Journal of Manufacturing systems, Vol. 25, No. 2.pp.86-98.
[8]. Duncan, O. D., 1975 Introduction to Structural Equation Models. Academic Press, San Diego
[9]. FarzadBehrouzi and Kuan Yew Wong 2011, ―An investigation and identification of lean supply chain performance measures in the automotive SMEs‖ Scientific Research and Essays Vol. 6(24), pp. 5239-5252.
[10].FatemehZahedi (1986)The Analytic Hierarchy Process—A
Survey of the Method and its Applications ,Interfaces,vol 16 (4)pp
[11].Forman, E.H., Gass,S.I., 2001. The Analytic Hierarchy Process
— an exposition. Operations Research 49(4), 469–486.
[12].Fox, J. 1984. Linear Statistical Models and Related Methods: With
Applications to Social Research. New York: Wiley
[13].Greene, W. H. 1993. Econometric Analysis, Second Edition. New
York: Macmillan.
[14].Judge, G. G., W. E. Griffiths, R. C. Hill, H. Lütkepohl& T.-C.
Lee. 1985. The Doctrine and Practice of Econometrics, Second Edition. New York: Wiley.
[15].Kline, R. B. (2005). Principles and practice of structural equation
modelling (2nd Ed.). New York: Guilford Press.
[16].Kotter, J.R. (2007) "Leading change -Why transformation efforts
fail", Harvard Business Review,85, (1), pp. 96+.
[17].M. E Bayou, J.K KorvinMeasuring the leanness of
manufacturing systems-A case study of Ford Motor Company and General Motors. Journal of Engineering and Technology Management archive Volume 25 Issue 4, December, 2008 Pages 287-304
[18].MacCallum RC, Browne MW, Sugawara HM.1996. Power
analysis and determination of sample size for covariance structure modeling. Psychol. Methods 1:130–49.
[19].Mark Davies, (2001) "Adaptive AHP: a review of marketing
applications with extensions", European Journal of Marketing, Vol. 35 Iss: 7/8, pp.872 – 894
[20].Muthen, L. K., &Muth ´ en, B. O. (2002).How to use a Monte Carlo study to decide on sample size and determine power. Structural Equation Modeling, 4, 599–620.
[21].Pohekar, S.D., Ramachandran, M., 2004.Application of
multi-criteria decision making to sustainable energy planning a review.Renewable and Sustainable Energy Reviews 8,365–381. [22].Rachna Shah and Peter T Ward (2002), ―Lean Manufacturing:
Context, Practice Bundles, and Performance‖, Journal of
Operations Management, Vol. 21, pp. 129-149.
[23].RaffaellaCagliano, Federico Caniato_, GianlucaSpina.Lean,
Agile and traditional supply: how do they impact manufacturing performance? Journal of Purchasing & Supply Management 10 (2004) 151–164.
[24].Salmiah Kasolang, Ahmed Jaffer, Noor
AzlinaMohd.Salleh.(2012) Simulation of Integrated Total Management(TQM) with lean Manufacturing (LM) Practices in
Forming Process Using DelimaQuest.Procedia Engineering, 41, 1702-1707.
[25].Satorra, A., & Saris, W. E. (1985).Power of the likelihood ratio test in covariance structure analysis. Psychometrika, 50, 83-90.
[26].SeyedYahyaSeyedDanesh, Mohammad Taleghani, Hojjat
Allah Moridzadeh, 2013,‖The Impact of Lean and Agile Strategy
on Marketing Performance of Manufacturing Firms,‖
Interdisciplinary Journal Of Contemporary Research In Business, Vol 4, No 10,pp. 987-990.
[27].Sipahi, S., Timor, M., 2010. The analytic hierarchy process and analytic network process: an overview of applications. Management Decision 48 (5), 775–808.
[28].T. Melton.(2005) The benefits of lean manufacturing What Lean Thinking has to Offer the Process Industries. Trans IChemE, Part A, Chemical Engineering Research and Design, 2005, 83(A6): 662–673.
[29].Taj, S. (2008) Lean manufacturing performance in China:
assessment of 65 manufacturing plants. Manufacturing
Technology Management Decision, 19,pp. 217-234
[30].Thomas L. Saaty(1980) ‗Decision making with the analytic
hierarchy process‘, Int. J. Services Sciences, Vol. 1, No. 1, pp.83– 98.
[31].Toni L. Doolen and Maria E. Hacker, A review of lean
assessment in organisation: An exploratory study of lean practices in Electronics manufacturers. Journal of manufacturing systems vol 24/no1 2005.
[32].Vaidya, Kumar, 2006. Analytic hierarchy process: an overview of
applications. European Journal of Operational Research 169, 1–29.
[33].Yang ping yu .A and Yuyu. BThe Barriers to SMEs‘
Implementation of Le an Production and Countermeasures—— Based on SMS in Wenzhou International Journal of Innovation, Management and Technology, Vol. 1, No. 2, June 2010 ISSN: 2010-0248.
[34].Yoram Wind and Thomas L. Saaty(1980)Marketing
Applications of the Analytic Hierarchy Process Volume 26 Issue 7
[35].Yung, Y. F., &Bentler, P. M. (1996).Bootstrapping technology in