Predicting Agricultural output by Applying
Machine Learning
Siddhant Ghosh Utkarsha Matere
BE Student BE Student
Department of Computer Engineering Department of Computer Engineering
Suman Ramesh Tulsiani Technical Campus, SPPU Suman Ramesh Tulsiani Technical Campus, SPPU
Prof. Sonali Patil Assistant Professor
Department of Computer Engineering Suman Ramesh Tulsiani Technical Campus, SPPU
Abstract
Data sets of different related to the agriculture is vastly available. The main motto of our system will be to create a machine learning algorithm and the use the available datasets for the unsupervised machine learning process and thereby predict the future crop production, crops which would likely to give a greater profit margin, etc. The prediction can also help various State as well as Central Government for taking appropriate steps as described by the prediction. The methodology will be as follows: By taking various datasets from the government and by the help of clustering for the first step and in the next step linear regression for correctly predicting. The reason why we are using unsupervised learning for the first step is so that we won’t lose any data. The whole system will be available as a website with a GUI that can accept data for the learning process. The output will also depend upon the present state of the environment.
The Features for the Learning Process are:
Weather Data (Rainfall, Winds, Frequency of Droughts, so on.) Soil Composition.
Types of Fertilizers used. The Source for Seeds/Saplings Seasonal Data.
Whether mechanized farms or manual labour used. (If manual labour is not used what is extent of mechanization). Keywords: Gaussian Regression, KNN, Naïve Bayes Clustering, Machine learning, K-Means
________________________________________________________________________________________________________ I. INTRODUCTION
Machine Learning algorithms are used to make a computer intelligent by using various techniques viz. by using Learning Data sets, these data sets are created by gathering in-formation and compiling them into something that the computer will understand. Machine Learning is quite similar to how we humans learn about something. We might, for instance, be interested in learning to complete a task, or to make accurate predictions, or to behave intelligently. The learning that is being done is always based on some sort of observations or data, such as example (the most common case in this course), direct experience, or instruction. So, in general, Machine Learning is about learning to do better in the future based on what was experienced in the past.
The emphasis of Machine Learning is on automatic methods. In other words, the goal is to devise learning algorithms that to do the learning automatically without human intervention or assistance. The Machine Learning paradigm can be viewed as “Programming by Examples”. Often, we have a specific task in mind, such as Spam filtering. But rather than programming the computer to solve the task directly, in Machine Learning, we seek methods by which the computer will come up with its own program based on examples that we provide.
Machine Learning is a core subarea of Artificial Intelligence. It is very unlikely that we will be able to build any kind of intelligent system capable of any of the facilities that we associate with intelligence, such as language or Vision, without using learning to get there. These tasks are otherwise simply too difficult to solve. Further, we would not consider a system to be truly Machine Learning also intersects broadly with other fields, especially statistics, but also mathematics, physics, theoretical computer science and more.
II. PROBLEM STATEMENT The core and broadly specified problem statement will be to —
Predict Agricultural Output by Applying Machine Learning Techniques
The proposed system will work by using a set of different Machine Learning Algorithms at various places inside the system to generate the desired output.
The desired output will be to create such a system that would enable a user to view different predictions of agricultural output by entering current situational details, once entered the system will go through the various internal steps where it will use the learning data sets to get the output.
III. SCOPE OF WORK
The scope of our system will be dependent on four major areas, that are broadly classified and encapsulate the whole system.
Designing
The back-end of our system will comprise of the various Algorithms we will sue to attain the desired output. The back-end will use supervised and unsupervised machine learning techniques for the output. The whole system depends on the back-end to work conveniently else the whole system becomes meaningless if the back-end delivers useless output.
The back-end will be responsible for two tasks: Create Learning Data-sets
Analyse user input to deliver the desired output
Development
The system will go through the following development plan— Documentation and Analysis
This part of the development will mainly comprise of listing out the various advantages and disadvantages of any Machine Learning Algorithm and thereby short-listing the usable/beneficial algorithms and also specifying how and when it will be used in the system.
Creating a Prototype
The prototype will be created by using Octave, the reason why we are using Octave is because this software gives us the freedom of just using the core programming fundamentals and it helps to discard all the support programming.
Testing
The testing phase is straight forward we will look into our data set and will exclude a particular part of the data set and let the algorithms to create a learning data set. Once the Learning data set is created we will then enter such values that should give us the output which is similar to the excluded data set. The testing which will be conducted will be rigorous and eliminate any undesired output.
Project Management
Software project management comprises of a number of activities, which contains planning of project, deciding scope of software product, estimation of cost in various terms, scheduling of tasks and events, and resource management. Project management activities may include:
Project Planning
Software project planning is task, which is performed before the production of software actually starts. It is there for the software production but involves no concrete activity that has any direction connection with software production; rather it is a set of multiple processes, which facilitates software production.
Scope Management
It defines the scope of project; this includes all the activities, process need to be done in order to make a deliverable software product. Scope management is essential because it creates boundaries of the project by clearly defining what would be done in the project and what would not be done. This makes project to contain limited and quantifiable tasks, which can easily be documented and in turn avoids cost and time overrun.
Project Estimation
IV. MOTIVATION The core motivation for us to build the system is;
Every year we read about 100’s of farmers being bankrupt and 100’s more committing suicide because their crops were destroyed in heavy rains or because of less rains, even due to a harsh winter or summer.
Climatic changes are mainly affected due to a combination of various reasons, such as; pollution of air, water and soil; the climatic changes can be predicted if not with 100% accuracy but at least with 50%-70% accuracy.
Also, crop production is affected by soil quality, financial aides provided by the government, type OS fertilizer used, extent of mechanization of farms, the tendency of a region to face droughts or floods, etc.
Also, our system can help local government bodies to look ahead and plan accordingly. The proposed system if implemented, will help the masses in a number of ways.
India is predominantly known as an agricultural country, our exports have a huge share of agricultural supply and this occupation is important because of our growing population which is already a huge number. So, our system is driven by the sole idea of helping the general public by maximizing the profit of agricultural output.
V. APPLICATIONS
The main application will be to facilitate the farmers to plan which crops to grow and when it would be a good time to grow. The system will also help the government bodies to plan ahead, in case of disaster management and likewise. So, as far as application is concerned, they can be classified into two:
Helping the farmers
Help them in planning which crop they should grow Helping Government Bodies
Help them to plan ahead for any predicted disaster; and plan the management of the same.
VI. LITERATURE SURVEY
The belief inherited in Nearest Neighbour Classification is quite simple, examples are classified based on the class of their nearest neighbours. For example, if it walks like a duck, quacks like a duck, and looks like a duck, then it’s probably a duck. The k - nearest neighbour classifier is a conventional nonparametric classifier that provides good performance for optimal values of k. In the k - nearest neighbour rule, a test sample is assigned the class most frequently represented among the k nearest training samples. If two or more such classes exist, then the test sample is assigned the class with minimum average distance to it. It can be shown that the k - nearest neighbour rule becomes the Bayes optimal decision rule as k goes to infinity.
Relief algorithms are general and successful attribute estimators. They are able to detect conditional dependencies between attributes and provide a unified view on the attribute estimation in regression and classification. In addition, their quality estimates have a natural interpretation. While they have commonly been viewed as feature subset selection methods that are applied in prepossessing step before a model is learned, they have actually been used successfully in a variety of settings, e.g., to select splits or to guide constructive induction in the building phase of decision or regression tree learning, as the attribute weighting method and also in the inductive logic programming.
Sr.
No. Title Author
Year of
Publication Findings Future Scope
1
A Review of Data Classification Using K-Nearest Neighbour Algorithm Aman Kataria, M.D. Singh 2013
Euclidean distance has higher efficiency as compared to Other Distances And if
compared with Bayes, algorithm K-Nearest neighbour algorithm again
maintains it’s efficiency
To implement a, innovative method to improve the classification, performance of KNN using Genetic Algorithm.
2 Applying machine Learning to Agricultural Data ROBERT Mc- QUEEN
2014 Using Machine Learning we can get a
successful prediction Deployment over a wider area
3
Theoretical Empirical analysis of
Relief and Relief Machine Learning
Robnik-
Sikonja 2009 Using Relief Algorithms Removing noise from a data set
VII. PROPOSED SYSTEM Application Parameters
Goal
Applying Machine Learning to predict which crop would be the most profitable by making use of various data available in the government offices which are related to agricultural and to help farmers to maximize their profit.
Approach
To make utmost use of the available data and through supervised learning create a system which would be efficient and give an output which is within the admissible range.
Design Fundamentals
The system design fundamentals are divided into three parts: Inputs for Learning
Weather Data. Soil Data.
Types of Fertilizers used. Source of Seeds.
Seasons.
Funds received from Government. Mechanized Farms or Manual Farms.
Framework
The Framework is divided into three parts:
Machine Learning — The Machine Learning part will have the core logic and the algorithms required for the whole system. GUI — The GUI will be web based which can be accessed from anywhere for easily accessibility. It will have a user database
which users can access and enter data into the database for the machine learning process. Database — The Database will be used for the Supervised Learning procedure.
Testing
To Test our system, first we would give the system sufficient data to ’learn’ and create its own database to refer and give the desired output. The methodology will be as follows:
Suppose that we have data of 10 years. We will enter the data for supervised learning of 9 years and if the output is in a nearby range of the 10th year, we will consider our work to be a success.
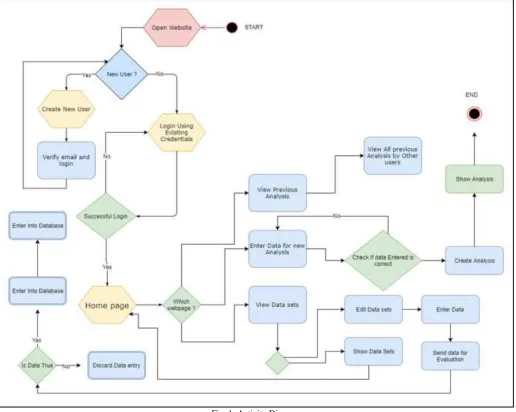
VIII. ACTIVITY DIAGRAM
Fig. 1: Activity Diagram
Algorithms
In mathematics and computer science, an algorithm is an unambiguous specification of how to solve a class of problems. Algorithms can perform calculation, data processing and automated reasoning tasks.
An algorithm is an effective method that can be expressed within a finite amount of space and time and in a well-defined formal language for calculating a function. Starting from an initial state and initial input (perhaps empty) , the instructions describe a computation that, when executed, proceeds through a finite number of well-defined successive states, eventually producing ”output” and terminating at a final ending state. The transition from one state to the next is not necessarily deterministic; some algorithms, known as randomized algorithms, incorporate random input.
The concept of algorithm has existed for centuries; however, a partial formalization of what would become the modern algorithm began with attempts to solve the Entschei-dungsproblem (the” decision problem”) posed by David Hilbert in 1928. Subsequent formalizations were framed as attempts to define” effective calculability” or” effective method”; those formalizations included the Godel – Herbrand – Kleene recursive functions of 1930, 1934 and 1935, Alonzo Church’s lambda calculus of 1936, Emil Post’s” Formulation 1” of 1936, and Alan Turing’s Turing machines of 1936-7 and 1939. Giving a formal definition of algorithms, corresponding to the intuitive notion, remains a challenging problem.
An informal definition could be” a set of rules that precisely defines a sequence of operations.” which would include all computer programs, including programs that do not perform numeric calculations. Generally, a program is only an algorithm if it stops eventually. A prototypical example of an algorithm is the Euclidean algorithm to determine the maxi-mum common divisor of two integers; an example (there are others) is described by the flow chart above and as an example in a later section.
Following are the various Machine Learning Algorithms we have studied and which have been short-listed for the system: 1) k-Means
3) Naive Bayes
4) Gaussian Naive Bayes 5) Deep Belief Networks (DBN)
k-Means
K-means clustering is a type of unsupervised learning, which is used when you have unlabelled data (i.e., data without defined categories or groups). The goal of this algorithm is to find groups in the data, with the number of groups represented by the variable K. The algorithm works iteratively to assign each data point to one of K groups based on the features that are provided. Data points are clustered based on feature similarity. The results of the K-means clustering algorithm are:
The centroids of the K clusters, which can be used to label new data. Labels for the training data (each data point is assigned to a single cluster)
Rather than defining groups before looking at the data, clustering allows you to find and analyse the groups that have formed organically. The” Choosing K” section below describes how the number of groups can be determined. Each centroid of a cluster is a col-lection of feature values which define the resulting groups. Examining the centroid feature weights can be used to qualitatively interpret what kind of group each cluster represents.
The problem is computationally difficult (NP-hard); however, there are efficient heuristic algorithms that are commonly employed and converge quickly to a local optimum. These are usually similar to the expectation-maximization algorithm for mixtures of Gaussian distributions via an iterative refinement approach employed by both algorithms. Additionally, they both use cluster centres to model the data; however, k-means clustering tends to find clusters of comparable spatial extent, while the expectation-maximization mechanism al-lows clusters to have different shapes.
Algorithm
The K-means clustering algorithm uses iterative refinement to produce a final result. The algorithm inputs are the number of clusters ÎŽ and the data set. The data set is a collection of features for each data point. The algorithms starts with initial estimates for the ÎŽ centroids, which can either be randomly generated or randomly selected from the data set. The algorithm then iterates between two steps:
Data Assignment Step:
Each centroid defines one of the clusters. In this step, each data point is assigned to its nearest centroid, based on the squared Euclidean distance. More formally, if it is the collection of centroids in set C, then each data point x is assigned to a cluster based
on:
where dist() is the standard (L2 ) Euclidean distance. Let the set of data point assignments for each ith cluster centroid be Si.
Centroid Update Step:
In this step, the centroids are recomputed. This is done by taking the mean of all data points assigned to that centroid’s cluster. The algorithm iterates between steps one and two until a stopping criterion is met (i.e., no data points change clusters, the sum of the distances is minimized, or some maximum number of iterations is reached). This algorithm is guaranteed to converge to a result. The result may be a local optimum (i.e. not necessarily the best possible outcome), meaning that assessing more than one run of the algorithm with randomized starting centroids may give a better outcome.
Conclusion
1) If variables are huge, then K-Means most of the times computationally faster than hierarchical clustering, if we keep k smalls. 2) K-Means produce tighter clusters than hierarchical clustering, especially if the clusters are globular.
3) Difficult to predict K-Value.
4) With global cluster, it didn’t work well.
5) Different initial partitions can result in different final clusters.
6) It does not work well with clusters (in the original data) of Different size and different density
kNN
KNN can be used for both classification and regression predictive problems. However, it is more widely used in classification problems in the industry. To evaluate any technique, we generally look at 3 important aspects:
KNN algorithm fairs across all parameters of considerations. It is commonly used for its easy of interpretation and low calculation time.
It is also a lazy algorithm. What this means is that it does not use the training data points to do any generalization. In other words, there is no explicit training phase or it is very minimal. This means the training phase is pretty fast. Lack of generalization means that KNN keeps all the training data. More exactly, all the training data is needed during the testing phase. (Well this is an exaggeration, but not far from truth). This is in contrast to other techniques like SVM where you can discard all non-support vectors without any problem. Most of the lazy algorithms especially KNN makes decision based on the entire training data set (in the best case a subset of them).
The dichotomy is pretty obvious here that There is a non-existent or minimal training phase but a costly testing phase. The cost is in terms of both time and memory. More time might be needed as in the worst case, all data points might take point in decision. More memory is needed as we need to store all training data.
Conclusion
1) If we assume that the points are d-dimensional, then the straight forward implementation of finding k Nearest Neighbour takes O(dn) time.
2) We can think of KNN in two ways - One way is that KNN tries to estimate the posterior probability of the point to be labelled (and apply Bayesian decision theory based on the posterior probability). An alternate way is that KNN calculates the decision surface (either implicitly or explicitly) and then uses it to decide on the class of the new points.
3) There are many possible ways to apply weights for KNN - One popular example is the Shephard’s method.
4) Even though the naive method takes O(dn) time, it is very hard to do better unless we make some other assumptions. There are some efficient data structures like KD-Tree which can reduce the time complexity but they do it at the cost of increased training time and complexity.
5) In KNN, k is usually chosen as an odd number if the number of classes is 2.
6) Choice of k is very critical - A small value of k means that noise will have a higher influence on the result. A large value makes it computationally expensive and kind of defeats the basic philosophy behind KNN.
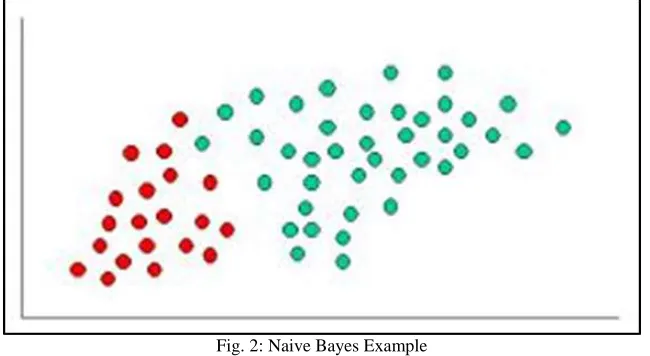
Naive Bayes Classification
The Naive Bayes Classifier technique is based on the so-called Bayesian theorem and is particularly suited when the dimensionality of the inputs is high. Despite its simplicity, Naive Bayes can often outperform more sophisticated classification methods.
Fig. 2: Naive Bayes Example
Although the assumption that the predictor (independent) variables are independent is not always accurate, it does simplify the classification task dramatically, since it allows the class conditional densities p(xk — Cj) to be calculated separately for each variable, i.e., it reduces a multidimensional ones. In effect, Naive Bayes reduces a high-dimensional density estimation task to a one-dimensional kernel density estimation. Furthermore, the assumption does not seem to greatly affect the posterior probabilities, especially in regions near decisions boundaries, thus, leaving the classification task unaffected. Naive Bayes can be modelled in several different ways including Normal, Lognormal, Gamma and Poisson Density Functions:
Conclusion
1) Naive Bayes Algorithm is a fast, highly scalable algorithm.
2) Naive Bayes can be use for Binary and Multiclass classification. It provides different types of Naive Bayes Algorithms like GaussianNB, MultinomialNB, BernoulliNB.
3) It is a simple algorithm that depends on doing a bunch of counts.
4) Great choice for Text Classification problems. It’s a popular choice for spam email classification. 5) It can be easily train on small dataset
6) It considers all the features to be unrelated, so it cannot learn the relationship between features. E.g., Let’s say Remo is going to a part. While cloth selection for the party, Remo is looking at his cupboard. Remo likes to wear a white color shirt. In Jeans, he likes to wear a brown Jeans, But Remo doesn’t like wearing a white shirt with Brown Jeans. Naive Bayes can learn individual features importance but can’t determine the relationship among features.
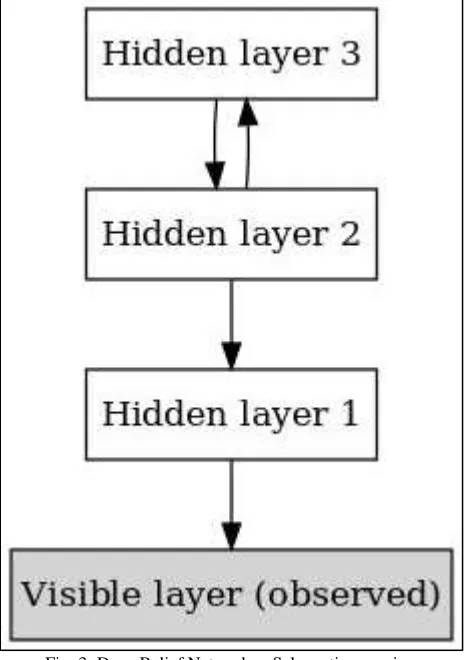
IX. DEEP BELIEF NETWORKS
Deep belief nets are probabilistic generative models that are composed of multiple layers of stochastic, latent variables. The latent variables typically have binary values and are often called hidden units or feature detectors. The top two layers have undirected, symmetric connections between them and form an associative memory. The lower layers receive top-down, directed connections from the layer above. The states of the units in the lowest layer represent a data vector.
The two most significant properties of deep belief nets are:
There is an efficient, layer-by-layer procedure for learning the top-down, generative weights that determine how the variables in one layer depend on the variables in the layer above.
After learning, the values of the latent variables in every layer can be inferred by a single, bottom-up pass that starts with an observed data vector in the bottom layer and uses the generative weights in the reverse direction.
Deep belief nets are learned one layer at a time by treating the values of the latent variables in one layer, when they are being inferred from data, as the data for training the next layer. This efficient, greedy learning can be followed by, or combined with, other learning procedures that fine-tune all of the weights to improve the generative or discriminative performance of the whole network.
back-propagation works much better if the feature detectors in the hidden layers are initialized by learning a deep belief net that models the structure in the input data (Hinton & Salakhutdinov, 2006).
A deep belief net can be viewed as a composition of simple learning modules each of which is a restricted type of Boltzmann machine that contains a layer of visible units that represent the data and a layer of hidden units that learn to represent features that capture higher-order correlations in the data. The two layers are connected by a matrix of symmetrically weighted connections, W, and there are no connections within a layer. Given a vector of activities v for the visible units, the hidden units are all conditionally independent so it is easy to sample a vector, h, from the factorial posterior distribution over hidden vectors, p(h|v, W ) . It is also easy to sample from p(v|h, W ) . By starting with an observed data vector on the visible units and alternating several times between sampling from p(h|v, W ) and p(v|h, W ) , it is easy to get a learning signal. This signal is simply the difference between the pairwise correlations of the visible and hidden units at the beginning and end of the sampling.
DBNs can be viewed as a composition of simple, unsupervised networks such as restricted Boltzmann machines (RBMs) or auto-encoders, where each sub-network’s hidden layer serves as the visible layer for the next. An RBM is an undirected, generative energy-based model with a” visible” input layer and a hidden layer and connections between but not within layers. This composition leads to a fast, layer-by-layer unsupervised training procedure, where contrastive divergence is applied to each sub-network in turn, starting from the” lowest” pair of layers (the lowest visible layer is a training set).
Teh’s observation that DBNs can be trained greedily, one layer at a time, led to one of the first effective deep learning algorithms. Overall, there are many attractive implementations and uses of DBNs in real-life applications and scenarios (e.g., electroencephalography, drug discovery).
Fig. 3: Deep Belief Networks - Schematic overview
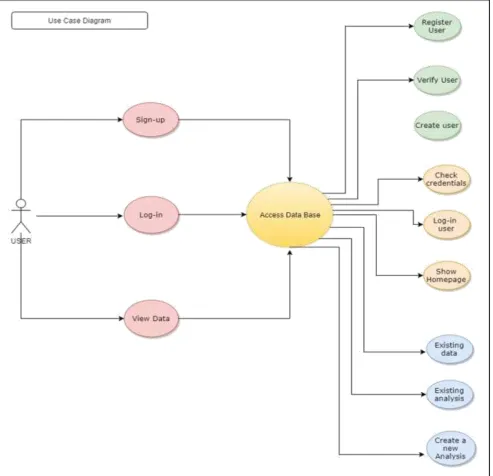
X. SOFTWARE DESIGN Use Case Diagram
Fig. 4: Use Case Diagram
Sequence Diagram
Fig. 5: Sequence Diagram
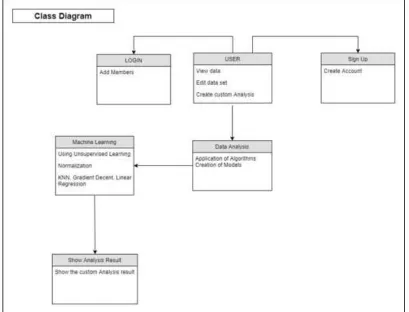
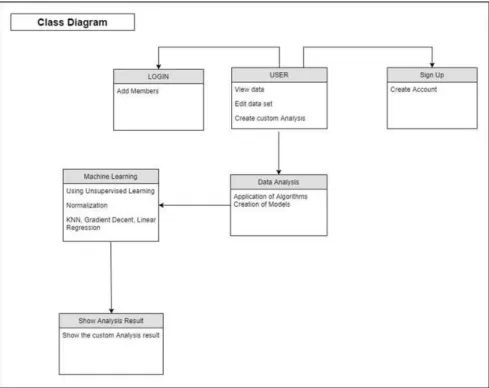
Class Diagram
The class diagram is the main building block of object-oriented modelling. It is used for general conceptual modelling of the systematic of the application, and for detailed modelling translating the models into programming. Class diagrams can code also be used for data modelling. The classes in a class diagram represent both the main elements, interactions in the application, and the classes to be programmed.
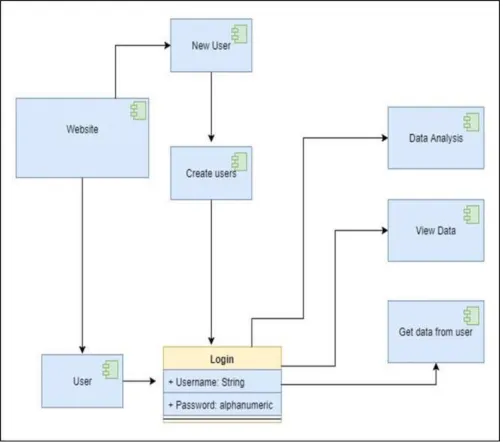
Component Diagram
A component is something required to execute a stereotype function. Examples of stereo-types in components include executables, documents, database tables, files, and library files. Components are wired together by using an assembly connector to connect the required interface of one component with the provided interface of another component. This illustrates the service consumer -service provider relationship between the two components.
Fig. 7: Component Diagram
Deployment Diagram
Fig. 8: Deployment Diagram
XI. TECHNICAL SPECIFICATION Technology Used in This Project
PHP
PHP (recursive acronym for PHP: Hypertext Pre-processor) is a widely-used open source general-purpose scripting language that is especially suited for web development and can be embedded into HTML. PHP code may be embedded into HTML code, or it can be used in combination with various web template systems, web con-tent management systems and web frameworks. PHP code is usually processed by a PHP interpreter implemented as a module in the web server or as a Common Gateway Interface (CGI) executable. The web server combines the results of the interpreted and executed PHP code, which may be any type of data, including images, with the generated web page. PHP code may also be executed with a command-line interface (CLI) and can be used to implement standalone graphical applications. The standard PHP interpreter, powered by the Zend Engine, is free software released under the PHP License. PHP has been widely ported and can be deployed on most web servers on almost every operating system and platform, free of charge
MySQL
Web Server
Web servers often come as part of a larger package of Internet- and intra-net-related programs for serving email, downloading requests for File Transfer Protocol (FTP) files, and building and publishing Web pages. Considerations in choosing a Web server include how well it works with the operating system and other servers, its ability to handle server-side programming, security characteristics, and the particular publishing, search engine and site building tools that come with it. A Web server is a program that uses HTTP (Hypertext Transfer Protocol) to serve the files that form Web pages to users, in response to their requests, which are forwarded by their computers’ HTTP clients. Dedicated computers and appliances may be referred to as Web servers as well. The process is an example of the client/server model. All computers that host Web sites must have Web server programs. Leading Web servers include Apache (the most widely-installed Web server), Microsoft’s Internet Information Server (IIS) and nginx from NGNIX. Other Web servers include Novell’s NetWare server, Google Web Server (GWS) and IBM’s family of Domino servers. Web servers often come as part of a larger package of Internet- and intra-net-related programs for serving email, downloading requests for File Transfer Protocol (FTP) files, and building and publishing Web pages. Considerations in choosing a Web server include how well it works with the operating system and other servers, its ability to handle server-side programming, security characteristics, and the particular publishing, search engine and site building tools that come with it.
GNU Octave
GNU Octave is software featuring a high-level programming language, primarily in-tended for numerical computations. Octave helps in solving linear and nonlinear problems numerically, and for performing other numerical experiments using a language that is mostly compatible with MATLAB. It may also be used as a batch-oriented language. Since it is part of the GNU Project, it is free software under the terms of the GNU General Public License. Octave is one of the major free alternatives to MATLAB, others being Scilab and FreeMat. Scilab, however, puts less emphasis on (bidirectional) syntactic compatibility with MATLAB than Octave does. The Octave language is an interpreted programming language. It is a structured programming language (similar to C) and supports many common C standard library functions, and also certain UNIX system calls and functions. However, it does not support passing arguments by reference. Octave programs consist of a list of function calls or a script. The syntax is matrix-based and provides various functions for matrix operations. It supports various data structures and allows object-oriented programming.
Its syntax is very similar to MATLAB, and careful programming of a script will allow it to run on both Octave and MATLAB. Because Octave is made available under the GNU General Public License, it may be freely changed, copied and used. The pro-gram runs on Microsoft Windows and most Unix and Unix-like operating systems, including macOS.
XII. RESULT ANALYSIS Performance Evaluation Parameters
For the performance evaluation, we need to evaluate the Learning Process and the GUI of our system. The following is the list of things that need the evaluation.
Analysis of the following Data. Weather Data.
Soil Data
Types of Fertilizers used. Source of Seeds.
Seasons.
Funds received from Government. Mechanized Farms or Manual Farms.
Framework - Creating and testing the framework The Framework is divided into three parts:
Machine Learning — The Machine Learning part will have the core logic and the algorithms required for the whole system. GUI — The GUI will be web based which can be accessed from anywhere for easily accessibility. It will have a user database
which users can access and enter data into the database for the machine learning process. Database — The Database will be used for the Supervised Learning procedure.
Thus, Performance Evaluation is dependent upon the above-mentioned points only Conclusion
Thus, by using different Algorithms we will analysis agricultural data which is gathered from the Government of India and create a Predictive Analysis for the progress of farmers. The proposed system will give the following predictive analysis:
1) Suitable Weather for a Particular Crop
2) Suggestions regarding which Crop should be grown 3) Suggestions for Suitable Pesticides and Fertilizers
XIII. FUTURE SCOPE
The system once developed will only be applicable in a small area for testing and initial deployment.
Later, slowly and steadily will cover up regions. Now this process will be little complicated because, as the regions extend; the Machine Learning Complexities also increase.
So, even the back-end of our system needs to be updated regularly. Any help from the government or any institution would be much appreciated.
Thus, the future scope is just to; Gather more data
Improve the Machine Learning Algorithms
REFERENCES
[1] Lee, Honglak, et al.” Convolutional deep belief networks for scalable unsupervised learning of hierarchical representations.” Proceedings of the 26th annual international conference on machine learning. ACM, 2009.
[2] Chai, Rifai, et al.” Improving eeg-based driver fatigue classification using sparse-deep belief networks.” Frontiers in neuroscience 11 (2017).
[3] Polania, Luisa F., and Kenneth E. Barner.” Exploiting Restricted Boltzmann Ma-chines and Deep Belief Networks in Compressed Sensing.” Pre-print arXiv:1705.10500 (2017).
[4] Li, Chenyang, and Kejing He.” CBMR: An optimized MapReduce for items based collaborative filtering recommendation algorithm with empirical analysis.” Concurrency and Computation: Practice and Experience 29.10 (2017)
[5] Gupta, Shalmoli, et al.” Local search methods for k-means with outliers.” Proceed-ings of the VLDB Endowment 10.7 (2017): 757-768.
[6] Shokouhifar, Mohammad, and Ali Jalali.” Optimized sugeno fuzzy clustering algorithm for wireless sensor networks.” Engineering Applications of Artificial Intelligence 60 (2017): 16-25.
[7] Slamet, Cepy, et al.” Clustering the Verses of the Holy Qur’an using K-Means Algorithm.” Asian Journal of Information Technology 15.24 (2016): 5159-5162.