Complex Networks Community Structure
Division Algorithm Based on Multi-gene
Families Encoding
Shuzhi Li
School of Information Engineering, Jiangxi University of Science and Technology Ganzhou City, Jiangxi Province, China
Email: [email protected]
Xianmin Wang
School of Information Engineering, Jiangxi University of Science and Technology Ganzhou City, Jiangxi Province, China
Email:[email protected]
Abstract—The traditional evolutionary algorithms dividing the complex networks community have some inevitable deficiencies such as low searching accuracy, high computing time complexity, local optimal solution and so on. To address this issue, this paper proposes a novel community structure partition algorithm based on multi-gene families (MGF). First, this algorithm respectively encodes the network entities and the community types into two different multi-gene families according to the MGF’s encoding characteristics in gene expression programming (GEP), and then implicitly encodes the relationship of the two multi-gene families into a chromosome through a mapping function. Meanwhile, the elite migration strategy is applied to the whole genetic stage , that is, gene selection, crossover, inversion, restricted permutation and so on, which could speed up the convergence rate and prevent the premature phenomenon. The study shows that the algorithm proposed is more effective and accurate to solve the community division problem than the traditional evolutionary algorithms.
Index Terms—Complex Networks; Community Structure Division; Multi-gene Families (MGF); Gene Expression Programming (GEP); Elite Migration Strategy
Ⅰ.INTRODUCTION
The complex networks are the abstract representation of actual life.The nodes in the networks represent the system entities and the edges are formed with certain rules of the natural relationship between the system entities. A common character of many networks is of community structure, which can be described as the gathering of vertices into groups where there is a higher density of edges within groups than that of edges between them[1]. The ability to detect and analyze such groups can provide invaluable help in understanding and visualizing the structure of networks[2].
The traditional complex networks division algorithms include the Kernighan-Lin algorithm[3]、the
spectrum split algorithm based on Laplace graph Characteristic values[4] and the Girvan-Newman ( GN ) algorithm[5]. The Kernighan-Lin algorithm is based on the greedy principle, which can split the networks into two communities, of which the community number is known in advance. But this algorithm cannot get the global optimum solution because of the inherent defect of greedy principle. The spectrum splitting algorithm divides the network using the eigenvectors corresponding to the non-zero eigenvalue of the network structure matrix. Only if the network has distinct gathering groups, this algorithm can run fast, or else this algorithm is invalid. The GN algorithm is a splitting method, which can decompose the network into several communities by the means of removing the longest-path between edges. Although this algorithm has made up for some deficiencies of the traditional algorithms to a certain extent, the entire calculation process takes time complexity as
O e
( )
3 .(e stands for the edge number inthe network ). In order to overcome the shortcoming of the algorithms above, Tasgin introduced a community structure detection method based on the genetic algorithm for the first time[6], attempting to optimize the network community structure splitting process with the idea of evolutionary algorithm. But in GA, the individuals are represented by a linear string of fixed length and the string length keeps unchanged during the evolution process, which would cause the genes in the chromosome to lose the functional diversity; besides, this algorithm tends to be a local optimal solution, and the time complexity is high.
To address this issue, the study proposes an effective complex networks community structure division
algorithm based on multi-gene families. This algorithm respectively encoded the nodes ID and the community types information into two MGFs in chromosome. The study then interpreted their relationship through a mapping function implicitly, which improved the function diversity of the gene expression; meanwhile, some characteristic gene expression programming operator such as chromosome inversion, restricted permutation etc were introduced in the algorithm. In addition, the elite migration strategy was also applied to the whole evolution phase which could accelerate the convergence rate and improve the division accuracy.
The rest of this paper is organized as follows. Section II describes the relatedprinciples and concepts of the proposed algorithm. In section Ⅲ, the algorithm and
implementation steps are introduced. Section Ⅳ shows
the experimental results. Finally, conclusions are given in Section V.
Ⅱ.THE COMPLEX NETWORKS COMMUNITY STRUCTURE
DIVISION ALGORITHM BASED ON MULTI-GENE FAMILIES
2.1 Design of the Fitness Function
In order to measure the quality of the networks community structure division, Newman introduced a modularity index measure function (modularity-measure-Q Abbr.)[7]. Consider a particular division of a network
G V E
( , )
into k communities.Let us define a k k× symmetric matrixE=
( )
eij whose elementeijis the fraction of all edges in the network that link vertices in community i to vertices in community j(Here the authors consider all edges in the original network). Thus the authors can define the modularity-measure-Q by
2
ii ij
i j
Q e e
⎛ ⎛ ⎞ ⎞
⎜ ⎟
= ⎜ −⎜ ⎟ ⎟
⎝ ⎠
⎝ ⎠
∑
∑
(1)noticing that
( )
ii i Tra E =∑
e ,2 2
ij i j
e
⎛ ⎞
= ⎜ ⎟
⎝ ⎠
∑ ∑
E ,where
( )
Tra E indicates the trace of the matrix E and
2
E indicates the sum of the elements of the matrix
E2.Thus the (1) can be further reduced to
( )
2 Q=Tra E − E
(2)
Obviously, Q∈
( )
0,1 . If Q>0.3 , the networks exist notable community structure[8].The maximum Qvalue is 1. As the Q value increases, the community structure of the networks become distinct. In practice, this value for the normal networks typically falls in the range from about 0.3 to 0.7.
2.2 Gene Expression Reprogramming and Multi-gene Families
The gene expression programming is a novel conception proposed by Candida Ferreira on the research of Genetic Algorithm (GA) and Genetic Programming
(GP)[9].This algorithm combines the advantages of both GA and GP, which first encodes the individual as a fixed length linear string, and then expresses it as distinct size and shape nonlinear entity. Thus, the GEP algorithm can overcome the disadvantages of losing gens function diversity of GA and lacking gene expressing varity in GP. Usually, the efficiency of GEP is 2 to 4 order of magnitude as much as the other genetic programming algorithms when coping with the complex problem[10]. The core principle of GEP composes the special gene structure which is made up of two different domains-——head domain and tail domain——each with different properties and functions. The head domain contains symbols that represent both functions and terminals, whereas the tail is composed of only terminals. For each problem, the length of the head h is chosen, whereas the
length of the tail t is a function of h and the number of
arguments of the function with more arguments n (also
called maximum arity) and is evaluated by the equation: t= × − +h
(
n 1 1)
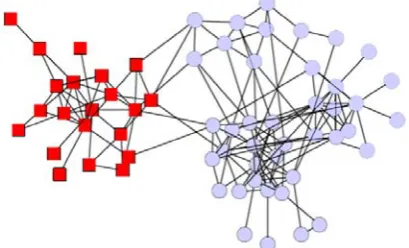
(3) The encoded gene can be interpreted as a corresponding expression tree (ET). The gene with no head domain and only one symbol in the terminal domain can be called one-element gene, which could be used to encode some special variables that are suitable for solving the combinatorial optimization problems. The one-element genes of same types can be clustered together to constitute multi-gene families, thus each gene codes for a particular terminal or task. The members of different MGFs can establish their interactions with a prior defined mapping function, and the interaction is encoded into the chromosome implicitly. When calculating the individual fitness, the study should first decode the interaction with the rule of mapping function. The mapping function is also called decoding function.Take the dolphins’ social relationship network mentioned in Newman’s paper[7] for instance. It is a social network of a community of 62 bottlenose dolphins living in Doubtful Sound, New Zealand. The network was compiled by Lusseau[11] from seven years of field studies of the dolphins, with ties between dolphin pairs being established by observation of statistically significant frequent association. The network is spitted naturally into two large groups, represented by the circles and squares in the Figure 1. As a real small society relationship network, it is often used to test the validity of the community discovery methods.
Figure 1.The dolphins’ social relationship network
identities (IDs) of all nodes in this network and the number 1 and 2 as the community type, then constructing a chromosome consisting of two multi-gene families with 62 one-element genes each. The specific structure of this chromosome is shown in Fig 2.
Figure 2 . Encoding the dolphins social network as a chromosome with two MGFs
In Figure 2 , it is seen that the one-element genes 1 to 62 belong the first multi-gene family (MGF1) , which is used to encode the nodes ID, while the one-element genes 63 to 124 belong to the second multi-gene family (MGF2), which is used to encode the community type, each multi-gene family includes 62 one-element genes. The study then defines chrom(i) as the one-element gene
of i in the chromosome, then constructing a mapping
function f: ( ) f (62 )
chrom i ⎯⎯→chrom +i (i∈[1,62]), this
function has established a mapping relationship between MGF1 and MGF2, which indicates that the node in the
chrom(i) belongs to a certain community type in the chrom(i+34), as shown in Figure 3.
... 1 2 2
1 2 1 ... 1
... 17 32 19
62 34 9 ... 1 2 3
60 61
62
…
MGF1 MGF2 Node ID Community type
f 3
4
63 64 65
122 123
124
…
66
Figure 3.The interaction between MGF1 and MGF2
2.3 Elite Migration Strategy
In order to speed up the convergence rate and improve the solution accuracy, the study applies the elite migration strategy to each evolution phase of GEP algorithm. Specifically, considering the whole chromosomes in one population of certain generation, the study respectively identifies the best individual of the chromosomes modified and before-modified by the genetic operators.(The study denotes the individual as modified one if it is modified by the genetic operators, elsewise, it is denoted as before-modified) If the individual before-modified is better than the individual modified, the study replaces the worst individual of the population modified with the best individual of the population before-modified. The use of elite migration strategy can not only control the genetic evolution direction, but also increase the average fitness of the population per generation.
Ⅲ.THE MAIN IDEA AND CONCRETE STEPS OF THE
ALGORITHM
The main idea of complex networks partition algorithm based on multi-gene encoding is that first to encode the node ID and spilt the community type into
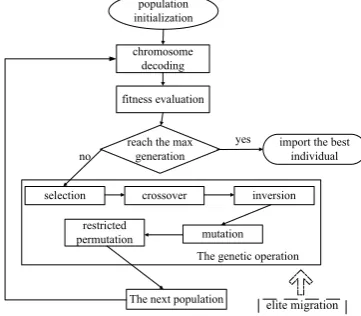
two different multi-gene families, and then to construct a mapping function to encode the relationship between the two MGFs into a chromosome implicitly; meanwhile, choose the (2) as the fitness assess function and apply the elite migration strategy to the evolution phase, that is, gene selection、crossover、inversion and restricted
permutation, the flowchart of the algorithm proposed is shown in Figure 4.
elite migration strategy
fitness evaluation
reach the max generation
selection
mutation inversion
The next population population initialization
crossover chromosome
decoding
import the best individual
restricted permutation
The genetic operation yes no
Figure 4. The flowchart of the algorithm based on multi-gene family encoding
3.1 Population Initialization
To randomly initialize a population includes 100 chromosomes, whose content is shown in TABLE 1.
TABLE 1 POPULATION INITIALIZATION
chromosome number MGF1 MGF2
chrom1 7 11 15 …62 1 4 1 2 1 2 … 1 2
chrom2 3 13 17… 57 2 5 1 2 2 1 ... 2 1
... … … … … … … … chrom99 2 10 11 ... 53 3 6 1 2 2 1 …1 1
chrom100 2 9 49 …24 1 7 2 1 1 1 …2 2
Each row in TABLE 1 represents a chromosome, the structure of which is shown in Figure 2. Each chromosome can be decoded as a community division schema by the rule defined in chapter 2.2.
3.2 Selection
The selection operation is an important means of guarantying the population’s superior evolution direction and continuity. In order to ensure the efficiency of the algorithm, the study takes the simple and effective roulette strategy as the selection algorithm.
3.3 Crossover
Crossover is the primary means to inherit the excellent genes from the parent's generation. In this paper, the single point intersection was chosen as the crossover pattern, that is, swapping the genes fragment of two corresponding chromosomes behind the intersection point by the probability of pc. In this case, as the two MGFs encode two different types of entities, the study should encode the entities with different rules.
Rule 1 The genes encoding the nodes ID in MGF1 are
Rule 2 The genes encoding the community types in
MGF2 constitute a sequence whose elements are repeatable, that is, the genes in MGF2 is a set of which the elements are the random number 1 or 2.
According to the rules above, the crossover process can be divided into two cases:
Case 1 The intersection point is located in MGF2. As the
chromosome crossover procedure occurs in MGF2, the gene sequence still meets the Rule 2 after crossover. So the gene fragments behind the intersection point could be directly swapped for each other. For example, as for the two parent chromosomes in Figure 5(a), the intersection point is in the gene 122 in MGF2. The study is just to swap the corresponding gene 122 to 124 of the two parent chromosome and the result of crossover is shown in Figure 5(b).
Figure 5. The crossover process when the intersection point is in MGF2
Case 2 The intersection point is located in MGF1. The
gene sequence after crossover may break the Rule 1, so when swapping the gene fragment of the current chromosome in MGF1, the study is to scan the other parent chromosome, and in turn filling the current chromosome with the gene fragment which doesn’t appear in the other parent’s genes before the intersection point[12].For example, as for the two parent chromosomes in Figure 6(a), as the intersection point is in the gene 60, the study is to swap the genes 60 to 62 in MGF1 and the whole genes in MGF2.When swapping the 60 to 62 genes in MGF1, the study can scan the genes before the intersection in parent 2 and the genes which do not appear between the genes 60 to 62 in the parent 1 are chosen to fill in the parent 1. Next, the study will directly swap the whole genes in MGF2. The result of crossover is shown in Figure 6(b).
Figure 6 . The crossover process when the intersection point is in
MGF1
3.4 Inversion
The inversion operator randomly selects the chromosome, the multi-gene family and the inversion
point to be modified by the probability of pr. Each chromosome can only be modified once by this operator. For example, as for the chromosome in the Figure 7(a), the study is to choose the gene 1 ,4 in MGF1 and gene 122,124 in MGF2 as the inversion randomly point, the result of inversion is shown in Figure 7(b).
Figure 7.Genes inversion process
3.5 Restricted Permutation
Restricted permutation allows two genes occupying any positions within a particular multi-gene family to exchange positions by the probability of pl. In this case, this operator is used to modify MGF1. For example, as for the chromosome in Figure 8(a), the study randomly select gene 1 , 4 in MGF1 as the permutation points, the result of restricted permutation is shown in the Figure 8(b).
Figure 8. Genes restricted permutation process
3.6 Mutation
Mutation is an operator changing the genes in certain rule by the probability of pm. In this case, it is used to modify the MGF2. For example, as for the chromosome in Figure 9(a), the study selects the gene 65 as the mutation point, the mutation result is shown in Figure 9(b).
Figure 9 Genes mutation process
IV. EXPERIMENTS
4.1 Data and Parameter Settings
This experiment took the classical dolphin’s social relationship network as a model to test and verify our algorithm, and compared with the traditional GA algorithm[13] on the perspective of efficiency and accuracy. The experiment environment is as following: Intel(R) Core(TM) i5 CPU,2G memory,Win7 operator system and matlab9.0 simulation experiment platform. The structure of dolphin’s social relationship network is given in Fig 1. The parameter settings of the two algorithms are shown in TABLE 2.
3 17 32 62 34 9 1 2 2 1 2 1
1 2 3 …… 60 61 62
9 62 34 15 … 3
intersection point
parent1
parnet2
(a)before crossover
(b)afer crossover
19 …
19 17
4
1 …
2 1 2 1 … 2 1 1
63 64 65 66……122 123 124
Gen number
3 17 32 9 62 34 2 2 1 2 1 1 9 62 34 15 … 19
19 …
3 17
1 …
1 1 2 2 … 1 2 1
MGF1 MGF2
1 2 3 4…… 60 61 62 63 64 65 66……122 123 124
parent1
TABLE 2. EXPERIMENTAL PARAMETER LIST
parameter item parameter value
GA Our algorithm Number of runs 50 50
Number of nodes 62 62 Number of generation 500 500 Population size 100 100 Number of MGFs 2 -- Number of genes in MGF 62 -- Chromosome length 124 62 Inversion (pr) 0.3 -- Crossover (pc) 0.8 0.8
Mutation(pm) 0.3 0.2 Restricted permutation(pl) 0.3 --
Fitness function Eq.(2) Eq.(2)
For comparison, the parameters value of the same genetic operators in the two algorithms keep consistent as shown in TABLE 2, the symbol“--”represents the non-existence operator and conception in the algorithm.
4.2 Experimental Analyses of the Process and Results
The study tests the two algorithms on the same environment, and gets both of the evolutionary procedure diagrams in Figure 10.
0 50 100 150 200 250 300 350 400 450 500 -0.05
0 0.05 0.1 0.15 0.2 0.25 0.3 0.35 0.4
the iterations number
the bes
t f
it
nes
s
c
hangi
ng t
rend
the fitness
the best fitness the average fitness
(a)The fitness value changing trend by GA
0 50 100 150 200 250 300 350 400 450 500 -0.05
0 0.05 0.1 0.15 0.2 0.25 0.3 0.35 0.4
the iterations number
th
e
be
s
t f
it
ne
s
s
c
h
an
gi
ng
t
ren
d
the fitness
the best fitness the average fitness
(b)The fitness value changing trend by the proposed algorithm Figure 10. The evolutionary process comparison of GA and the
proposed algorithm
From Figure 10, it can be seen that the traditional GA algorithm need to evolve 250 generations to get a stable Q value, while it is only 80 evolution generations before getting the convergence result using the proposed algorithm. Because our algorithm is introduced a special encoding mechanism, that is, the genetic operator of version and restricted permutation in GEP, it speeds up the convergence rate of the entire evolution process. In addition, the average fitness value derived from the proposed algorithm is much higher than that derived from the traditional GA, and as the generation increases, the
population overall fitness is increasing, too. As the elite migration strategy is introduced to each evolution phase in our algorithm, it does not only control the direction of evolution, but also makes the average and best fitness value of the population growing synchronously. It could effectively avoid some individuals evolving too fast and the phenomenon of premature, which reflects the high efficiency of our algorithm.
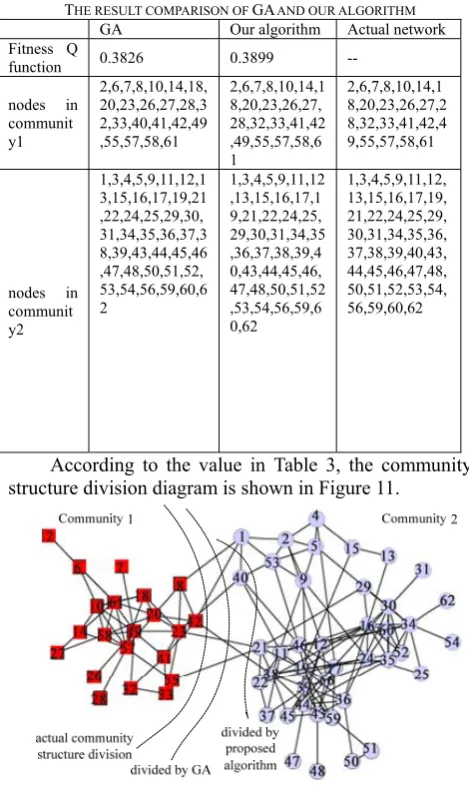
The running results of the two algorithms are shown in Table 3.
TABLE 3.
THE RESULT COMPARISON OF GA AND OUR ALGORITHM
GA Our algorithm Actual network Fitness Q
function 0.3826 0.3899 -- nodes in
communit y1
2,6,7,8,10,14,18, 20,23,26,27,28,3 2,33,40,41,42,49 ,55,57,58,61
2,6,7,8,10,14,1 8,20,23,26,27, 28,32,33,41,42 ,49,55,57,58,6 1
2,6,7,8,10,14,1 8,20,23,26,27,2 8,32,33,41,42,4 9,55,57,58,61
nodes in communit y2
1,3,4,5,9,11,12,1 3,15,16,17,19,21 ,22,24,25,29,30, 31,34,35,36,37,3 8,39,43,44,45,46 ,47,48,50,51,52, 53,54,56,59,60,6 2
1,3,4,5,9,11,12 ,13,15,16,17,1 9,21,22,24,25, 29,30,31,34,35 ,36,37,38,39,4 0,43,44,45,46, 47,48,50,51,52 ,53,54,56,59,6 0,62
1,3,4,5,9,11,12, 13,15,16,17,19, 21,22,24,25,29, 30,31,34,35,36, 37,38,39,40,43, 44,45,46,47,48, 50,51,52,53,54, 56,59,60,62
According to the value in Table 3, the community structure division diagram is shown in Figure 11.
Figure 11. The community structure division
From Figure 11, it is shown that the traditional GA wrongly divided the node 40 into community 2 which originally belonged to community 1, while the partition result deriving from our algorithm is completely consistent with the actual result.
V.CONCLUSIONS
As GEP has special superiority in solving the combinatorial optimization problems[14-16], the study
enhance the diversity of the gene function. (2)Combining the elite migration strategy of GA with the special genetic operator of GEP to improve the efficiency and accuracy of the evolutionary algorithm, which has a strong practical value.
ACKNOWLEDGMENTS
This paper is supported by National Natural Foundation of Jiangxi Province (2009GZS0043) and Department of Education Technology Project of Jiangxi Province.
REFERENCES
[1] Girvan M & Newman M E J. Community Structure in
Social and Biological Networks[J]. Proceedings of the
National Academy of Sciences, 2002. 99(12): p.
7821-7826.
[2] Andrea Lancichinetti & Santo Fortunato. Community Detection Algorithms: A Comparative Analysis Physical
Reviewe 80, 056117 (2009).
[3] Kernighan B W & Lin S. An Efficient Heuristic Procedure
for Partitioning Graphs[J]. The Bell System Technical
Journal 1970. 49(1).
[4] M.Fiedler. Algebraic Connectivity of Graphs[J].
Czechoslovak Mathematical Journal, 1973. 23(98): p.
298-305.
[5] Pothen A, Simon H D & Liu K. Partitioning Sparse
Matrices with Eigenvectors of Graphs[J].SIAM Journal on
Matrix Analysis and Applications,1990. 11(3): p. 430-452.
[6] Tasgin M. Community Detection Model Using Genetic Algorithm in Complex Networks and Its Application in Real-Life Networks, Graduate Program in Computer Engineering. 2005: Bogazici University.
[7] M.E.J.Newman. Detecting Community Structure in
Networks[J].The European Physical Journal B, 2004.
38(32).
[8] S.H.Liu,Q.K.Liu,&F.D.Xie.etal, Complex Network Comminity Division Algorothm Based on Local
Modular[J], Computer Engineering and
Design.China,2009,Vol.20.
[9] L.S.Huang&Z.K.Lin. Complex Funtion Recognization Based on Gene Expression Programming[J], Computer
Engineering and Design.China,2006,Vol.19.
[10]Q.S.Ni,J.Z.Tang,&N.Yang,et al, Gene Expression Progarmming Algorithm Based on Multi - threaded Assessment[J], Journal of Computer Application,China, 2012. Vol.32(4).
[11]Lusseau D.The Emergent Properties of A Dolphin Social
Network. Biology Letters, Proc. R. Soc. London B(suppl.),
2003.
[12]L.Yang, GEP Evaluation and Individual Diversity Stragegy[J], Institutes of Technology of Changsha , 2010. [13]F.S.Liu&Y.R.Luo, A Community Structure Discovery in
Complex Networks Based on Multi-Population Genetic Algorithm[J], Application Research of Computers, China,2012.Vol.29.
[14]X.H.Fu, C.Wang&Z.Wang,Threshold Random Walkers for Community Structure Detection in Complex Networks,
Journal of Software, Vol 8, No 2 (2013).
[15]X.Li, W.Xiao&Z.Liu,A New Fractional Order Chaotic System and Its Compound Structure, Journal of Software, Vol 8, No 1 (2013).
[16]D.Chen, X.Xu, A Novel Approach for Finding Clusters from Complex Networks, Journal of Software ,Vol 6, No 1 (2011)
Shuzhi Li, born in 1964, Professor, majors in Computer
Application with Master’s Degree from University of Huazhong University of Science and Technology. Now she is working at Jiangxi University of Science and Technology. Her major research areas are Digital Watermarking, Web Service and Software Engineering. Currently, she has presided overthe Projects supported by Natural Science Funds (20122BAB211035) of Jiangxi province and Department of Education Technology Project (GJJ12345 and GJJ12349).of Jiangxi province.
Xianmin Wang, born in 1984, postgraduate, majors in