Probabilistic Aspects in Spoken Document Retrieval
Wolfgang Macherey
Lehrstuhl f¨ur Informatik VI, Computer Science Department, RWTH Aachen, University of Technology, D-52056 Aachen, Germany Email:[email protected]
Hans J ¨org Viechtbauer
Lehrstuhl f¨ur Informatik VI, Computer Science Department, RWTH Aachen, University of Technology, D-52056 Aachen, Germany Email:[email protected]
Hermann Ney
Lehrstuhl f¨ur Informatik VI, Computer Science Department, RWTH Aachen, University of Technology, D-52056 Aachen, Germany Email:[email protected]
Received 8 April 2002 and in revised form 30 October 2002
Accessing information in multimedia databases encompasses a wide range of applications in which spoken document retrieval (SDR) plays an important role. In SDR, a set of automatically transcribed speech documents constitutes the files for retrieval, to which a user may address a request in natural language. This paper deals with two probabilistic aspects in SDR. The first part investigates the effect of recognition errors on retrieval performance and inquires the question of why recognition errors have only a little effect on the retrieval performance. In the second part, we present a new probabilistic approach to SDR that is based on interpolations between document representations. Experiments performed on the TREC-7 and TREC-8 SDR task show comparable or even better results for the new proposed method than other advanced heuristic and probabilistic retrieval metrics.
Keywords and phrases:spoken document retrieval, error analysis, probabilistic retrieval metrics.
1. INTRODUCTION
Retrieving information in large, unstructured databases is one of the most important tasks computers use for today. While in the past, information retrieval focused on search-ing written texts only, the field of applications has since then extended to multimedia data such as audio and video docu-ments which are growing every day in broadcast and media. Nowadays, radio and TV stations hold huge archives contain-ing numberless documents that were produced and collected over the years. However, since these documents are usually neither indexed nor catalogued, the respective document col-lections are effectively not usable and thus the data stocks are idle. Therefore, the need of efficient methods enabling content-based access to little or even unstructured multime-dia archives is of eminent importance.
1.1. Spoken document retrieval
A particular application in the domain of information re-trieval is the content-based access to audio data in which spo-ken document retrieval(SDR) plays an important role. SDR extends the techniques developed in text retrieval to audio documents containing speech. To this purpose, the audio
documents are automatically segmented and transcribed by a speech recognizer in advance. The resulting transcriptions are indexed and subsequently stored in large databases, thus constituting the files for retrieval, to which a user may ad-dress a request in natural language.
Over the past years, research shifted from pure text re-trieval to SDR. However, since also state-of-the-art speech recognizers are still error-prone and thus far from perfect recognition, automatically generated transcriptions are often flawed, and not seldom they achieve word accuracies of less than 80% as, for example, on broadcast news transcription tasks [1].
also holds for tasks, where automatically generated transcrip-tions achieve word error rates of up to 40% (see the experi-mental results inSection 3.1). Although this was the
unan-imous result of past TREC evaluations [2,3], the reasons
are only insufficiently examined. In this paper, we conduct a probabilistic analysis of errors in SDR. To this purpose, we propose two new error criteria that are more suitable in order to quantify the appropriateness of automatically gen-erated transcriptions for retrieval applications. The second part of this paper attends to probabilistic retrieval metrics for SDR. Although probabilistic retrieval metrics are usually bet-ter motivated in bet-terms of a mathematically well-founded the-ory than their heuristic counterparts, they often suffer from lower performances. In order to compensate for this short-coming, we propose a new statistical approach to informa-tion retrieval based on a measure fordocument similarities. Experimental results for both the error analysis and the new statistical approach are presented on the 7 and TREC-8 SDR task.
The structure of this paper is as follows. InSection 2, we start with a brief introduction to heuristic retrieval metrics. In order to improve the baseline performance, we propose
a new method for query expansion. Section 3is about the
effect of recognition errors on retrieval performance. It in-cludes a detailed error analysis and presents the datasets used for the experiments. InSection 4, we propose the new sta-tistical approach to information retrieval and give detailed results of the experiments conducted. We conclude the paper with a summary inSection 5.
2. HEURISTIC RETRIEVAL METRICS IN SDR
Among the proposed heuristic approaches to information retrieval, theterm-frequency/inverse-document-frequency (tf-idf) metric belongs to the best investigated retrieval met-rics. Due to its simple structure in combination with a fairly well initial performance, tf-idf forms the basis for several ad-vanced retrieval metrics. In the following section, we give a brief introduction to tf-idf in order to introduce the termi-nology used in this paper and to form the basis for all further considerations.
2.1. Baseline methods
LetᏰ:= {d1, . . . ,dK}be a set ofK documents and letw =
w1, . . . , wsdenote a request given as a sequence ofswords.
A retrieval system transforms w into a set of query terms
q1, . . . , qm (m ≤ s) which are used to retrieve those
doc-uments that preferably should meet the user’s information need. To this purpose, all words that are of “low semantic worth” for the actual retrieval process are eliminated (stop-ping) while the residual words are reduced to their morpho-logical stem (stemming) using, for example, Porter’s stem-ming algorithm [4]. Documents are preprocessed in the same manner as the queries are. The remaining words, also re-ferred to asindex terms, constitute the features that describe a document or query. In the following, index terms are de-noted bydor qif they are associated with a certain docu-mentdor queryq; otherwise, we use the symbolt. Let᐀:=
{t1, . . . , tT}be a set of index terms and letᏽ:= {q1, . . . ,qL}
denote a set of queries. Then both documents and queries are given as sequences of index terms
dk=dk,1, . . . , dk,Ik, dk∈Ᏸwithdk,i∈᐀
1≤i≤Ik
,
ql=ql,1, . . . , ql,Jl, ql∈ᏽwithql, j ∈᐀
1≤j≤Jl
. (1)
Each queryq∈ᏽpartitions the document setᏰinto a sub-set Ᏸrel(q) containing all documents that are relevant with
respect toq, and the complementary setᏰirr(q) containing
the residual, that is, all irrelevant documents. The number of occurrences of an index termtin a documentdkand a query ql, respectively, is denoted by
nt,dk
:= Ik
i=1
δt, dk,i
, nt,ql
:= Jl
j=1
δt, ql, j
(2)
with δ(·,·) as theKronecker function. The counts n(t,dk)
in (2) are also referred to asterm frequenciesof document
dk. Using n(t,dk) from (2), we define the document
fre-quencyn(t) as the number of documents containing the in-dex termt,
n(t) := K
k=1 n(t,dk)>0
1. (3)
With the definition of theinverse document frequency
idf(t) :=log 1 +K
1 +n(t), (4)
a document specific weight ω(t,d) and a query specific weightω(t,q) is assigned to each index termt. These weights are defined as the product over the term frequenciesn(t,d) andn(t,q), respectively, and the inverse document frequen-cies
ω(t,d) :=n(t,d)·idf(t),
ω(t,q) :=n(t,q)·idf(t). (5)
Given a queryq, a retrieval system rates each document in the database whether or not it may meet the request. The result is aranking listincluding all documents that are sup-posed to be relevant with respect toq. To this purpose, we de-fine aretrieval function f that in case of using the tf-idf met-ric is defined as the product over all weights of index terms occurring inqas well as ind, normalized by the length of the queryqand the documentd,
f(q,d) :=
t∈᐀ω(t,q)·ω(t,d)
t∈᐀n2(t,q)· t∈᐀n2(t,d)
. (6)
a document, the better it may meet the query and the more important it may be for the user.
2.2. Advanced retrieval metrics
Based on the tf-idf metric, several modifications were pro-posed in literature leading, for example, to the Okapi metrics [5] as well as the SMART-1 and the SMART-2 metric [6]. The baseline results conducted for this paper use the following version of the SMART-2 metric. Here, the inverse document frequencies are given by
idf (t) :=log
K n(t)
. (7)
Note that due to the floor operation in (7), a term weight will be zero if it occurs in more than half of the documents. According to [7], each index termtin a documentdis asso-ciated with a weightg(t,d) that depends on the ratio of the logarithm of the term frequencyn(t,d) to the logarithm of the average term frequencyn(d),
g(t,d) :=
1 + logn(t,d)
1 + logn(d) , ift∈d,
0, ift /∈d
(8)
with log 0 :=0 and
n(d)=
t∈᐀n(t,d)
t∈᐀:n(t,d)>01
. (9)
The logarithms in (8) prevent documents with high term fre-quencies from dominating those with low term frefre-quencies. In order to obtain the final term weights,g(t,d) is divided
by a linear combination between a pivot elementcand the
number of singletonsn1(d) in documentd,
ω(t,d) := g(t,d)
(1−λ)·c+λ·n1(d)
(10)
withλ=0.2 and
c= 1
K
K
k=1
n1
dk
,
n1(d) :=
t∈᐀:n(t,d)=1
1.
(11)
Unlike tf-idf, only query terms are weighted with the inverse document frequency idf(t)
ω(t,q)=1 + logn(t,q)·idf (t). (12)
Now, we can define the SMART-2 retrieval function as the product over the document and query specific index term weights
f(q,d)=
t∈᐀
ω(t,q)·ω(t,d). (13)
˚ ˚
˚
˚ ˚
˚ ˚ ˚ ˚
˚
˚
˚ ˚
˚
edirr eq
edrel ρq
Dirr
Drel
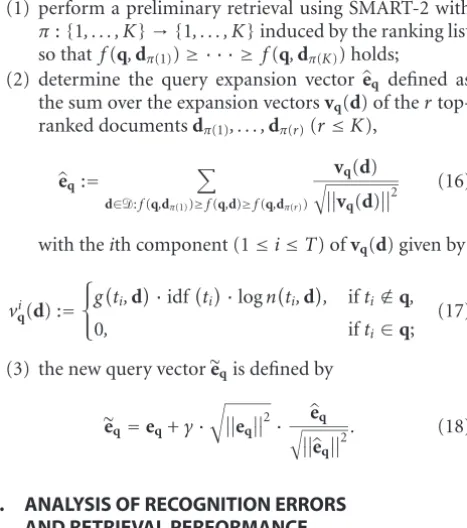
Figure1: Principle of query expansion: using the difference
vec-torρq, the original query vectoreqis shifted towards the subset of
relevant documents.
2.3. Improving retrieval performance
Often, the retrieval effectiveness can be improved using inter-active search techniques such asrelevance feedbackmethods. Retrieval systems providing relevance feedback conduct a preliminary search and present the top-ranked documents to the user who has to rate each document whether it meets his information need or not. Based on this relevance judgment, the original query vector is modified in the following way. Let
Ᏸrel(q) be the subset of top-ranked documents rated as
rele-vant, and letᏰirr(q) denote the subset of irrelevant retrieved
documents. Further, leteddenote the documentdembedded
into a T-dimensional vector ed = (n(t1,d), . . . , n(tT,d)),
and let eq = (n(t1,q), . . . , n(tT,q)) denote the vector
em-bedding of the queryq. Then, the difference vectorρqdefined by
ρq=
1
Ᏸrel(q)·
d∈Ᏸrel(q) ed−
1
Ᏸirr(q)·
d∈Ᏸirr(q)
ed (14)
connects the centroids of both document subsets. Therefore, it can be used in order to shift the original query vectoreq
towards the cluster of relevant documents, resulting in a new query vectoreq(seeFigure 1)
eq=(1−γ)·eq+γ·ρq (0≤λ≤1). (15)
This method is also known asquery expansion, and the Roc-chio algorithm[8] counts among the best known implemen-tations of this idea although there are many others as well [9,10,11]. Assuming that ther top-ranked documents of the preliminary search are (most likely) relevant, interactive search techniques can be automated by settingᏰrel(q) to the
firstrretrieved documents, whereasᏰirr(q) is set to∅.
Table1: Corpus statistics for the TREC-7 and the TREC-8 spoken document retrieval task.
TREC-7 TREC-8
All Rel. Irr. All Rel. Irr.
# Documents 2866 348 2518 21745 1679 20066
# Queries 23 — — 50 — —
Avg. doc. length 267.4 580.1 265.5 169.6 283.9 169.4
query expansion that solely uses the actual retrieval corpus while preserving robustness towards recognition errors. The approach comprises the following three steps:
(1) perform a preliminary retrieval using SMART-2 with π:{1, . . . , K} → {1, . . . , K}induced by the ranking list so that f(q,dπ(1))≥ · · · ≥ f(q,dπ(K)) holds;
(2) determine the query expansion vectoreq defined as
the sum over the expansion vectorsvq(d) of ther
top-ranked documentsdπ(1), . . . ,dπ(r)(r≤K),
eq:=
d∈Ᏸ:f(q,dπ(1))≥f(q,d)≥f(q,dπ(r))
vq(d)
vq(d)2 (16)
with theith component (1≤i≤T) ofvq(d) given by
vi q(d) :=
g
ti,d
·idfti
·lognti,d
, ifti∈/ q,
0, ifti∈q;
(17)
(3) the new query vectoreqis defined by
eq=eq+γ·
eq2· eq eq
2. (18)
3. ANALYSIS OF RECOGNITION ERRORS
AND RETRIEVAL PERFORMANCE
Switching from manual to recognized transcriptions raises the question of robustness of retrieval metrics towards recog-nition errors. Automatic speech recogrecog-nition (ASR) systems may insert new words into the original sequence of spoken words while substituting or deleting others that might be es-sential in order to filter out the relevant portion of a doc-ument collection. In ASR, the performance is usually
mea-sured in terms of word error rate(WER). The WER is
de-fined as theLevenshteinor edit distance, which is the minimal number of insertions (ins), deletions (del), and substitutions (sub) of words necessary to transform the spoken sentence into the recognized sentence. The relative WER is defined by
WER :=
K
k=1
subk+ insk+ delk
N . (19)
Here,N is the total number of words in the reference tran-scriptions of the document collectionᏰ. The computation of the WER requires an alignment of the spoken sentence with
the recognized sentence. Thus, the order of words is explicitly taken into account.
3.1. Tasks and experimental results
Experiments for the investigation on the effect of recogni-tion errors on retrieval performance were carried out on the TREC-7 and the TREC-8 SDR task using manually seg-mented stories [3]. The TREC-7 task comprises 2866 docu-ments and 23 test queries. The TREC-8 task comprises 21745
spoken documents and 50 test queries.Table 1summarizes
some corpus statistics.
Recognition results on the TREC-7 SDR tasks were produced using the RWTH large vocabulary continuous-speech recognizer (LVCSR) [12]. The recognizer uses a time-synchronous beam search algorithm based on the concept of word-dependent tree copies and integrates the trigram language-model constraints in a single pass. Besides acous-tic and histogram pruning, a look-ahead technique of the language-model probabilities is utilized [13]. Recognition re-sults were produced using gender-independent models. Nei-ther speaker-adaptive nor any normalization methods were applied. Every nine consecutive feature vectors, each consist-ing of 16 cepstral coefficients, are spliced and mapped onto a 45-dimensional feature vector using a linear discriminant analysis(LDA). The segmentation of the audio stream into speech and nonspeech segments is based on a Gaussian mix-ture distribution model.
Table 2shows the effect of recognition errors on retrieval
performance, measured in terms of mean average precision
(MAP) [14] for different retrieval metrics on the TREC-7
SDR task. Even though the WER of the recognized transcrip-tions is 32.5%, the retrieval performance decreases by only 9.9% relative using the SMART-2 metric in comparison with the original, that is, the manually generated transcriptions. The relative loss is even smaller (approx. 5% relative) if the new query expansion method is used.
Table2: Retrieval effectiveness measured in terms of MAP on the TREC-7 and the TREC-8 SDR task. All WERs were determined without NIST rescoring. The numbers in parentheses indicate the relative change between text and speech-based results.
MAP[%]
Metric TREC-7 TREC-8
Text
tf-idf 42.1 47.6
SMART-2 46.6 49.6
q-expansion 53.4 57.5
tf-idf 35.3 (−16.2%) 41.3 (−13.2%) 42.0 (−11.8%) SMART-2 42.0 (−9.9%) 43.1 (−13.1%) 42.1 (−15.1%) Speech q-expansion 50.7 (−5.1%) 50.0 (−13.0%) 49.8 (−13.4%)
WER[%] 32.5 38.4 40.3
(RWTH) (Byblos) (Dragon)
performance loss is nearly constant, that is, the transcriptions as produced by the Byblos speech recognizer cause a perfor-mance loss of 13.0% relative, whereas the transcriptions gen-erated by the Dragon system cause a degradation of 13.4% relative.
3.2. Alternative error measures
Since most retrieval metrics usually disregard word orders, the WER is certainly not suitable in order to quantify the quality of recognized transcriptions for retrieval applica-tions. A more reasonable error measure is given by theterm error rate(TER) as proposed in [17]
TER := 1
K·
K
k=1
t∈᐀nt,dk
−nt,dk
Ik . (20)
As before,Ik denotes the number of index terms in the
reference document dk, n(t,dk) is the original term
fre-quency, andn(t,dk) denotes the term frequency of the termt
in the recognized transcriptiondk. Note that a substitution
error according to the WER produces two errors in terms of the TER since it not only misses a correct word but also introduces a spurious one. Consequently, we have to count substitutions twice in order to compare both error measures. Nevertheless, the alignment on which the WER computation is based must still be determined using uniform costs, that is, substitutions are counted once. Using the definitions
delt
d,d:=
n
t,d−nt,d, n(t,d)< n(t,d),
0, otherwise,
inst
d,d:=
nt,d−n(t,d), nt,d> n(t,d),
0, otherwise,
(21)
the TER can be rewritten as
TER= 1
K
K
k=1
t∈᐀
delt
dk,dk
+ inst
dk,dk
Ik .
(22)
Since the contributions of term frequencies to term weights are often diminished by the application of logarithms (see (8)), the number of occurrences of an index term within a
document d is of less importance than the fact whether a
termdoesoccur indor not. Therefore, we propose the in-dicator error rate(IER) that is defined by
IER := 1
K ·
K
k=1 ᐀d
k\᐀dk+᐀dk\᐀dk
᐀d
k
(23)
with
᐀dk:=
dk,1, . . . , dk,Ik
(1≤k≤K). (24)
The IER discards term frequencies and measures the number of index terms that were missed or wrongly added during recognition. If we transfer the conceptsrecallandprecisionto pairs of documents, we will obtain a motivation for the IER. To this purpose, we define
recalld,d:=᐀d∩᐀d
᐀d ,
precd,d:=᐀d∩᐀d
᐀
d
.
(25)
Note that a high recall means that the recognized transcrip-tiondcontains many index terms of the reference transcrip-tiond. A low precision means that the recognized transcrip-tion contains many index terms that do not occur in the ref-erence transcription. Both the recall and precision errors are given by
1−recall(d,d)=᐀d\᐀d
᐀d ,
1−prec(d,d)=᐀d\᐀d
᐀d
.
(26)
Table3: WER, TER, and IER measured with the RWTH speech recognizer on the TREC-7 corpus for varying preprocessing stages. Note that the substitutions are counted twice for the accumulated error rates of the WER criterion.
TREC-7 TREC-7 + Stop + Stem + Stop + Stem, Queries only Documents All Relevant Irrelevant All Relevant Irrelevant All Relevant Irrelevant
WER[%]
deletions 4.8 3.9 4.9 8.5 6.3 8.8 11.1 8.2 11.5
insertions 4.7 4.1 4.8 2.6 2.4 2.6 8.7 6.7 9.0
substitutions 21.6 18.4 22.1 17.0 14.2 17.3 5.3 4.7 5.4
error rate 52.8 44.7 53.9 45.0 37.2 46.0 30.3 24.4 31.2
TER[%]
deletions 21.8 17.4 22.4 24.0 19.2 24.6 12.0 10.8 12.2
insertions 22.8 17.9 23.5 18.9 15.5 19.3 17.5 10.8 18.4
error rate 44.6 35.3 45.9 42.8 34.7 43.9 29.5 21.5 30.6
IER[%]
deletions 16.3 13.9 16.6 17.4 14.2 17.9 8.8 7.0 9.0
insertions 16.3 14.2 16.5 15.1 13.6 15.3 10.7 8.4 11.0
error rate 32.5 28.1 33.1 32.5 27.8 33.2 19.5 15.5 20.0
usually set to values ensuring balanced numbers of deletions and insertions, we obtain the following interpretation of the IER:
IER= 1
K·
K
k=1
᐀dk\᐀
dk+᐀dk\᐀dk ᐀dk
≈ 1
K·
K
k=1
1−᐀dk\᐀dk
᐀dk + 1−᐀dk\᐀dk
᐀
dk
= 1
K·
K
k=1
2−recalldk,dk
−precdk,dk
.
(27)
Table 3shows the error rates obtained on the TREC-7 SDR task for the three error measures: WER, TER, and IER. Note that substitution errors are counted twice in order to be comparable with the TER. The initial WER thus obtained is 52.8% on the whole document collection, whereas TER leads to an initial error rate of 44.6%. So far, we have not yet taken into account the effect of document preprocessing steps, that is, stopping and stemming. If we consider index terms only, TER decreases to 42.8%. Moreover, we can restrict the index terms to query terms only. Thus, TER decreases to 29.5%. Note that this magnitude will correspond to a WER of 17.4% if we convert TER into WER using the initial ratio of dele-tions, inserdele-tions, and substitutions of 4.8 : 4.7 : 21.6. Fi-nally, we can apply the indicator error measure which leads to an IER of 19.5%, thus corresponding to WER of 17.4%. Similar results were observed on the TREC-8 SDR task using the recognition outputs of the Byblos and the Dragon speech recognition system, respectively (see Tables8and9).Table 4
summarizes the most important error rates of Tables 3,8,
and9.
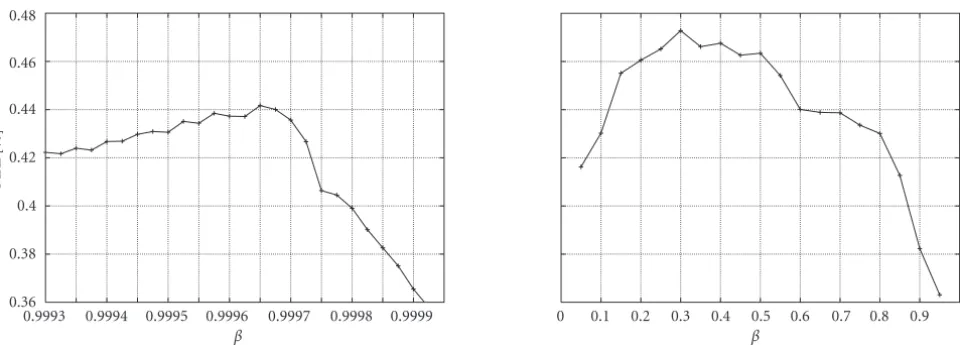
For each error measure, we can determine the accuracy rate which is given by max(1−ER,0), where ER is the WER, the TER, or the IER, respectively. Assuming a linear de-pendency of the retrieval effectiveness on the accuracy rate, we can compute the squared empirical correlation between the MAP obtained on the recognized documents and the
Table4: Summary of different error measures on the TREC-7 and
TREC-8 SDR task. Substitution errors (sub) are counted once (sub 1×) or twice (sub 2×), respectively.
Doc. Error measure TREC-7 TREC-8 RWTH Byblos Dragon
All
WER[%] (sub 1×) 32.5 38.4 40.3 (sub 2×) 52.8 60.3 61.3
TER[%]
44.6 52.2 53.2 + stop + stem 42.8 48.8 49.2 q-terms only 29.5 34.8 36.7 IER[%] q-terms only 19.5 22.3 23.4 Rel. IER[%] q-terms only 15.5 18.0 18.7
Table5: Squared empirical correlation between the MAP obtained
on the recognized documents and the MAP obtained on the refer-ence documents multiplied with the word accuracy (WA) rate, the term accuracy (TA) rate, and the indicator accuracy (IA) rate, re-spectively.
Accuracy rate tf-idf SMART-2 q-expansion
WA 0.741 0.323 0.010
TA 0.475 0.007 0.567
IA 0.937 0.845 0.688
3.3. Further discussion
In this section, we investigate the magnitude of the perfor-mance loss from a theoretical point of view. To this purpose, we consider the retrieval process in detail. When a user ad-dresses a query to a retrieval system, each document in the database is rated according to its RSV. The induced ranking
list determines a permutationπof the documents that can
be mapped onto a vector indicating whether or not the doc-umentdiat positionπ(i) is relevant with respect toq. Let f
be a retrieval function. Then, the application of f to a docu-ment collectionᏰgiven a queryqleads to the permutation fq(Ᏸ) = (dπ(1),dπ(2), . . . ,dπ(K)) with π induced by the
fol-With the definition of the indicator function
Ᏽq(d) :=
the ranking list can be mapped onto a binary vector
Ᏽq
Even though the deterioration of transcriptions as caused by recognition errors may change the indicator vector, a per-formance loss will only occur if the RSVs of relevant doc-uments fall below the RSVs of irrelevant docdoc-uments. Note that among the four possible cases of local exchange opera-tions between documents, that is,Ᏽq(dπ(i))∈ {0,1}changes
its position withᏵq(dπ(j))∈ {0,1}(i=j), only one case can
cause a performance loss. Interestingly, it is possible to spec-ify an upper bound for the probability that two documents
dianddj with f(q,di)> f(q,dj) will change their relative
order if they are deteriorated by recognition errors, that is, f(q,di)< f(q,dj) will hold for the recognized documentsdi
Here, pc(t) denotes the probability that t is correctly
rec-ognized, pe(t) is the probability that t is recognized even
though τ (τ =t) was spoken, andl(d) is a document spe-cific length normalization that depends on the used retrieval metric. Thus, the upper bound for the probability of chang-ing the order of two documents is vanishchang-ing for increaschang-ing document lengths [14, page 135]. In particular, this means that the relevant documents of the TREC-7 and the TREC-8 corpus are less affected by recognition errors than irrelevant documents since the average length of relevant documents is substantially larger than the average length of irrelevant doc-uments (seeTable 1).
Now, let π0 : {1, . . . , K} → {1, . . . , K} denote a
per-At the beginning,Ais an upper triangular matrix whose di-agonal elements are zero. Since exchanges between relevant documents and exchanges between irrelevant documents do not affect the retrieval performance, each matrix elementai j
will be set to 0 if{dπ0(i),dπ0(j)} ⊆Ᏸ
rel(q) or{d
π0(i),dπ0(j)} ⊆ Ᏸirr(q). Then, the expectation of the ranking, that is, the
per-mutation π maximizing the MAP of the recognized
docu-ments, can be determined according toAlgorithm 1using a
greedy policy.
4. PROBABILISTIC APPROACHES TO IR
Besides heuristically motivated retrieval metrics, several probabilistic approaches to information retrieval were pro-posed and investigated over the past years. The methods range from binary independence retrieval models [19] over language model-based approaches [20] up to methods based on statistical machine translation [21]. The starting point of most probabilistic approaches to IR is the a posteriori prob-ability p(d|q) of a documentdgiven a queryq. The pos-terior probability can be directly interpreted as RSV. In con-trast to many heuristic retrieval models, RSVs of probabilistic approaches are thus always normalized and even compara-ble between different queries. Often, the posterior probabil-ity p(d|q) is denoted byp(d, b∈ {rel,irr}|q), with the ran-dom variablebindicating the relevance ofdwith respect toq. However, since we consider noninteractive retrieval methods only,bis not observable and therefore obsolete since it can-not affect the retrieval process. The a posteriori probability can be rewritten as
p(d|q)= p(d)·p(q|d)
d∈Ᏸpd
·pq|d. (34)
A document maximizing (34) is determined using Bayes’ de-cision rule
q−→r(q)=argmax
d
p(q|d)·p(d). (35)
This decision rule is known to be optimal with respect to the expected number of decision errors if the required distribu-tions are known [22]. However, as neither p(q|d) nor p(d) are known in practical situations, it is necessary to choose models for the respective distributions and estimate their pa-rameters using suitable training data. Note that (35) can be easily extended to a ranking by determining not only the doc-ument maximizing p(d|q), but also by compiling a list that contains all documents sorted in descending order with re-spect to their posterior probability.
In the recent past, several probabilistic approaches to in-formation retrieval were proposed and evaluated. In [21] the authors describe a method based on statistical machine translation. A query is considered as a sequence of keywords extracted from an imaginary document that best meets the user’s information need. Pairs of queries and documents are considered as bilingual annotated texts, where the objective of finding relevant documents is ascribed to a translation of a query (source language) into a document (target language). Experiments were carried out on various TREC tasks. Using the IBM-1 translation model [23] as well as a simplified ver-sion called IBM-0, the obtained retrieval effectiveness out-performed the tf-idf metric.
The approach presented in [24] makes use of multistate hidden Markov models (HMM) to interpolate document-specific language models with a background language model. The background language model that is estimated on the whole document collection is used in order to smooth the probabilities of unseen index terms in the document-specific
language models. Experiments performed on the TREC-7 ad hoc retrieval task showed better results than tf-idf.
In [25], the authors investigate an advanced version of the Markovian approach as proposed by [24]. Experiments conducted on the TREC-7 and TREC-8 SDR tasks achieve a retrieval effectiveness that is comparable with the Okapi met-ric, but does not outperform the SMART-2 results.
Even though many probabilistic retrieval metrics are able to outperform basic retrieval metrics as, for example, tf-idf, they usually do not achieve the effectiveness of advanced heuristic retrieval metrics such as SMART-2 or Okapi. In particular, for SDR tasks, probabilistic metrics often turned out to be less robust towards recognition errors than their heuristic counterparts. To compensate for this, we propose a new statistical approach to information retrieval that is based on document similarities [26].
4.1. Probabilistic retrieval using document representations
A fundamental difficulty in statistical approaches to infor-mation retrieval is the fact that typically a rare index term is well suited to filter out a document. On the other hand, a reliable estimation of distribution parameters requires that the underlying events, that is, index terms, are observed as frequently as possible. Therefore, it is necessary to prop-erly smooth the distributions. In our case, document-specific term probabilities p(t|d) are smoothed with term probabil-ities of documents that are similar tod. The similarity mea-sure is based ondocument representationswhich in the sim-plest case can be document-specific histograms of the index terms.
The starting point of our approach is the joint probability p(q,d) of a queryqand a documentd,
Here,|q|denotes the number of index terms inq. The con-ditional probabilitiesp(qj,d|q1j−1) in (36) are assumed to be
independent of the predecessor termsq1j−1. Document
rep-resentations are now introduced via a hidden variablerthat runs over a finite setRof document representations,
Here, two model assumptions have been made: first, the con-ditional probabilities p(q|d,r) are assumed to be indepen-dent ofd(see (39)) and secondly, p(di|r, d1i−1) will not
de-pend on the predecessor termsdi1−1(see (41)). 4.2. Variants of interpolation
It remains to specify models for the document representa-tionsr ∈R as well as the distributions p(q|r), p(d|r), and p(r). Since we want to distinguish between the event that
a query term t is predicted by a representation r and the
event that the term to be predicted is part of a document, p(q|r) and p(d|r) are modeled differently. In our approach, we identify the set of document representationsRwith the histograms over the index terms of the document collection
Ᏸ,
nr(t)≡n(t,d), nr(·)≡ |d|,
n(t)≡ d∈Ᏸ
n(t,d), n(·)≡ d∈Ᏸ
|d|. (42)
Thus, we can define the interpolationspq(t|r) andpd(t|r) as
models forp(q|r) andp(d|r),
pq(t|r) :=(1−α)· nr
(t) nr(·)
+α·n(t)
n(·), (43)
pd(t|r) :=(1−β)· nr(t)
nr(·)
+β·n(t)
n(·). (44)
Since we do not make any assumptions about the a priori relevance of a document representation, we set up a uniform distribution for p(r). Note that (44) is an interpolation be-tween the relative countsnr(t)/nr(·) andn(t)/n(·). Instead
of interpolating between the relative frequencies as in (44), we can also interpolate between the absolute frequencies
pd(t|r) :=
(1−β)·nr(t) +β·n(t)
(1−β)·nr(·) +β·n(·).
(45)
Both interpolation variants will be discussed in the following section.
4.3. Experimental results
Experiments were performed on the 7 and the TREC-8 SDR task using both the manually generated transcriptions and the automatically generated transcriptions. As before, all speech recognition outputs were produced using the RWTH LVCSR system for the TREC-7 corpus or taken from the Byb-los “Rough ’N Ready” and the Dragon LVCSR system for the TREC-8 corpus.
Due to the small number of test queries for both retrieval tasks, we made use of a leaving-one-out (L-1-O) approach [27, page 220] in order to estimate the interpolation param-etersαandβ. Additionally, we added results under unsuper-vised conditions, that is, we optimized the smoothing
coef-ficientsαandβon TREC-8 queries and corpus and tested
on the TREC-7 sets and vice versa. Finally, we carried out
a cheating experiment by adjusting the parametersαandβ
to maximize the MAP on the complete set of test queries.
1 0.9 0.8 0.7 0.6 0.5 0.4 0.3 0.2 0.1 0
α
0.2 0.25 0.3 0.35 0.4 0.45 0.5
MAP[%]
Figure2: MAP as a function of the interpolation parameterαwith
fixedβ=0.300 on the reference transcriptions of the TREC-7 SDR task.
This yields an optimistically upper bound of the possible retrieval effectiveness. All experiments conducted are based on the document representations according to (42), that is, each document is smoothed with all other documents in the database.
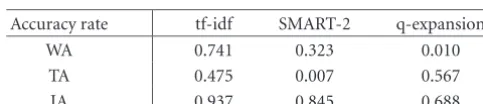
In a first experiment, the interpolation parameterαwas estimated.Figure 2shows the MAP as a function of the in-terpolation parameterαwith fixedβon the reference tran-scriptions of the TREC-7 corpus. Using the L-1-0 estimation scheme, the best value forαwas found to be 0.742, which has to be compared with a globally optimal value of 0.875, that is, the cheating experiment without L-1-O. The interpolation parameterβwas adjusted in a similar way. Using the interpo-lation scheme according to (44), the retrieval effectiveness on both tasks is maximum for values ofβthat are very close to 1. This effect is caused by singletons, that is, index terms that occur once only in the whole document collection. Since the magnitude of the ratio of both denominators in (44) is ap-proximately
nr(·)
n(·) ≈ 1
D, (46)
the optimal value for β should be found in the range of
1−1/D, assuming that singletons are the most important features in order to filter out a relevant document. In fact, usingβ=1−1/Dexactly meets the optimal value of 0.99965 on the TREC-7 corpus and 0.99995 on the TREC-8 retrieval task.
0.9999 0.9998 0.9997 0.9996 0.9995 0.9994 0.9993
β
0.36 0.38 0.4 0.42 0.44 0.46 0.48
MAP[%]
0.9 0.8 0.7 0.6 0.5 0.4 0.3 0.2 0.1 0
β
Figure3: MAP as a function of the interpolation parameterβaccording to (44) (left plot) and (45) (right plot) with fixedα=0.875 on the
reference transcriptions of the TREC-7 SDR task.
Table6: Comparison of retrieval effectiveness measured in terms
of MAP on the TREC-7 SDR task for the SMART-2 metric and the new probabilistic approach Prob. Interpolation was performed ac-cording to (45).
TREC-7 Metric α β MAP[%]
Text
SMART-2 — — 46.6
Prob
“cheating” 0.875 0.300 47.3 L-1-O 0.742 0.270 45.8 unsupervised 0.950 0.650 42.2
Speech (RWTH)
SMART-2 — — 42.0
“cheating” 0.825 0.300 42.0 Prob L-1-O 0.697 0.257 40.4 unsupervised 0.875 0.300 41.6
slightly better results, it was used for all further experiments. Table 6shows the obtained retrieval effectiveness for the new probabilistic approach on the TREC-7 SDR task. Using L-1-O, the retrieval performance of the new proposed method lies within the magnitude of the SMART-2 metric, that is,
we obtained a MAP of 45.8% on manually transcribed data
which must be compared with 46.6% using the SMART-2 retrieval metric. Using automatically generated
transcrip-tions, we achieved a MAP of 40.4% which is close to the
performance of the SMART-2 metric. A further performance gain could be obtained under unsupervised conditions. Us-ing the optimal parameter settUs-ing of the TREC-8 corpus for
the TREC-7 task achieved a MAP of 41.6%.Figure 4shows
the recall-precision graphs for both SMART-2 and the new probabilistic approach.
The same applies to the results obtained on the
TREC-8 SDR task (see Table 7). Here, the new probabilistic
ap-proach even outperformed the SMART-2 retrieval metric.
Thus, we obtained a MAP of 51.3% on the manually
tran-Table7: Comparison of retrieval effectiveness measured in terms
of MAP on the TREC-8 SDR task for the SMART-2 metric and the new probabilistic approach Prob. Interpolation was performed ac-cording to (45).
TREC-8 Metric α β MAP[%]
Text
SMART-2 — — 49.6
Prob
“cheating” 0.950 0.650 52.7 L-1-O 0.947 0.646 51.3 unsupervised 0.875 0.300 49.9
Speech (Byblos)
SMART-2 — — 43.1
“cheating” 0.875 0.300 47.3 Prob L-1-O 0.801 0.287 44.4 unsupervised 0.825 0.300 47.2
Speech (Dragon)
SMART-2 — — 42.1
“cheating” 0.875 0.300 45.6 Prob L-1-O 0.875 0.307 44.1 unsupervised 0.825 0.300 45.2
scribed data in comparison with 49.6% for the SMART-2
metric. This improvement over SMART-2 is also obtained on recognized transcriptions even though the improvement is smaller. Thus, we achieved a MAP of 44.4% on the auto-matically generated transcriptions produced with the Byb-los speech recognizer, which is an improvement of 3%
rel-ative compared to the SMART-2 metric, and 44.1% MAP
Table8: WER, TER, and IER measured with the Byblos speech recognizer on the TREC-8 corpus for varying preprocessing stages. As before, the substitutions are counted twice for the accumulated error rates of the WER criterion.
TREC-8 TREC-8 + Stop + Stem + Stop + Stem, Queries only Documents All Relevant Irrelevant All Relevant Irrelevant All Relevant Irrelevant
WER[%]
Deletions 5.2 6.1 5.1 8.2 7.6 8.2 14.5 11.5 14.7
Insertions 11.3 10.0 11.4 7.6 7.1 7.6 8.6 7.7 8.7
Substitutions 21.9 19.8 22.1 18.2 16.2 18.3 6.2 5.7 6.3
Error rate 60.3 55.6 60.7 52.1 47.1 52.5 35.6 30.7 36.0
TER[%]
Deletions 22.3 19.4 22.6 24.2 21.3 24.4 14.2 13.3 14.3
Insertions 29.8 27.2 30.1 24.7 22.5 24.8 20.6 14.5 21.1
Error rate 52.2 46.6 52.6 48.8 43.8 49.2 34.8 27.7 35.4
IER[%]
Deletions 16.2 14.9 16.3 17.3 15.4 17.5 10.5 8.8 10.6
Insertions 18.9 17.0 19.1 17.4 15.9 17.5 11.8 9.2 12.0
Error rate 35.1 31.9 35.4 34.7 31.4 35.0 22.3 18.0 22.7
Table9: WER, TER, and IER measured with the Dragon speech recognizer on the TREC-8 corpus for varying preprocessing stages. As
before, the substitutions are counted twice for the accumulated error rates of the WER criterion.
TREC-8 TREC-8 + Stop + Stem + Stop + Stem, Queries only Documents All Relevant Irrelevant All Relevant Irrelevant All Relevant Irrelevant
WER[%]
Deletions 6.5 6.9 6.5 8.9 7.4 9.1 15.6 11.5 15.9
Insertions 12.7 11.2 12.9 8.0 7.5 8.0 9.4 8.3 9.5
Substitutions 21.0 18.5 21.2 17.7 15.6 17.9 6.2 5.3 6.2
Error rate 61.3 55.0 61.8 52.3 46.2 52.8 37.3 30.3 37.9
TER[%]
Deletions 22.8 19.2 23.1 24.5 20.7 24.8 14.6 13.2 14.8
Insertions 24.7 22.4 24.9 22.0 14.6 22.7 29.8 27.2 30.1
Error rate 53.2 46.6 53.8 49.2 43.0 49.7 36.7 27.8 37.4
IER[%]
Deletions 17.0 15.0 17.1 17.9 15.2 18.1 11.0 9.3 11.2
Insertions 19.7 17.8 19.9 17.6 16.3 17.7 12.4 9.4 12.6
Error rate 36.7 32.7 37.0 35.5 31.5 35.8 23.4 18.7 23.8
1 0.9 0.8 0.7 0.6 0.5 0.4 0.3 0.2 0.1 0
Recall 0
0.1 0.2 0.3 0.4 0.5 0.6 0.7 0.8 0.9 1
In
te
rp
olat
ed
p
recisio
n
Text: prob Smart
Speech: prob Smart
Figure 4: Interpolated recall-precision graphs for the SMART-2
metric and the new probabilistic approach determined on both the manually transcribed documents (text) and the automatically gen-erated transcriptions (speech) of the TREC-7 SDR task.
1 0.9 0.8 0.7 0.6 0.5 0.4 0.3 0.2 0.1 0
Recall 0
0.1 0.2 0.3 0.4 0.5 0.6 0.7 0.8 0.9 1
In
te
rp
olat
ed
p
recisio
n
Text: prob Smart
Speech: prob Smart
Figure 5: Interpolated recall-precision graphs for the SMART-2
5. CONCLUSION
In this paper, we presented a detailed analysis on the ef-fect of recognition errors on retrieval performance. Since retrieval performance is only little affected by recognition er-rors, we investigated two alternative error measures, namely, the TER and the IER that turned out to be more suitable in order to describe the quality of automatically generated tran-scriptions for retrieval applications. Experiments carried out on the TREC-7 and TREC-8 SDR task revealed a better cor-relation between the obtained retrieval effectiveness and the proposed error measures. Baseline results were produced us-ing a new query expansion method.
In the second part of this paper, we presented a new prob-abilistic approach to SDR based on interpolations between document-specific term histograms and a global term his-togram that is pooled over all documents. To this purpose, the set of documents was mapped onto a set of document representations. These document representations were iden-tified with document-specific histograms and can be inter-preted as a kind of nearest neighbor concept. Two smoothing schemes were discussed and investigated. Experiments per-formed on the TREC-7 and the TREC-8 SDR task showed comparable or even better results for the new probabilistic approach than an enhanced version of the SMART-2 retrieval metric. In addition, the new probabilistic approach turned out to be robust towards recognition errors.
REFERENCES
[1] W. Liggett and W. Fisher, “Insights from the broadcast news benchmark tests,” in Proc. 1998 DARPA Broadcast News Transcription and Understanding Workshop, pp. 16–22, Lans-downe, Va, USA, February 1998.
[2] J. S. Garofolo, E. M. Voorhees, C. G. P. Auzanne, V. M. Stan-ford, and B. A. Lund, “1998 TREC-7 spoken document re-trieval track overview and results,” inProc. 7th Text REtrieval Conference (TREC-7), vol. 500-242 ofNIST Special Publica-tion, pp. 79–89, Gaithersburg, Md, USA, November 1998. [3] J. S. Garofolo, C. G. P. Auzanne, and E. M. Voorhees, “The
TREC spoken document retrieval track: A success story,” in Proc. 8th Text REtrieval Conference (TREC-8), vol. 500-246 ofNIST Special Publication, pp. 107–130, Gaithersburg, Md, USA, November 1999.
[4] M. F. Porter, “An algorithm for suffix stripping,”Program, vol. 14, no. 3, pp. 130–137, 1980.
[5] S. E. Robertson, S. Walker, M. M. Beaulieu, M. Gatford, and A. Payne, “Okapi at TREC-4,” inProc. 4th Text REtrieval Con-ference (TREC-4), D. K. Harman, Ed., pp. 73–96, National In-stitute of Standards and Technology, Gaithersburg, Md, USA, October 1996.
[6] A. Singhal, J. Choi, D. Hindle, D. D. Lewis, and F. C. N. Pereira, “AT&T at TREC-7,” inProc. 7th Text REtrieval Con-ference (TREC-7), vol. 500-242 ofNIST Special Publication, pp. 239–252, Gaithersburg, Md, USA, November 1998. [7] J. Choi, D. Hindle, J. Hirschberg, et al., “An overview of the
AT&T spoken document retrieval,” inProc. 1998 DARPA Broadcast News Transcription and Understanding Workshop, pp. 182–188, Lansdowne, Va, USA, February 1998.
[8] J. J. Rocchio, “Relevance feedback in information retrieval,” inThe SMART Retrieval System—Experiments in Automatic Document Processing, pp. 313–323, Prentice-Hall, Englewood Cliffs, NJ, USA, 1971.
[9] W. Cohen and Y. Singer, “Context-sensitive learning methods for text categorization,” inProc. 19th Annual International ACM SIGIR Conference on Research and Development in In-formation Retrieval, pp. 307–315, Zurich, Switzerland, August 1996.
[10] R. Schapire, Y. Singer, and A. Singhal, “Boosting and Rocchio applied to text filtering,” inProc. 21st Annual International ACM SIGIR Conference on Research and Development in Infor-mation Retrieval, pp. 215–223, Melbourne, Australia, August 1998.
[11] J. Xu and W. B. Croft, “Improving the effectiveness of infor-mation retrieval with local context analysis,” ACM Transac-tions on Information Systems, vol. 18, no. 1, pp. 79–112, 2000. [12] S. Kanthak, A. Sixtus, S. Molau, R. Schl¨uter, and H. Ney, “Fast search for large vocabulary speech recognition,” inVerbmobil: Foundations of Speech-to-Speech Translation, W. Wahlster, Ed., pp. 63–78, Springer-Verlag, Berlin, Germany, 2000.
[13] S. Ortmanns, A. Eiden, and H. Ney, “Improved lexical tree search for large vocabulary speech recognition,” inProc. IEEE Int. Conf. Acoustics, Speech, Signal Processing, vol. 2, pp. 817– 820, Seattle, Wash, USA, May 1998.
[14] P. Sch¨auble, Multimedia Information Retrieval, Kluwer Aca-demic, Boston, Mass, USA, 1997.
[15] F. Kubala, S. Colbath, D. Liu, A. Srivastava, and J. Makhoul, “Integrated technologies for indexing spoken language,” Communications of the ACM, vol. 43, no. 2, pp. 48–56, 2000. [16] S. Wegmann, P. Zhan, I. Carp, M. Newman, J. P. Yameon, and
L. Gillick, “Dragon systems’ 1998 broadcast news transcrip-tion system,” inProc. 1999 DARPA Broadcast News Workshop, pp. 277–280, Herndon, Va, USA, February–March 1999. [17] S. E. Johnson, P. Jourlin, G. L. Moore, K. Sp¨arck Jones, and
P. C. Woodland, “Spoken document retrieval for TREC-7 at Cambridge University,” inProc. 7th Text REtrieval Conference (TREC-7), vol. 500-242 ofNIST Special Publication, pp. 191– 200, Gaithersburg, Md, USA, November 1999.
[18] E. Mittendorf and P. Sch¨auble, “Measuring the effects of data corruption on information retrieval,” inProc. Symposium on Document Analysis and Information Retrieval, pp. 179–189, Las Vegas, Nev, USA, April 1996.
[19] N. Fuhr and C. Buckley, “A probabilistic learning approach for document indexing,” ACM Transactions on Information Systems, vol. 9, no. 3, pp. 223–248, 1991.
[20] J. Ponte and W. B. Croft, “A language modeling approach to information retrieval,” inProc. 21st Annual International ACM SIGIR Conference on Research and Development in Infor-mation Retrieval, pp. 275–281, Melbourne, Australia, August 1998.
[21] A. Berger and J. D. Lafferty, “Information retrieval as statisti-cal translation,” inProc. 22nd Annual International ACM SI-GIR Conference on Research and Development in Information Retrieval, pp. 222–229, Berkeley, Calif, USA, August 1999. [22] R. O. Duda, P. E. Hart, and D. G. Stork,Pattern Classification,
John Wiley & Sons, New York, NY, USA, 2nd edition, 2001. [23] P. F. Brown, S. A. Della Pietra, V. J. Della Pietra, and R. L.
Mercer, “The mathematics of statistical machine translation: Parameter estimation,”Computational Linguistics, vol. 19, no. 2, pp. 263–311, 1993.
[24] D. R. H. Miller, T. Leek, and R. M. Schwartz, “BBN at TREC7: Using hidden Markov models for information retrieval,” in Proc. 7th Text REtrieval Conference (TREC-7), vol. 500-242 ofNIST Special Publication, pp. 133–142, Gaithersburg, Md, USA, November 1999.
[26] H. J. Viechtbauer, “Vergleich heuristischer und statistis-cher Verfahren im Information Retrieval,” Diploma thesis, Lehrstuhl f¨ur Informatik VI, Computer Science Department, RWTH Aachen, University of Technology, Aachen, Germany, September 2001.
[27] K. Fukunaga, Introduction to Statistical Pattern Recognition, Academic Press, San Diego, Calif, USA, 2nd edition, 1990.
Wolfgang Machereyreceived the Diploma degree with honor in computer science in 1999 from Aachen University of Technol-ogy, Germany. Since 1999, he has been a Research Assistant with the Department of Computer Science of Aachen University of Technology. From July to September 2002, he was a summer student at IBM T. J. Watson Research Center, Yorktown Heights, NY. His research interests are in large
vocab-ulary speech recognition, acoustic modeling with the focus on dis-criminative training, and affine feature space transformations, as well as in information retrieval.
Hans J¨org Viechtbauer received the Diploma degree in computer science in 2002 from Aachen University of Technol-ogy, Germany. From July 2000 to February 2002, he was a research supplemental at the Department of Computer Science of Aachen University of Technology. Since July 2002, he has been with RecomMind GmbH, Rheinbach, Germany. His research inter-ests are in information retrieval, speech
recognition, language modeling, and pattern recognition.
Hermann Neyreceived the Diploma degree in physics in 1977 from G¨ottingen Univer-sity, Germany and the Dr.-Ing. degree in electrical engineering in 1982 from Braun-schweig University of Technology, Germany. He has been working in the field of speech recognition, natural language processing, and stochastic modeling for more than 20 years and has authored and coauthored more than 200 papers. In 1977, he joined