Open Access
Proceedings
Mapping of
trans
-acting regulatory factors from microarray data
Jeanette N McClintick
†1,3, Yunlong Liu
†2,3and Howard J Edenberg*
1,3Address: 1Department of Biochemistry and Molecular Biology, Indiana University School of Medicine, 635 Barnhill Drive, MS4063, Indianapolis, Indiana 46202, USA, 2Department of Medicine, Indiana University School of Medicine, 714 North Senate Avenue, EF250G, Indianapolis, Indiana 46202, USA and 3Center for Medical Genomics at Indiana University School of Medicine, 635 Barnhill Drive, MS4063, Indianapolis, Indiana 46202, USA
Email: Jeanette N McClintick - [email protected]; Yunlong Liu - [email protected]; Howard J Edenberg* - [email protected] * Corresponding author †Equal contributors
Abstract
To explore the mapping of factors regulating gene expression, we have carried out linkage studies using expression data from individual transcripts (from Affymetrix microarrays; Genetic Analysis Workshop 15 Problem 1) and composite data on correlated groups of transcripts. Quality measures for the arrays were used to remove outliers, and arrays with sex mismatches were also removed. Data likely to represent noise were removed by setting a minimum threshold of present calls among the non-redundant set of 190 arrays. SOLAR was used for genetic analysis, with MAS5 signal as the measure of expression. Probe sets with larger CVs generated more linkages (LOD > 2.0). While trans linkages predominated, linkages with the largest LOD scores (>4) were mostly cis. Hierarchical clustering was used to generate correlated groups of genes. We tested four composite measures of expression for the clusters. The average signal, average normalized signal, and the first principal component of the data behaved similarly; in 8/19 clusters tested, the composite measures linked to a region to which some individual probe sets within the cluster also linked. The second principal component only produced one linkage with LOD > 2. One cluster based upon chromosomal location, containing histone genes, linked to two trans regions. This work demonstrates that composite measures for genes with correlated expression can be used to identify loci that affect multiple co-expressed genes.
Background
There is a genetic component to the differences between individuals in gene expression. The confluence of tech-niques that allow genome-wide measurements of gene expression and the technology to examine genomic varia-tions, single-nucleotide polymorphisms (SNPs), on a large scale allows one to map the genetic determinants of
differences in gene expression. Problem 1 in Genetic Anal-ysis Workshop 15 (GAW15) provides expression data for approximately 8800 genes, along with SNP genotypes at 2883 sites-sufficient for linkage mapping but too low a density for genome-wide association studies.
from Genetic Analysis Workshop 15
St. Pete Beach, Florida, USA. 11–15 November 2006
Published: 18 December 2007
BMC Proceedings 2007, 1(Suppl 1):S155
<supplement> <title> <p>Genetic Analysis Workshop 15: Gene Expression Analysis and Approaches to Detecting Multiple Functional Loci</p> </title> <editor>Heather J Cordell, Mariza de Andrade, Marie-Claude Babron, Christopher W Bartlett, Joseph Beyene, Heike Bickeböller, Robert Culverhouse, Adrienne Cupples, E Warwick Daw, Josée Dupuis, Catherine T Falk, Saurabh Ghosh, Katrina A Goddard, Ellen L Goode, Elizabeth R Hauser, Lisa J Martin, Maria Martinez, Kari E North, Nancy L Saccone, Silke Schmidt, William Tapper, Duncan Thomas, David Tritchler, Veronica J Vieland, Ellen M Wijsman, Marsha A Wilcox, John S Witte, Qiong Yang, Andreas Ziegler, Laura Almasy and Jean W MacCluer</editor> <note>Proceedings</note> <url>http://www.biomedcentral.com/content/pdf/1753-6561-1-S1-info.pdf</url> </supplement>
This article is available from: http://www.biomedcentral.com/1753-6561/1/S1/S155 © 2007 McClintick et al; licensee BioMed Central Ltd.
We have examined several parameters and strategies that could be used to localize regulatory elements from such data. The initial step was to check the quality of the array data and remove outlier arrays and arrays in which the gene expression did not match the gender indicated in the pedigree. We also removed genes that were not reliably detected and thereby reduced the amount of multiple test-ing. We are particularly interested in detecting trans-acting loci that regulate correlated groups of genes, because such loci should be master regulatory elements integrating expression of many genes, and have tested several strate-gies for detecting them.
Methods
Data
MAS5 signals, detection calls, and quality control (QC) information were generated from the 267 Affymetrix HG focus array CEL files (Affymetrix feature intensity files) in the GAW15 Problem 1 using R/Bioconductor [1]. The arrays were scaled to a user-specified value of 1000. Detec-tion calls are based on a nonparametric test of the relative intensity of hybridization to the perfect match probes vs. the mismatch probes, and were calculated using the Affymetrix default parameters.
Quality control
Arrays having either a scaling factor or percent present with values outside of the median ± 3 times the inter-quartile range were eliminated (1341_12_rep1, 1362_01_rep1, 1362_01_rep2, 1416_02_rep1, 1418_02_rep1, 1423_13_rep2, 1424_01_rep2). We iden-tified genes with sexually dimorphic expression by com-paring (using Welch's t-test) the 54 arrays from men with the 51 arrays from women in the grandparents generation. Among duplicate arrays we selected the one with QC val-ues nearest to the median.
Selection of probe sets and generation of clusters
Coefficient of variation (CV: standard deviation/mean) for each probe set was calculated. One hundred probe sets were randomly selected from each of three groups: CV between 0.65 and 0.80, CV between 0.40 and 0.45, and random.
Hierarchical clustering (using correlation coefficient as the distance measure, and complete linkage) was carried out in Matlab (version 7.2, Mathworks) to generate groups of probe sets that have similar expression patterns. Thirty-three clusters were generated with a minimum cor-relation coefficient ≥ 0.60 and containing at least six probe sets. Composite measures of expression for each cluster were generated from 1) the mean of the signals, 2) mean of normalized signals ([signal-mean]/SD), and 3) projections of each array on the first two principal compo-nents of the normalized gene expression signals. The latter
measurement indicates the expression levels of the first two eigengenes on each array; singular value decomposi-tion (SVD) was conducted to calculate the eigengene and eigenarray matrices using the normalized signal [2].
We also clustered co-expressed genes that were located nearby on a chromosome. The probe sets were mapped onto chromosomes; all the probe sets within 2 Mb down-stream of a target probe set were considered neighbors. A co-expressed neighbor was defined as a neighboring probe set that had a similar expression pattern as the tar-get probe set (correlation coefficient > 0.4). For each probe set, the probability that observing ≥n co-expressed neighbors, by chance, in a neighborhood with N neigh-boring probe sets was calculated based on the binomial distribution. The false-discovery rate (FDR) of the signifi-cant co-expressed neighboring clusters was calculated [3].
Linkage
Linkage analysis was performed using SOLAR [4]. The map file was created using the Rutgers map data gathered by Sung et al. [5] and the SNP data from 193 individuals. Genotypes were removed if they did not follow Mende-lian patterns of inheritance. Multipoint analysis was per-formed on the MAS5 signals using the tdist option which uses a robust estimation of mean and variance that can adjust for excess kurtosis. Given the resolution of the link-age map, we considered linklink-age to a region within 10 Mb of a gene to be cis, and more distant linkages trans.
Results
Quality control issues
We first examined quality control data and removed arrays that were outliers. Comparing male and female founders in the GAW Problem 1, we detected three probe sets with robust sex specific expression: female: 214218_s_at (XIST); male: 205000_at and 206700_s_at (both on Y chromosome). Five arrays with sex-specific expression inappropriate for the pedigree information were removed (1418_08_rep1, 1418_14_rep1, 1423_12_rep2, 1423_13_rep2, 1423_14_rep2). The QC evaluation and the removal of duplicates left 193 people in the pedigrees, 190 of whom had expression data. For the three remaining (1362_1, 1424_1 and 1418_14) only genotype information was used.
Selection by CV
For the 300 probe sets selected to test the effects of CV, there were 13 linkages with a LOD score ≥ 3.0 (Table 1) and 40 with LOD between 2 and 3. The group of probe sets with higher CV produced a larger number of signifi-cant (LOD > 3) and suggestive (LOD > 2) results (Figure 2, Table 1). Given the limited numbers of probe sets ana-lyzed, the differences between the groups were only sug-gestive (p = 0.1, for LOD > 3 and LOD > 2). Most of the linkage results (44/53) with LOD ≥ 2 were trans, but the larger LOD scores were more likely to be cis; five of seven with LOD ≥ 4 were cis (Table 1). One probe set (205469_s_at) had both a cis and trans linkage with LOD = 2.1 and 2.2, respectively.
Clusters of genes with correlated expression
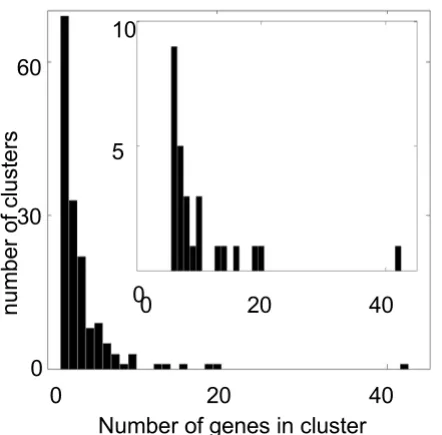
We defined 33 gene clusters by cutting off the hierarchical tree at a minimum correlation coefficient between two branches of 0.6. We focused on the 26 clusters that had an average correlation > 0.7 and contained at least six genes (Figure 3). Initial analyses showed that clusters with CV < 0.3 gave nearly no linkages with LOD score > 2 (1 of 89 probe sets in the first six such clusters) so we did not ana-lyze the remaining clusters with CV < 0.3.
In the 19 clusters used for linkage, there were 28 individ-ual probe sets that had LOD scores > 2.0. All 28 linkages were trans. Ten of the 19 clusters had at least one probe set or composite measure with LOD > 2. Eight of these ten
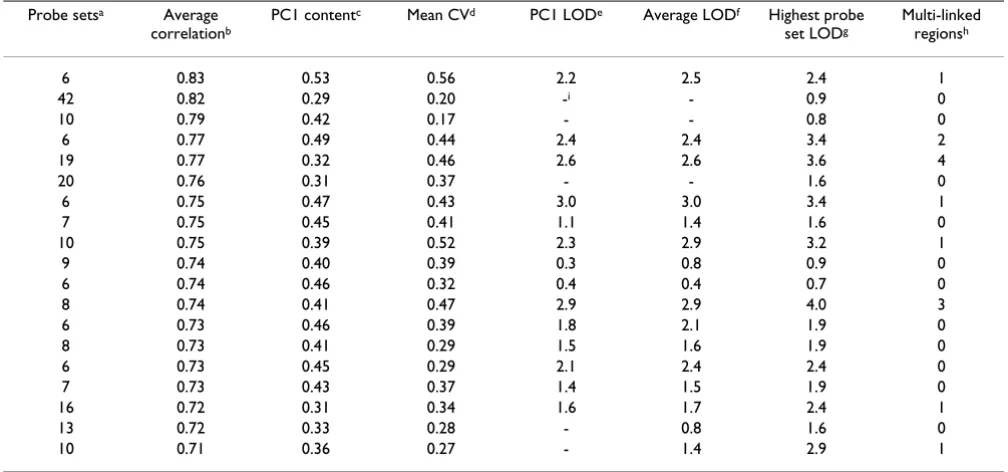
contained multiple probe sets or composite scores that linked to the same chromosomal region. Three clusters had multiple regions with more than one linkage to them. In all eight clusters, the composite measures linked to one of the multiply-linked regions. In most (seven of eight clusters), the individual probe set with the largest LOD score exceeded the LOD score achieved by the composite measures that linked to the same region. Among the com-posite measures, the first principal component and the two mean signals (raw and normalized) all linked to the same chromosomal region with very similar LOD scores. The first principal component had an average relative var-iance (proportion of varvar-iance captured) of 0.41 (range, 0.26 to 0.53, Table 2.) The first PC relative variance was larger in clusters with fewer probe sets. The second princi-pal component generally produced poor results: LOD < 1.3 for most, only one cluster with LOD > 2.
Two of the 19 clusters analyzed contained ribosomal pro-teins, with correlation near 0.8 and a CV ≤ 0.2. In these two clusters there were no LOD scores > 2, but many of the probe sets and the composite measures linked to chro-mosome 3 at 188 to 193 cM at lower LOD scores (Table 2).
Clusters of co-expressed neighboring genes
There were six chromosomal regions containing signifi-cant clusters of co-expressed genes (at FDR < 5%). We focused on the two regions that contained more than 10 Fraction of probe sets with large LOD scores for each group of selected probe sets
Figure 2
Fraction of probe sets with large LOD scores for each group of selected probe sets.
Distribution of fraction present for all probe sets on the arrays
Figure 1
co-expressed neighboring genes. No chromosomal region linked to the cluster on 11q13.1 neighboring probe set 204441_s_at. The cluster on 6p21.3, starting from probe set 209398_at, had an average correlation coefficient of 0.50. Interestingly, all the 11 co-expressed genes in this 6p21.3 cluster were histone genes. The first principal com-ponent contained 55.7% of the variance, and linked to chromosome 5 at 144 to 145 cM at rs880080 (LOD = 2.6). There were 226 annotated genes located within a 14-Mb (1 LOD) region. Gene ontology analysis indicates that 17
of the 226 genes related to transcriptional regulation and 6 related to the cell cycle. These factors include bromodo-main containing 8, taf7, RNA polymerase II TATA box binding protein (TBP)-associated factor, histone deacety-lase 3, glucocorticoid receptor, and transcription elonga-tion regulator 1. The second principal component contained 13.1% of the variance, and linked to chromo-some 21 at 29 cM (LOD = 1.5). Seven out of 119 genes that fell in the linkage region were transcription factors, and one was related to cell cycle.
Discussion
Pre-cleaning the data to remove outlier arrays or arrays with other problems (e.g., expression data inconsistent with nominal gender) is important, but not always done. Beyond that, we have found that removing all data from probe sets not reliably detected in at least a reasonable fraction of the arrays removes noise, reduces multiple comparisons, and improves the ability to detect real dif-ferences [6]. We used a fraction present of 0.20 as the cut-off based on the distribution of this measure in the present dataset (Figure 1).
A minimum amount of variation in expression appears to be required to detect linkage. Probe sets or groups with a CV < 0.30 did not yield many LOD scores > 2.0. We found a trend: probe sets with larger variation (larger CV) pro-duced more significant or suggestive LOD scores (Figure 2).
Trans linkages predominated, not just for the clusters but also for 300 individual probe sets used for the CV compar-ison: 45 of 53 (85%) of the linkages with LOD > 2 were trans. Seven were cis (13%; 5 were within 5 Mb) and one gave both a cis and trans linkage. Morley et al. [7] also
Table 1: Probe sets with LOD > 3.0
Probe seta LOD Chrb cMc Linkage Gene location ENTREZ gene UniGene ID Gene symbol Groupd
65588_at 9.27 20 62 cis chr20q11.23 388796 Hs.400876 LOC388796 CV40 219759_at 7.6 5 109 cis chr5q15 64167 Hs.482910 LRAP CV70 320_at 5.12 6 59 cis chr6p21.1 5190 Hs.567243 PEX6 CV40 212509_s_at 4.49 17 113 cis chr17q25.1 439921 Hs.250723 MXRA7 CV70 205018_s_at 4.49 21 20 trans chr13q32.1 10150 Hs.125715 MBNL2 CV70 204418_x_at 4.25 1 145 cis chr1p13.3 2946 Hs.279837 GSTM2 CV40 205027_s_at 4.03 9 98 trans chr10p11.23 1326 Hs.432453 MAP3K8 CV70 203868_s_at 3.79 21 30 trans chr1p32-p31 7412 Hs.109225 VCAM1 CV70 204073_s_at 3.77 11 56 trans chr11q12-q13.1 745 Hs.473109 C11orf9 CV70 208121_s_at 3.57 9 97 trans chr12p13-p12 5800 Hs.160871 PTPRO CV70 211317_s_at 3.44 8 74 trans chr2q33-q34 8837 Hs.390736 CFLAR random 204015_s_at 3.29 12 122 trans chr8p12-p11 1846 Hs.417962 DUSP4 random 204908_s_at 3.23 21 29 trans chr19q13.1-q13.2 602 Hs.31210 BCL3 random
aProbe sets among the 300 selected to test selection by CV. Annotations were from Netaffx, http://www.affymetrix.com. bChromosome of linkage peak
cCentimorgan distance of linkage peak
dGroup indicates which CV group this probe set was in (see Methods).
Characterization of the clusters Figure 3
Characterization of the clusters.
0
20
40
Number of genes in cluster
0
30
60
num
b
er of cl
ust
e
rs
0
5
10
found skewed results, with 77.5% of linkages being trans, 19% cis, and 3.5% with two or more linkages. Part of the explanation for the excess of trans linkages may be the multiple comparisons: for a cis-linkage, only a limited number of SNPs in the region of the gene are relevant, whereas for a trans-linkage all probe sets are tested against each expression value. Thus, many trans-linkages may rep-resent false positives due to a higher degree of multiple testing.
Despite the fact that most linkage results with LOD ≥ 2 were trans, the larger LOD scores were more likely to be cis (5 of 7 with LOD ≥ 4.0). A likely explanation of this skew-ing of results is that multiple trans QTLs may each have small effects on gene expression, while cis effects may be much stronger. Transcriptional regulation involves the binding of multiple trans-acting transcription factors to the regulatory region (cis-acting elements) of a given gene. Thus, the cis-acting elements of a gene, located in reason-able proximity to it, integrate the effects of multiple trans -acting transcription factors.
Three of the four composite measures used for the clusters (first principal component, mean of raw signal, and mean of normalized signal for all probe sets in the cluster) gave
similar results. They all linked to the same region when the LOD score was >2.0, and usually when it was >1.0. In most cases the linkage resulted in similar LOD scores. The first principal component was less likely than the average expression levels to have a normal distribution and was more difficult to transform to a normal distribution, sug-gesting that the mean signal (or normalized signal) is a better measure to use for these analyses and eliminating the need for SVD analysis. The composite scores did not produce stronger linkages to trans-acting loci than individ-ual probe sets. However, they may be useful to identify those loci that affect multiple correlated genes.
We compared a cluster of histone genes generated based on genes with correlated expression (six probe sets, first row in Table 2) with a cluster based on location along the chromosome (correlated neighboring genes, 11 probe sets). Three probe sets were common to both clusters. The composite scores from both clusters performed very simi-larly, with LOD scores ranging from 2.2 to 2.6 and all link-ing to the same region. The average normalized signal of the cluster of neighboring genes produced the largest LOD score, which was larger than any individual probe set that linked to the same region from either group. The linkage
Table 2: Characteristics of clusters used for linkage analysis Probe setsa Average
correlationb
PC1 contentc Mean CVd PC1 LODe Average LODf Highest probe
set LODg
Multi-linked regionsh
6 0.83 0.53 0.56 2.2 2.5 2.4 1
42 0.82 0.29 0.20 -i - 0.9 0
10 0.79 0.42 0.17 - - 0.8 0
6 0.77 0.49 0.44 2.4 2.4 3.4 2
19 0.77 0.32 0.46 2.6 2.6 3.6 4
20 0.76 0.31 0.37 - - 1.6 0
6 0.75 0.47 0.43 3.0 3.0 3.4 1
7 0.75 0.45 0.41 1.1 1.4 1.6 0
10 0.75 0.39 0.52 2.3 2.9 3.2 1
9 0.74 0.40 0.39 0.3 0.8 0.9 0
6 0.74 0.46 0.32 0.4 0.4 0.7 0
8 0.74 0.41 0.47 2.9 2.9 4.0 3
6 0.73 0.46 0.39 1.8 2.1 1.9 0
8 0.73 0.41 0.29 1.5 1.6 1.9 0
6 0.73 0.45 0.29 2.1 2.4 2.4 0
7 0.73 0.43 0.37 1.4 1.5 1.9 0
16 0.72 0.31 0.34 1.6 1.7 2.4 1
13 0.72 0.33 0.28 - 0.8 1.6 0
10 0.71 0.36 0.27 - 1.4 2.9 1
aNumber of probe sets within the cluster
bThe average correlation between probe sets in the cluster cThe amount of variation captured by the first principal component dMean CV for all probe sets in the cluster
eLOD scores for first PC
fHighest LOD score for composite generated from average signal or average normalized signal gHighest LOD score for an individual probe set
Publish with BioMed Central and every scientist can read your work free of charge "BioMed Central will be the most significant development for disseminating the results of biomedical researc h in our lifetime."
Sir Paul Nurse, Cancer Research UK
Your research papers will be:
available free of charge to the entire biomedical community
peer reviewed and published immediately upon acceptance
cited in PubMed and archived on PubMed Central
yours — you keep the copyright
Submit your manuscript here:
http://www.biomedcentral.com/info/publishing_adv.asp
BioMedcentral was to regions containing many transcription factors and
cell cycle-related genes, which makes biological sense.
Competing interests
The author(s) declare that they have no competing inter-ests.
Acknowledgements
This work from the Center for Medical Genomics at Indiana University School of Medicine was supported by the Indiana Genomics Initiative at Indiana University, which is supported in part by a grant from the Lilly Endowment, Inc.
This article has been published as part of BMC Proceedings Volume 1 Sup-plement 1, 2007: Genetic Analysis Workshop 15: Gene Expression Analysis and Approaches to Detecting Multiple Functional Loci. The full contents of the supplement are available online at http://www.biomedcentral.com/ 1753-6561/1?issue=S1.
References
1. Gentleman RC, Carey VJ, Bates DM, Bolstad B, Dettling M, Dudoit S, Ellis B, Gautier L, Ge Y, Gentry J, Hornik K, Hothorn T, Huber W, Iacus S, Irizarry R, Leisch F, Li C, Maechler M, Rossini AJ, Sawitzki G, Smith C, Smyth G, Tierney L, Yang JY, Zhang J: Bioconductor: open software development for computational biology and bioin-formatics. Genome Biol 2004, 5:R80.
2. Alter O, Brown PO, Botstein D: Singular value decomposition for genome-wide expression data processing and modeling.
Proc Natl Acad Sci USA 2000, 97:10101-10106.
3. Benjamini Y, Hochberg Y: a practical and powerful approach to multiple testing. J Roy Stat Soc Ser B 1995, 57:289-300.
4. Almasy L, Blangero J: Multipoint quantitative-trait linkage anal-ysis in general pedigrees. Am J Hum Genet 1998, 62:1198-1211. 5. Sung YJ, Di Y, Fu AQ, Rothstein JH, Sieh W, Tong L, Thomson EA,
Wijsman EM: Comparison of multipoint linkage analyses for quantitative traits in the CEPH data: parametric LOD scores, variance components LOD scores, and Bayes factors.
BMC Proc 2007, 1(Suppl 1):S93.
6. McClintick JN, Edenberg HJ: Effects of filtering by present call on analysis of microarray experiments. BMC Bioinformatics 2006, 7:49.