A Monthly Double-Blind Peer Reviewed Refereed Open Access International e-Journal - Included in the International Serial Directories
International Journal in Physical & Applied Sciences
http://www.ijmr.net.in email id- [email protected] Page 1
Morphometric Analysis of Wadi Qena using SRTM DEM and GIS analysis
Maria Philip
MSc student candidate Geology Department, South Valley University
Abstract
In this article, Shuttle Radar Topography Mission (SRTM) Digital Elevation Models (DEMs) data was processed and analyzed using GIS techniques to extract the morphometric parameters of Wadi Qena. This basin subdivided here into 24 sub-basin. The quantitative analysis of the drainage basin revealed values of bifurcation ratio, drainage density, circularity ratio, elongation ratio, form factor, stream frequency and drainage intensity of the studied basins. Analysis and interpretation of the morphometric parameters indicated that few sub-basins vulnerable to flood hazards resulting high runoff in areas of high relief and slope. However, the rest of sub-basins of moderate to low runoff capacity. The quantitative analysis of the studied basin and sub-basins presented meaningful information about the basin characteristics.
Keywords: GIS, Wadi Qena, Morphometric analysis
1. Introduction
Remotely-sensed digital elevation model (DEM) obtained from SRTM is widely used for analyzing the
drainage networks to extract the geomorphic, morphotectonic, morphometric parameters (El Basstawesy et al., 2010; Abdelkareem and El-Baz 2015 a, b; Withanage et al., 2014; Abdalla et al., 2014) and extraction of the tectonic features reflected on topography (Abdelkareem and El-Baz 2015 c, d). Drainage networks extraction also used in lineament extraction and analyses of the drainage basin (Jordan et al., 2005; Simpson 1992), predict the past hydrologic conditions (Strahler 1964; and reconstruction of paleodrainage systems (Abdelkareem et al., 2012 a; Abdelkareem and El-Baz 2016).
Morphometry is defined as the measurement and mathematical processing of the configuration of the
A Monthly Double-Blind Peer Reviewed Refereed Open Access International e-Journal - Included in the International Serial Directories
International Journal in Physical & Applied Sciences
http://www.ijmr.net.in email id- [email protected] Page 1
2. Study area
Wadi Qena is located in the Eastern Desert of Egypt that lies between latitudes260 10\ to 280 5\ N and longitudes 320 31\ to 320 45\ E ; it`s area is covering about 15746. 5 km2. It represents the major valley of the Nile basin that straddles the eastern Sahara (Abdelkareem and El-Baz 2015 d, Abdelkareem et al., 2012 b. It easily accessible by the asphaltic roads from Qena city along Qena- Safaga road. It also accessible along the Red Sea-Sohag-Asyut road that crossing the Ma'aza Plateau and the Red Sea highlands. However, it is difficult to accessible from north Wadi Qena because of the absence of asphaltic roads and long distance of more than 100 km. It is the region of the most promising areas for future development expansion to the proximity of the River Nile.
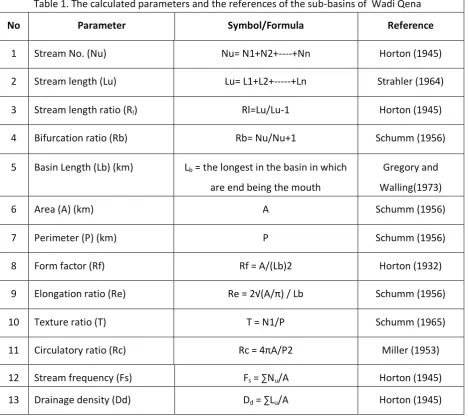
Table 1. The calculated parameters and the references of the sub-basins of Wadi Qena
No Parameter Symbol/Formula Reference
1 Stream No. (Nu) Nu= N1+N2+----+Nn Horton (1945)
2 Stream length (Lu) Lu= L1+L2+---+Ln Strahler (1964)
3 Stream length ratio (Rl) Rl=Lu/Lu-1 Horton (1945)
4 Bifurcation ratio (Rb) Rb= Nu/Nu+1 Schumm (1956)
5 Basin Length (Lb) (km) Lb = the longest in the basin in which
are end being the mouth
Gregory and Walling(1973)
6 Area (A) (km) A Schumm (1956)
7 Perimeter (P) (km) P Schumm (1956)
8 Form factor (Rf) Rf = A/(Lb)2 Horton (1932)
9 Elongation ratio (Re) Re = 2√(A/π) / Lb Schumm (1956)
10 Texture ratio (T) T = N1/P Schumm (1965)
11 Circulatory ratio (Rc) Rc = 4πA/P2 Miller (1953)
12 Stream frequency (Fs) Fs = ∑Nu/A Horton (1945)
13 Drainage density (Dd) (Km/Km2)
A Monthly Double-Blind Peer Reviewed Refereed Open Access International e-Journal - Included in the International Serial Directories
International Journal in Physical & Applied Sciences
http://www.ijmr.net.in email id- [email protected] Page 2
Figure 1.
Location map of wadi Qena basin
4. Results of drainage analysis and morphometric parameters
The stream network analysis of entire Wadi Qena basin revealed a 7th order stream, supposing a mature drainage pattern (Abdelkareem and El-Baz 2015 d). Our results reveal that WQ subdivided into 24 sub-basins. The calculated parameters and the references are listed in table 2. The drainage networks analyses of Wadi Qena show dendritic, parallel, and radial drainages on sedimentary rocks, however, the basement shows irregular drainages (Abdelkareem, 2012). The dendritic drainage pattern associated with the limestone plateau that are underlain by homogenous rocks. The major streams at the sedimentary sequence along the main Wadi course are of parallel pattern and the small tributaries join the main stream as trellis that reflects steep slope.
A Monthly Double-Blind Peer Reviewed Refereed Open Access International e-Journal - Included in the International Serial Directories
International Journal in Physical & Applied Sciences
http://www.ijmr.net.in email id- [email protected] Page 3
4.1 Bifurcation ratio (Rb)
The Bifurcation ratio (Rb) can be computed by dividing the number of streams in a given
order by the number in the next higher order (Schumm 1956). The values of Rb in table 2 are higher in many sub-basins such as S4, S7, S13, S15 that range from 4.482 to 4.973, but the lower in S11 that has 0.641.
4.2 Stream length ratio (Rl)
The Stream length ratio (Rl) is defined as the length of the mainstream in the sub-basin. It`s
value ranges from 0.4381 to 0.9512; which the higher value in S7, S11 that reveal elongated basins. However, S3, and S15 are not elongated but almost sub-circular.
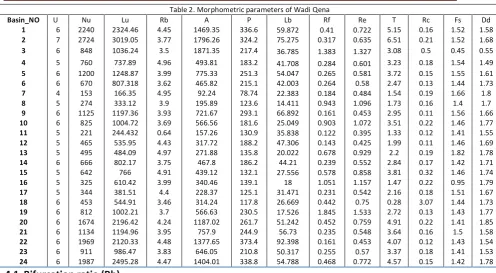
Table 2. Morphometric parameters of Wadi Qena
Basin_NO U Nu Lu Rb A P Lb Rf Re T Rc Fs Dd
1 6 2240 2324.46 4.45 1469.35 336.6 59.872 0.41 0.722 5.15 0.16 1.52 1.58
2 7 2724 3019.05 3.77 1796.26 324.2 75.275 0.317 0.635 6.51 0.21 1.52 1.68
3 6 848 1036.24 3.5 1871.35 217.4 36.785 1.383 1.327 3.08 0.5 0.45 0.55
4 5 760 737.89 4.96 493.81 183.2 41.708 0.284 0.601 3.23 0.18 1.54 1.49
5 6 1200 1248.87 3.99 775.33 251.3 54.047 0.265 0.581 3.72 0.15 1.55 1.61
6 6 670 807.318 3.62 465.82 215.1 42.003 0.264 0.58 2.47 0.13 1.44 1.73
7 4 153 166.35 4.95 92.24 78.74 22.383 0.184 0.484 1.54 0.19 1.66 1.8
8 5 274 333.12 3.9 195.89 123.6 14.411 0.943 1.096 1.73 0.16 1.4 1.7
9 6 1125 1197.36 3.93 721.67 293.1 66.892 0.161 0.453 2.95 0.11 1.56 1.66
10 6 825 1004.72 3.69 566.56 181.6 25.049 0.903 1.072 3.51 0.22 1.46 1.77
11 5 221 244.432 0.64 157.26 130.9 35.838 0.122 0.395 1.33 0.12 1.41 1.55
12 5 465 535.95 4.43 317.72 188.2 47.306 0.143 0.425 1.99 0.11 1.46 1.69
13 5 495 484.09 4.97 271.88 135.8 20.022 0.678 0.929 2.2 0.19 1.82 1.78
14 6 666 802.17 3.75 467.8 186.2 44.21 0.239 0.552 2.84 0.17 1.42 1.71
15 5 642 766 4.91 439.12 132.1 27.556 0.578 0.858 3.81 0.32 1.46 1.74
16 5 325 610.42 3.99 340.46 139.1 18 1.051 1.157 1.47 0.22 0.95 1.79
17 5 344 381.51 4.4 228.37 125.1 31.471 0.231 0.542 2.16 0.18 1.51 1.67
18 6 453 544.91 3.46 314.24 117.8 26.669 0.442 0.75 0.28 3.07 1.44 1.73
19 6 812 1002.21 3.7 566.63 230.5 17.526 1.845 1.533 2.72 0.13 1.43 1.77
20 6 1674 2196.42 4.24 1187.02 261.7 51.242 0.452 0.759 4.91 0.22 1.41 1.85
21 6 1134 1194.96 3.95 757.9 244.9 56.73 0.235 0.548 3.64 0.16 1.5 1.58
22 6 1969 2120.33 4.48 1377.65 373.4 92.398 0.161 0.453 4.07 0.12 1.43 1.54
23 6 911 986.47 3.83 646.05 210.8 50.317 0.255 0.57 3.37 0.18 1.41 1.53
A Monthly Double-Blind Peer Reviewed Refereed Open Access International e-Journal - Included in the International Serial Directories
International Journal in Physical & Applied Sciences
http://www.ijmr.net.in email id- [email protected] Page 4
Figure 3. (a) Bifurcation ratio (Rb), and (b) Stream length ratio (Rl) 4.3 Basin length (Lb)
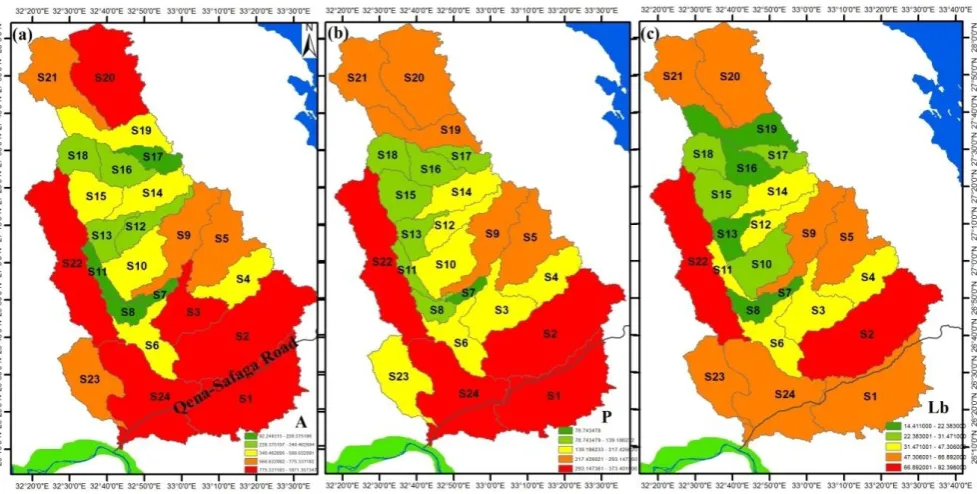
According to Gregorg and Waling (1973), the length of the basin (Lb) is the longest dimension of the basin parallel to the principal drainage line. The length of the studied Wadi Qena sub-basins ranges from 14.41 (S8) to 92.39 km (S 22). However, S2, and S22 area the most elongated basins in length based on computed Lb in table 2.
4.4 Basin area (A)
The total area projected upon a horizontal plane termed "Area" of the basin(Schumm1956).
The reform the area (A) of Wadi Qena sub basins ranges from 92.249 (S7) to 1871.351 (S3) km2. Large areas contains several streams rather than the small one, this collect much water to the outlet such as sub-basins S1, S2, S3, S20, S22, and S24.
4.5 Basin perimeter (P)
A Monthly Double-Blind Peer Reviewed Refereed Open Access International e-Journal - Included in the International Serial Directories
International Journal in Physical & Applied Sciences
http://www.ijmr.net.in email id- [email protected] Page 5
positive relation between of Area and Perimeter, as the sub-basins of high area are of high Perimeter e.g., S2, S22, S24, and S1.
Figure 4. (a) Basin area (A), (b) Basin parameter (p), and (c) Basin length (Lb)
4.6 Elongation ratio(Re)
The elongation ratio (Re) is the ratio between the diameter of the circle of the same area as the
drainage basin and the maximum length of the basin (Schumm, 1956). It is a very significant index in the analysis of the basin shape which helps to give an indication about the hydrological character of a drainage basin. The Re ranges from 0.39 (S11) to 1.53 (S19). The Re values (Table 2) are higher in sub-basins S19, S16 but the lower values are in S 11, S12, S19, and S22. Many sub-basins reveal circular shape such as S10, S8, and S3 but the more elongated sub-basins are S11, S22, S9, and S7.
4.7 Form Factor (Rf)
The form factor (Rf) may be defined as the ratio of the area of the basin to the square of basin length (Horton, 1932). The values of form factor would always be less than 0.7584 (perfectly for a circular basin). It is the quantitative expression of drainage basin outline form. The elongated basin with low Rf indicates that the basin has a flatter peak with a longer duration. The Rf range from 0.122 (S11) to 1.84 (S19). The Rf values (Table 2) are higher in sub-basin S19, S3, S16, S8, but the lower values are in S11,S2, S9, S22, S12, S6 that range from 0.1207 to 0.254 .
A Monthly Double-Blind Peer Reviewed Refereed Open Access International e-Journal - Included in the International Serial Directories
International Journal in Physical & Applied Sciences
http://www.ijmr.net.in email id- [email protected] Page 6
Miller (1953) defined the Circularity Ratio (RC) as the ratio of basin area to the area of a circle having the same circumference as the perimeter of the basin. The author described that the circularity ratios range from 0.4 to 0.5 which indicates strongly elongated and permeable homogenous geologic materials (Withanage et al., 2014). Rc ranges from 0.11 (S9, S12) to 3.07 (S18). Higher the value of Rc S18, S3, and S15 and lower values in S6,S9,S11,S12,S19,S 22.
4.9 Texture ratio (T)
The texture ratio (T) of Schumm (1965) is the ratio of first order population Nu1 to the
A Monthly Double-Blind Peer Reviewed Refereed Open Access International e-Journal - Included in the International Serial Directories
International Journal in Physical & Applied Sciences
http://www.ijmr.net.in email id- [email protected] Page 7
Figure 5. (a) Elongation ratio (Re), (b) Form Factor (Rf), (c) Circularity ratios (Rc), and Texture ratio )
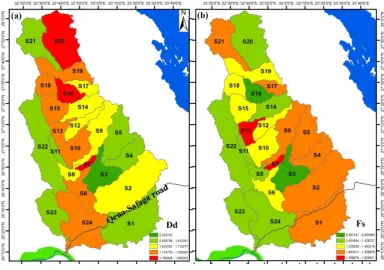
4.10 Stream frequency (Fs)
Horton (1932) described the stream frequency (Fs) as the total number of stream segments of
A Monthly Double-Blind Peer Reviewed Refereed Open Access International e-Journal - Included in the International Serial Directories
International Journal in Physical & Applied Sciences
http://www.ijmr.net.in email id- [email protected] Page 8
4.11 Drainage density (Dd)
Horton (1932) defined the drainage density (Dd) as an important indicator of the linear scale of landform elements in stream eroded topography (Horton, 1932). The Dd is defined as the ratio of total length of streams of all orders within the basin to the basin area, which is expressed in terms of km/km2. Dd values may be 1 km per km2 through very permeable rocks; it`s valued range from 0.5537 (S3) to 1.8503km/km2 (S20). Areas of high drainage density relatively high runoff, promoting flood risk. Low Dd reflects erosion-resistant fractures hard rocks and most rainfall infiltrates to recharge the shallow aquifers.
Figure 6. (a) Stream frequency (Fs), and (b) Drainage density (Dd) 6. Summary and conclusion
Wadi Qena is one of the most important valleys in the Eastern Desert of Egypt. It links the
Red Sea, Asyut, Qena, Sohag, and Luxor governorates. It is the region of the most promising areas for development area. It lies between latitudes260 10\ to 28 50 \ N and longitudes 320 31\ to 320 45\ E ; it`s covered the area about 15746. 5 km2 .
We computed morphometric analysis for the entire Wadi Qena basin to delineate
A Monthly Double-Blind Peer Reviewed Refereed Open Access International e-Journal - Included in the International Serial Directories
International Journal in Physical & Applied Sciences
http://www.ijmr.net.in email id- [email protected] Page 9
7. References
Abdalla F., El Shamy I., Bamousa A O., Mansour A., Mohamed A., Tahoon M., 2014. Flash floods and groundwater recharge potentials in arid land alluvial basins, southern Red Sea coast, Egypt. International Journal of Geosciences 5: 971-982.
Abdelkareem M, El-Baz F. 2015 a. Regional view of a Trans-African Drainage System. Journal of Advanced Research. Journal of Advanced Research 6: 433–439.
Abdelkareem M, El-Baz F. El-Baz. 2015 b. Analyses of optical images and radar data reveal structural features and predict groundwater accumulations in the central Eastern Desert of Egypt. Arabian Journal of Geosciences (2015) 8:2653–2666.
Abdelkareem M, El-Baz F. Forthcoming 2015 c. Mode of formation of the Nile Gorge in northern Egypt by DEM-SRTM data and GIS analysis. Geol J.
Abdelkareem M, El-Baz F. 2015 d. Evidence of drainage reversal in the NE Sahara revealed by space-borne remote sensing data data. Journal of African Earth Sciences 110, 245-257.
Abdelkareem M, El-Baz F. Forthcoming 2016. Remote sensing of Paleodrainage systems west of the Nile River, Egypt. Journal of Geocarto International.
Abdelkareem M, Ghoneim E, El-Baz F, Askalany M. 2012 a. New insight on paleoriver development in the Nile basin of the eastern Sahara. J Afr Earth Sci. 62:35–40.
Abdelkareem M, El-Baz F, Askalany M, Akawy A, Ghoneim E. 2012 b. Groundwater Prospect Map of Egypt’s Qena Valley using Data Fusion. International journal of images and data fusion 3 (2): 169-189.
Abdelkareem M., 2012: (Ph.D) Space data and GIS applications for arid region: Wadi Qena, Egypt. South Valley University, Egypt; 251 p.
El Basstawesy, M., Faid, A., El Gammal, E., 2010. The Quaternary development of tributary channels to the Nile River at Kom Ombo area, Eastern Desert of Egypt, and their implication for groundwater resources. Hydrological Processes 24, 1856-1865.
Gregory, J.K. and Walling, D.E. (1973) "Drainage basins form and process: A geomorphological approach" Edward Arnold, London, 456pp.
Horton, R.E., (1932). Drainage-basin characteristics. Trans. Am. Geophys. Union, 13, 350-361.
Horton, R. E., (1945). Erosional development of streams and their drainage basins: hydrophysical approach to quantitative morphology. Geological Society of America Bulletin 56, 275-370. Jordan G., Meijninger B.M.L.., Van Hinsbergen D. J. J.., Meulenkamp J. E., Van Dijk P. M., (2005).
Extraction of morphotectonic features from DEMs: Development and applications for study areas in Hungary and NW Greece. International Journal of Applied Earth Observation and Geoinformation 7, 163–182.
A Monthly Double-Blind Peer Reviewed Refereed Open Access International e-Journal - Included in the International Serial Directories
International Journal in Physical & Applied Sciences
http://www.ijmr.net.in email id- [email protected] Page 10
Mountain area, Varginia and Tennessee, Project NR 389042, Tech. Rept. 3., Columbia University, Department of Geology, ONR, Geography Branch, New York.
Schumm, S.A., (1956). The Evolution of drainage systems and slopes in badlands at Perth Amboi, New Jersey. Geological Society of America Bulletins, 67(5).
Simpson, D.W., Anders, M.H., (1992). Tectonics and topography of the Western United States an application of digital mapping. GSA Today 2, 118-121.
Strahler, A.N., (1964). Quantitative Geomorphology of drainage basins and channel networks, Handbook of Applied Hydrology, Ed. Ven Te Chow, 04, 9-76.
Waugh D., 1995. Geography, An Integrated Approach, Nelson, New York, NY, USA,