THE APPLICATION OF A NOVEL
SAMPLING DEVICE TO THE ON-LINE
ANALYSIS OF FERMENTATION BROTH
A thesis submitted to the University of London for the degree of DOCTOR OF PHILOSOPHY
by
Claire TURNER B.Sc. (Hons.)
Department of Chemical and Biochemical Engineering University College London
Torrington Place
London WC1E 7JE September 1993
ACKNOWLEDGEMENTS
I would like to thank Mrs Nina Thornhill, Professor Mike Turner and Dr Neville Fish for their help and support during this project. I would also like to express my thanks and appreciation to Dr Malcolm Gregory, who developed the Lab View process control system used in this project, and who collaborated with me on some of the fermentations described in the thesis.
Special thanks are most certainly due to Martyn Vale for his unending patience and for providing me with expert assistance throughout the project. I would also like to thank Mark Spurgeon, John Bailey, Billy Doyle, Alison Clayton and everyone in the Chemical Engineering Workshop for their help.
The financial support of the Science and Engineering Research Council through the Interdisciplinary Centre for Biochemical Engineering at UCL is also acknowledged.
ABSTRACT
This thesis describes the development of an automated, aseptic, sampling, centrifugation and analysis system for fermentation broth, and its link to a process control system for the control of sugars and organic acids in fermentation processes. Experiments were done to determine the separation efficiency of the microcentnfuge on suspensions of E. coil and S. cerevisiae cells. Reproducibility tests showed the system to be suited to on-line use, and on-line HPLC results compared well with off-line enzymatic assays of glucose and acetate for samples taken during an E. coil K12 fermentation.
The on-line monitoring system was linked to a control system developed by another researcher to enable on-line HPLC results to be used to control a fermentation process. The thesis presents two examples of the use of the combined system in controlling acetate build-up in a fed-batch fermentation.
Operating fed-batch fermentations provided suitable conditions for the testing of the on-line monitoring system in controlling the build-up of galactose and acetate in the fermenter. Experiments looked at the effects of various fermentation conditions on the expression of a-amylase produced in a recombinant E. coil,
JM1O7 + pQR126, and secreted into the penplasm. Fed-batch fermentations were performed at different growth rates and feed profiles. Further physiological studies were then performed using continuous culture techniques to look at the effect of acetate concentration on the maximum specific growth rate and a-amylase production; and the effect of dilution rate on the overflow of substrate to acetate and production of a-amylase. Results show that high and low growth rates inhibit a-amylase production, as do high acetate and galactose concentrations. High acetate concentrations also reduce the maximum specific growth rate.
These experiments highlight the need for monitoring and controlling galactose and acetate concentrations in fermentation processes.
AIM OF THESIS
The aim of this thesis is to describe the design and development of an on-line monitoring system for the automated, aseptic, sampling, centrifugation and analysis of fermentation broth. The thesis demonstrates the suitability of each of the components in the system for its purpose, and each component is tested to ensure that the whole system functions under the best operating conditions.
The system has been developed to automatically measure concentrations of sugars and organic acids in fermentation broth; on-line data can then optimise the process by improving the control over the fermentation. The system was integrated with a commercial process control system, LabView (programmed by Dr. M. Gregory at UCL). This enables the on-line HPLC data to be incorporated into an algorithm written to control the feeding of substrate (galactose) in a fed-batch fermentation. The thesis describes how this closed-loop control is achieved, and gives two examples of control strategies used in demonstrating the system.
LAYOUT OF THESIS
This thesis is divided into four sections, plus two appendices. The first section is concerned with the development of the on-line sampling, centrifugation and analysis of fermentation broth, and its link to a process control system. It begins with a literature review of research in the field of on-line sampling and analysis from fermentation processes. An overview of the monitoring system is then given, followed by sub-sections dedicated to each of the components of the on-line monitoring system in turn. The first use of the system in directly monitoring a fermentation is presented in section 1.7., and results from the on-line HPLC are compared to analyses of off-line samples using enzyme based assay kits. Section 1.8. describes the linkage of the monitoring system to the process control system, LabView, and demonstrates the use of the combined system in closed loop control of acetate/galactose concentrations in fed-batch culture.
Section 2. deals with the effects of high acetate and galactose concentrations on a fermentation process, as well as the effects of different specific growth rates on the production of recombinant protein. Firstly, there is a brief literature review of the subject, and then a materials and methods section. Next, comes a description of a "standard" batch fermentation to provide basic information about the organism and for later comparison. Subsequent sections deal with the effects of different conditions on both the growth of the cell and its production of recombinant protein. The experiments were performed in fed-batch culture, using the on-line monitoring and/or control systems; continuous culture was also used in this study. The section ends with a summary of the main results obtained from the experiments described in this section, and a discussion of their importance.
Section 3. is a discussion of the development and use of the on-line monitoring system, describing the various problems encountered during its use. Main conclusions are drawn about the project.
The main body of the thesis ends with a short section (section 4.) on the future.
Both future work to be done on the project in the form of modifications required to improve the speed and efficiency of on-line monitoring, and future potential of the system are discussed. There is a brief description of how the system could be modified to monitor intracellular proteins or enzymes on-line.
There are two appendices. Appendix A provides details of the relay ladder logic program written for the programmable logic controller to sequence events necessary for sampling and analysing fermentation broth. Included in this appendix is the HPLC method file used in the PE Nelson chromatography software, and the short QuickBasic program used to send on-line HPLC data to the Lab View computer.
TABLE OF CONTENTS
Page No. 1TILE PAGE
ACKNOWLEDGEMENTS DEDICATION
ABSTRACT 1
AIM OF THESIS 2
LAYOUT OF ThESIS 3
TABLE OF CONTENTS 5
LIST OF FIGURES AND TABLES 12
1. THE DEVELOPMENT OF AN ON-LINE
MOMTORING SYSTEM FOR THE AUTOMATED SAMPLING, CENTRIFUGATION AND ANALYSIS OF FERMENTATION BROTH, AND ITS USE IN CLOSED-LOOP CONTROL OF FERMENTATION.
1.0. Introduction 18
1.1. Literature Review 20
1.1.1. Fermentation 21
1.1.1.1. Physical variables
1.1.1.2. Chemical and biological variables
1.1.2. Sampling and sample preparation for analysis 29 1.1.2.1. Manual sampling
1.1.2.2. Automated sampling
1.1.2.3. Sample preparation by solid-liquid separation 1.1.2.4. Problems with sample separation techniques using
filtration
1.1.2.5. Maintenance of sterility
1.1.2.6. Analysis of intracellular components
1.1.3. Analytical methods 41
1.1.3.1. Glucose
1.1.3.2. Acetic acid 1.1.3.3. Ethanol
1.1.3.4. Ammonia and phosphate 1.1.3.5. Penicillin and cephalosporin C 1.1.3.6. Amino acids
1.1.3.7. Protein 1.1.3.8. Biomass
1.1.3.9. Fermenter exhaust gas
1.1.4. General comments on on-line analysis 54
1.1.5. Fermentation control 56
1.1.5.1. Reasons for control
1.1.5.2. Methods of controlling feed rate
1.2. An Overview 61
1.3. The Sampling Device 65
1.3.1. Valves 1.3.2. Steam trap
1.3.3. The docking device
1.3.4. Volume of sampling device and system 1.3.5. Operation of the sampling device 1.3.6. Problems with the sampling device 1.3.7. Sterility
1.4. The Microcentrifuge 73
1.4.1. Description
1.4.1.1. External features 1.4.1.2. Internal features 1.4.1.3. Electrical components
1.4.2. Method of operation of microcentrifuge 1.4.2.1. General operation
microcentrifuge
1.4.3.1. Materials and methods 1.4.3.2. Results
1.4.3.3. The use of the brake
1.4.3.4. Comparison of microcentrifuge with Denley microcentrifuge
1.4.3.5. Comparison of microcentrifuge with filtration 1.4.4. Summary and discussion of microcentrifuge
separation efficiency
1.5. Chromatography System 107
1.5.1. Equipment used
1.5.2. Chromatography method used 1.5.3. Conditions of operation
1.6. Component Integration and Sequence Control 121 1.6.1. Physical and control connections
1.6.2. The programmable logic controller 1.6.3. Operation of system
1.6.4. Reproducibility of system 1.6.4.1. Method
1.6.4.2. Results
1.7. Use of the System during a Fermentation 121 1.7.1. Materials and methods
1.7.2. Results
1.8. Linkage of On-line Monitoring System to a Control 127 System
1.8.1. The control system
1.8.2. Linkage of on-line monitoring system to control system 1.8.3. The use of On-line HPLC with closed loop control
in an E. coli fermentation
1.8.3.1. Organism used 1.8.3.2. Fermentation 1.8.3.3. Growth medium
1.8.3.4. Aim of the fermentations
1.8.4. Example of use of on-line HPLC with coarse closed-loop control
1.8.4.1. The fermentation and algorithm conditions 1.8.4.2. Results of fermentation
1.8.4.3. Stopping and restarting the algorithm
1.8.5. Example of use of on-line HPLC with fine closed-loop control
1.8.5.1. The algorithm
1.8.5.2. Fermentation conditions
1.8.5.3. Results 1.8.6. Discussion
2. A STUDY OF THE EFFECT OF SOME GROWTH CONDITIONS ON A RECOMBINANT FERMENTATION PROCESS USING ON-LINE HPLC.
2.0. Introduction 147
2.1. Literature Review 148
2.1.1. Growth of E. coli on glucose
2.1.2. The effect of glucose concentration on recombinant protein production
2.1.3. Acetate production in E. coli and its affect on the cell
2.1.3.1. Reasons for wanting to keep acetate excretion to a minimum
2.1.3.2. The assimilation of acetic acid
2.1.4. The effect of specific growth rate on recombinant protein production
2.1.6. The growth of E. coli on galactose 2.1.7. Secretion of proteins in E. coli
2.1.8. a-Amylase and its production in E. coli
2.2. Materials and Methods 160
2.2.1. Organism used 2.2.2. Growth media 2.2.3. Seed solution 2.2.4. Fermentation
2.2.4.1. Batch and fed-batch culture 2.2.4.2. Continuous culture
2.2.4.3. Control of pH in fermentations 2.2.5. Assays
2.2.5.1. Dry weight, optical density and specific growth rate
2.2.5.2. Amylase assay
2.2.5.3. Galactose and acetate 2.2.5.4. Plasmid stability 2.2.6. Control
2.2.7. Fermentation nomenclature
2.3. Batch Fermentation 168
2.4. The Effect of Specific Growth Rate on Amylase
Production 173
2.4.1. Introduction 2.4.2. Results
2.4.2.1. Fed-batch cultures 2.4.2.2. Continuous culture 2.4.3. Summary
2.5. The Effect of High Substrate Concentration on Specific
Growth Rate 186
2.5.1. Introduction
2.5.2. Determination of I.L 2.5.3. Results
2.5.4. The effects of high galactose concnetration on a-amylase production
2.5.5. Summary
2.6. The Effect of Specifc Growth Rate on Acetate Production 192 2.6.1. Introduction
2.6.2. Continuous culture results 2.6.3. Fed-batch culture results 2.6.4. Summary
2.7. The Effects of Acetate on Specific Growth Rate 199 2.7.1. Introduction
2.7.2. Continuos culture: method of measuring reduction in max
2.7.3. Results of continuous culture
2.7.4. Results from fed-batch fermentation FB2 2.7.5. Summary
2.8. The Effect of Acetate on Amylase Production 205 2.8.1. Introduction
2.8.2. Method 2.8.3. Results 2.8.4. Summary
2.9. Summary and Discussion 211
2.9.1. Summary of main results 2.9.2. Discussion
3. DISCUSSION
3.1. The On-line Monitoring System 214
3.1.1. General comments
3.1.2. The sampling device
3.1.3. The microcentrifuge
3.1.4. The HPLC system
3.1.5. The programmable logic controller
3.2. Problems Arising during the Use of the On-line
Monitoring System 218
3.3. Applications of the Use of the On-line Monitoring
System and Its Linkage to a Control System 219
3.4. Main Conclusions 221
4. THE FUTURE 223
4.1. Future Modifications Required to Improve the System
4.1.1. The sampling device
4.1.2. The microcentrifuge
4.1.3. The HPLC system
4.2. Future Potential 226
APPENDIX A: Programs For On-line Monitoring and Control
A.1. Programmable Logic Controller Program 228
A.2. HPLC Method File 234
A.3. Link to LabView 237
APPENDIX B: The Development of an HPLC Assay for
Prochymosin 239
B.1. Materials and methods 240
B.2. Results 246
B.3. Discussion 250
NOMENCLATURE 254
LIST OF SUPPLIERS 256
REFERENCES 259
LIST OF FIGURES AND TABLES
FIGURES
1.1.a. Sampling device of concentrically arranged catheters 1.1.b. In situ sampling device described by Garn et a!. (1989) 1.1.c. Commercially available sampling device, BIOPEM 1.1.d. Hollow fibre filtration module
1.1.3.5.a. The structure of cephalosporin C
1.2.a. 1.2.b.
1.3.a.
1.3.b. 1.3.3.a. 1.3.5.a.
1.4.1.a. 1.4.1.b. 1.4.1.c. 1.4. 1.d. 1.4.1.e.
Overview of main components of sampling and analysis system Photograph of on-line monitoring equipment
Layout of valves, steam trap and docking device in the aseptic sampling device
Photograph of sampling device Photograph of docking device
Operation routine for sampling device at different stages of use
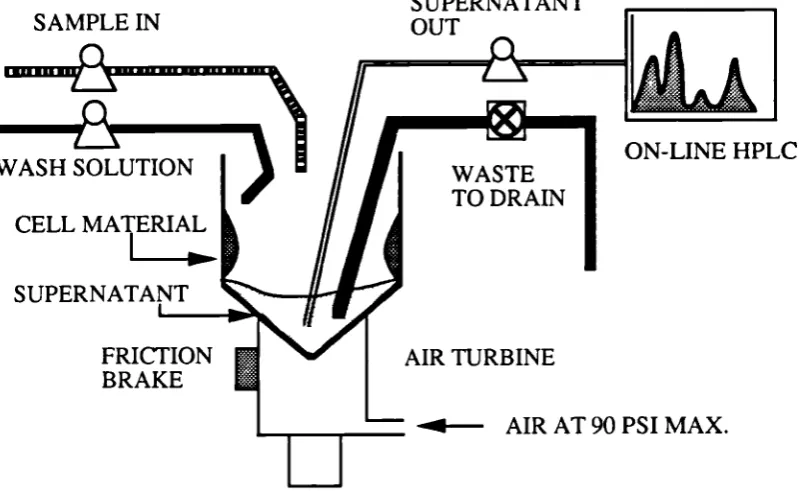
Photograph of microcentrifuge Photograph of centrifuge bowl
Photograph of interior of microcentrifuge bowl head Photograph of exterior of microcentrifuge bowl head Diagrammatic representation of microcentrifuge bowl
1.4.2.a. Relationship between air pressure applied to microcentrifuge air turbine, and speed of rotation of bowl
1.4.3.a.1. Separation efficiency of microcentrifuge at 45 psi with E. coli 1.4.3.a.2. Separation efficiency of microcentrifuge at 70 psi with E. coli 1.4.3.a.3. Separation efficiency of microcentrifuge at 90 psi with E. coli
1.4.3.a.4. Separation efficiency of microcentrifuge with E. coli; best spin times at 45, 70 and 90 psi
1.4.3.b.3. Separation efficiency of microcentrifuge at 90 psi with S. cerevisiae 1.4.3.b.4. Separation efficiency of microcentrifuge with S. cerevzsiae; best spin
times at 45, 70 and 90 psi
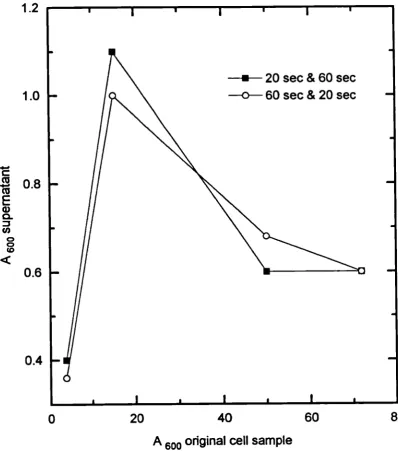
1.4.3.c.1. Separation efficiency of microcentrifuge after 20 second spin with E. coli 1.4.3.c.2. Separation efficiency of microcentrifuge after 60 second spin with E. coli 1.4.3.c.3. Separation efficiency of microcentrifuge after 90 second spin with E. coil 1.4.3.d.1. Separation efficiency of microcentrifuge after 20 second spin with S.
cerevisiae
1.4.3.d.2. Separation efficiency of microcentrifuge after 60 second spin with S. cerevisiae
1.4.3.d.3. Separation efficiency of microcentrifuge after 90 second spin with S. cerevisiae
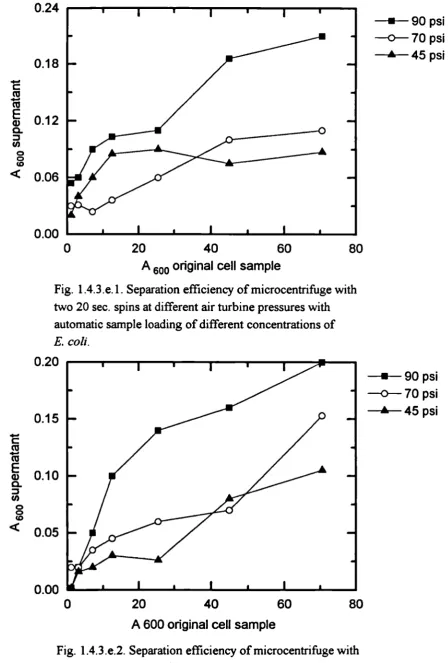
1.4.3.e.1. Separation efficiency of microcentrifuge after two 20 second spins with E. coil
1.4.3.e.2. Separation efficiency of microcentrifuge after two 60 second spins with E. coil
1.4.3.e.3. Separation efficiency of microcentrifuge after two spins at 45 psi with E. coil
1.4.3.f.1. Separation efficiency of microcentrifuge after two 20 second spins with S. cerevisiae
1.4.3.f.2. Separation efficiency of microcentrifuge after two 60 second spins with S. cerevlslae
1.4.3.f.3. Separation efficiency of microcentrifuge after two spins at 45 psi with S. cerevi.siae
1.4.3.g.1. Separation efficiency of microcentrifuge with brake on to stop bowl in 15 seconds, with E. coil
1.4.3.g.2. A of supernatant of E. coil sample after brake on to stop bowl in different times
1.4.3.h.1. Separation efficiency of microcentrifuge with brake on to stop bowl in 19 seconds, with S. cerevisiae
1.4.3.h.2. A of supernatant of S. cerevislae sample after brake on to stop bowl in different times
1.4.3.j. Separation efficiency of Denley microcentrifuge
1.4.3k. Comparison of centnfugation of S. cerevisiae sample with filtration 1.4.4.a. Relationship between optical density and dry weight of E. coli and S.
cerevisiae
1.5.2.a. Typical HPLC calibration curves for galactose and acetate using fermentation monitoring column
1.5.2.b. Typical chromatogram of standard solution of galactose and acetate 1.5.2.c. Typical chromatogram of supernatant of sample of fermentation broth
1.6.1.a. Layout of control signals for operation of on-line monitoring equipment 1.6.3.a. Operation scheme of on-line monitoring equipment
1.6.4.a. Comparison of reproducibility of analysis of a solution of galactose in water using commercial autosampler and on-line HPLC system
1.7.2.a. Comparison of on-line and off line analysis of glucose during an E. coli fermentation
1.7.2.b. Comparison of on-line and off line analysis of acetate during an E. coli fermentation
1.7.2.c. Correlation between on and off-line glucose and acetate data
1.8.2.a. Overview of main components of on-line monitoring and control system 1.8.4.a. Plot of galactose and acetate concentrations from on-line HPLC for
coarse closed loop control experiment
1.8.4.b. Plot of dry weight and optical density data for coarse closed loop control experiment
1.8.4.c. Plot of for DW, OD and LabView biomass estimate data for coarse closed loop control experiment
1.8.4.d. Profile of setpoint feed rate for coarse closed loop control experiment 1.8.5.a. Plot of galactose and acetate concentrations from on-line HPLC for fine
closed loop control experiment
1.8.5.b. Profile of setpoint feed rate for fine close loop control experiment 1.8.5.c. Plot of dry weight and optical density data for fine closed loop control
experiment
closed loop control experiment
2.1.3.a. TCA cycle and glyoxylate bypass
2.3.a 2.3.b. 2.3.c.
2.3.d. 2.3.e.
Amylase profile for batch fermentation
Galactose and acetate profiles for batch fermentation
Specific rates of galactose uptake and acetate production for batch fermentation
Dry weight and optical density profile for batch fermentation
Specific growth rates from DW and OD data for batch fermentation
2.4.2.1.a. Amylase profile for FR1a 2.4.2.1.b. Amylase profile for FB1b 2.4.2.1.c. Amylase proffle for FB3
2.4.2.1.d. Total amylase versus DW for controlled fermentations 2.4.2.1.e. Percentage amylase secreted from ,i controlled fermentations 2.4.2.1.f. Actual specific growth rates from OD data for controlled
fermentations
2.4.2.1.g. Actual specific growth rates from DW data for p. controlled fermentations
2.4.2.1.h. Galactose and acetate profiles for FB1a 2.4.2.1.1. Galactose and acetate profiles for FB1b
2.4.2.2.a. Plot of dilution rate versus specific amylase activity for Cl 2.4.2.2.b. Plot of dilution rate versus amylase activities for Cl
2.4.2.2.c. Plot of dilution rate versus percentage amylase leaked from periplasm
2.5.3.a. Specific growth rates from DW data for Bi, FB1b and FB2 2.5.3.b. Specific growth rates from OD data for B!, FB1b and FB2 2.5.3.c. Galactose concentration profiles for Bi, FB1b and FB2 2.5.4.a. Specific amylase activity profiles for Bi, FB1b and FB2
2.6.3.a Galactose and acetate profiles for FB5 2.6.3.b. Galactose and acetate proffles for FB6
2.6.3.c. Specific growth rates from OD data for FB5 and FB6 2.6.3.d. Specific growth rates from DW data for FBS and FB6 2.6.3.e. Plot of set manually in Lab View for FB5
2.6.3.f. Plot of set automatically in LabView for FB6 2.6.3.g. Galactose and acetate profiles for FM
2.6.3.h. Specific growth rates from OD and DW data for FM
2.7.3.a. Plot of in OD vs time after addition of 2 g.L 1 acetate 2.7.3.b. Plot of In OD vs time after addition of 5 g.L' acetate 2.7.3.c. Plot of in OD vs time after addition of 8 g.L' acetate 2.7.3.d. Plot of in OD vs time after addition of 8 g.L 1 sodium
2.7.3.a.4. Plot of acetate concentration and specific growth rate for FB2
2.8.3.a. Plot of amylase activity versus time after acetate addition
2.8.3.b. Plot of % original amylase activity found in sample after acetate addition
2.8.3.c. Plot of OD and specific amylase activity versus time after acetate addition
2.8.3.d. Acetate profile versus time after acetate addition
2.8.3.e. Plot of specific growth rate versus time after acetate addition 2.8.3.f. Plot of % amylase activity leaked from penpiasm versus time after
acetate addition
B.2.1.a. HPLC trace from a 30 L sample of prochymosin standard injected onto a PLRP-S column
B.2.1.b. HPLC trace from a 30 1.iL sample of prochymosin inclusion bodies loaded onto a PLRP-S column
TABLES
1.2.(i). Summary of chief functions of main components of on-line monitoring and control system
data for the on-line monitoring system, and autosampler
2.4.2.1.(i). Average specific growth rates from DW and OD data for fermentations where p. was controlled by Lab View
2.5.3.(i). Average p.s obtained from OD and DW data for fermentations run to determine the effect of high galactose concentrations on i
2.7.3.(i). Results of from washout experiments where medium was supplemented with different concentrations of sodium acetate
B.2.2.(i). A of fractions taken from eluted solutions loaded onto PIKSI gel columns
B.2.2.(ii). Relative amounts of protein as seen by TCA precipitation on fractions taken from samples loaded onto PIKSI gel columns
1. THE DEVELOPMENT OF AN ON-LINE MONITORING
SYSTEM FOR THE AUTOMATED SAMPLING,
CENTRIFUGATION AND ANALYSIS OF FERMENTATION
BROTH AND ITS USE IN CLOSED-LOOP CONTROL OF
FERMENTATION
1.0. INTRODUCTION
The aim of this project was to develop an on-line monitoring system for the automated measurement of sugars and organic acids, and to demonstrate its effectiveness in controlling a fermentation process. It has also been used to identify fermentation conditions that can affect the growth and recombinant protein production of the organism.
Section 1 describes the main bulk of the work in the project ie the development of the on-line monitoring system and its linkage to a control system (developed by another researcher). The section starts with a literature review (section 1.1.) which describes variables that need to be measured during a fermentation, and why such measurements are necessary. It then looks at different sampling methods, and how samples are prepared for analysis. A very few researchers have been able to measure intracellular protein product, and this review describes how that was achieved. It then examines different analytical methods available for the measurement of a wide range of variables from glucose to biomass concentration. The review ends with a very brief mention of control techniques used in fermentation. This part of the review is deliberately brief, because the programming of the high level Lab View controller was done by another researcher (although low-level programmable logic controller programs were written by the author).
about each of the components of the system; how they have been developed and put together, and any problems that arose from their use. Section 1.3. describes the sampling device; section 1.4. looks at the microcentrifuge;, and section 1.5. examines the chromatography system used. Section 1.6. provides details on how the whole system is put together and programmed to take samples from the fermenter and analyse sugar and organic acid concentrations. Appendix A provides full details of the programs used.
The first use of the on-line monitoring system in sampling and analysing fermentation broth automatically is shown in section 1.7., where results from on-line HPLC are compared to off-on-line analyses done using enzyme assay kits. The final part, section 1.8. describes how the on-line monitoring system was linked to a control computer (running LabView process control software), and how the combined system was able to demonstrate effective closed-loop (feedback) control.
1.1. LITERATURE REVIEW
This literature review provides a background into research that has been done in the field of sampling and analysis of fermentation broth. The scope of the material surveyed is broader than the subject of the thesis, which focuses on a particular method for monitoring specific substances (sugars and organic acids) in fermentation broth. Many of the developments in the review are reports from the published academic literature, although commercially available devices / systems have been mentioned when they are parthcularly useful or novel. The conclusions drawn at the end of the review take the line that biosensors are generally inferior to techniques such as HPLC, and this provides the background for much of the work reported in the thesis.
The review first looks at a number of variables that are (or need to be monitored) in a fermentation. These include physical, chemical and biological variables. The physical variables, plus pH, DOT arid DCO2 are not examined in any detail, and are only covered in this part of the literature review. This first section only deals with the importance of the other variables; analytical methods come later.
The next part deals with sampling methods, and the way fermentation broth is prepared for analysis ie how solid and liquid components are separated. The need for and means of achieving asepsis during sampling procedures is shown. This part then describes how a very few researchers have managed to monitor the concentrations of intracellular proteins/enzymes, and briefly discusses ways of disrupting cells that may be suitable for small sample volumes.
measurement of a number of variables.
The final part of the literature review is a very brief look at some control techniques employed in fermentation.
1.1.1. Fermentation
Fermentation is used in the production of various materials, such as enzymes, antibiotics and food products, as well as in processes involved in waste water treatment. Recently, however, substances which were traditionally manufactured by chemical processes are now fermentation products, or products of other biological processes because of the high specificity, and often the tower cost of production that may be associated with these processes.
Fermentation broth is typically a system of at least three phases consisting of cells, organic and inorganic media components dissolved in the liquid phase, and gases. In order for a fermentation to be successfully monitored and controlled, complex analytical methods often need to be employed to assess the state of the fermentation. Currently, very few of these methods are on-line, and this means that the time taken between manual sampling and the result of an analysis can take too long to prevent problems, for example in nutrient deficiency or product formation. Effective fermentation control needs the development of rapid and frequent on-line monitoring, and additionally, automatic sampling and analysis means that fewer personnel are required to maintain the fermenlation. Less broth is usually removed from the fermenter with automated sampiing, and the chance of causing fermenter contamination is reduced.
Fermentations are typically much more difficult to monitor and control than chemical processes largely because of the great complexity of the microorganism compared to single chemical reactions.
Monitoring of fermentation variables
There is a very wide range of variables that can be monitored during fermentation
or other biological processes. This introduction will concentrate on the most widely measured fermentation variables.
Such variables may be categorised into three groups, namely:
1) Physical variables ie. those related to the physical state of the fermentation.
2) Chemical variables, relating to the chemical environment of the cells, eg. pH. 3) Biochemical and biological variables eg. biomass concentration.
1.1.1.1. Physical variables
This subsection provides a very brief overview of methods used for measuring physical variables. Most techniques have been around for many years, but are included here because of the importance of monitoring and controlling the physical environment of the cell.
It is crucial to accurately monitor and control temperature in many fermentation processes because different microorganisms have different temperature optima for growth. In addition, product formation and expression of a plasmid may be under temperature control eg the temperature inducible tR promoter/c1857
repressor expression system (Rinas et al, 1989; Strandberg and Enfors, 1991). An example of this is in the growth of mouse-mouse hybridoma cells in culture. Growing cells at 3-9 °C below the optimum of 37°C causes an increase in viability but a decrease in the production of monoclonal antibodies (Reuveny et a!., 1986).
Temperature sensors used in fermentation include the platinum resistance thermometer and the thermistor, a semiconductor device operating on the principle that changing resistance is a function of temperature as well as thermocouples and thermometer bulbs of Hg in stainless steel. Obviously, they should be steam sterilisable in situ.
piezoelectric manometers.
Other important physical variables include flow rate (air and liquid), liquid level, power input and viscosity. Inlet airflow rate is particularly important in aerobic processes (and is required for the calculation of carbon dioxide evolution rate, for example), and the simplest measurement technique is the use of a variable air meter, or rotameter, on the air supply. Flow rates when determined by mass flow meters, orifice plates or vortex shedding meters, for example, are easily obtained as an electrical output.
Due to the problems of making measurements on a gas containing a significant level of water vapour, exit gas flow rates are normally determined indirectly. The most common method involves a mass balance, or an inert gas in the inlet and exit gas, eg. argon or nitrogen. Coppella and Wang, (1990) describe a method of spiking the off-gas flow with an accurately determined flow of argon to measure exit gas flow rate.
Liquid flow rates of nutrients or pH controlling solutions can be measured using load cells or a well calibrated pump, although such measurements can be difficult if two or more phases or solids are present in the liquid.
The measurement of liquid level may be determined by conductivity sensors, capacitance probes, ultrasound or two pressure transducers - the pressure difference being equivalent to the hydrostatic head. This is only possible if the fermenter headspace is large enough. The first two are also used in detecting foam build up in a fermentation process.
Power input determination is important for economic considerations, and also in looking at oxygen transfer between gas and liquid, possible mechanical damage to cells, and how it influences microbial morphology. Agitator power can be measured by a Hall effect transducer. Shaft power input is sometimes measured by a torsion dynamometer. Often, however, the external power drain by the motor is the only relevant measurement that is available.
On-line viscosity measurements are not yet done routinely, although in some fermentations, they would be useful, for example where there is mycelial growth.
A device known as a vibrating rod viscometer has been used, but requires specific calibration for each fermentation process.
1.1.1.2. Chemical and biological variables
This section concentrates on the monitoring of chemical variables, some of which (such as pH) are measured routinely, and are not discussed in any detail. More relevant to the work described in the thesis is the analysis of non-routinely measured variables, and these are looked at in much more detail; both in this section (where the reasons for measurement are examined) and in section 1.1.3. where current analytical methods are discussed.
pH is a critical fermentation variable as most cells have narrow pH optima, and some cells systems cannot survive more than a moderate change in pH. For example, it has been known for several years that the growth of normal, virus transformed and cancerous mammalian cells is markedly affected by relatively small variations in pH in the range 6.8 to 8.2 (Eagle. 1971). Many other researchers report that modest fluctuations in animal cell culture pH may have a great effect on growth rate, viability and final cell yield (Harbour et a!., 1988; Birch and Edwards, 1979 and Miller et aL, 1988). Expression of a recombinant j3-galactosidase in E. coli can be induced by a pH change when controlled by the
regulatory region of the cadA gene (Tolentino et a!., 1992).
pH probes used in a fermenter should be robust and steam sterilisable. Calibration should last for the duration of the fermentation, although this often is not the case (Clarke et a!., 1984). Probes are also easily fouled by protein in the broth. An alternative to the glass probe is that proposed by Clarke et aL
Dissolved oxygen
Measurement of dissolved oxygen can provide useful information on the growth rate and metabolic state of the fermentation. Conditions of low DOT can have a major effect on a fermentation process eg. yeast cells may produce excess ethanol if conditions become more anaerobic, and similarly, E. coli produce more acetic acid. Two types of probe are in frequent use; galvanic and polarographic. As with pH probes, fouling of the probe can easily occur, and short calibration longevity is a problem. Kok and Hogan (1987/88) developed a probe calibrator to allow for in situ cleaning and calibration of a probe during a fermentation.
Dissolved CO2
Steam sterilisable electrodes are now also available for the measurement of dissolved CO2. but they require careful maintenance (Lorenz et aL 1987). The probe functions by measuring the pH of a standard bicarbonate and NaC1 solution separated from the medium by a gas permeable membrane. Calibration of the pH electrode during a fermentation is difficult.
Nothing further will be written about the above variables. The variables following this are mentioned immediately below with respect to the reasons for their measurement. Section 1.1.3. then examines analytical techniques for determining them.
Glucose
Glucose is one of the most widely used carbon substrates in fermentation; substrate depletion can lead to a number of undesirable effects, yet an excess could have an inhibitory effect on cell growth rate (Strandberg and Enfors, 1991) and leads to the bacterial Crabtree effect where the formation of TCA cycle enzymes may be repressed and the formation of plasmid encoded product inhibited, either directly or by the accumulation of excreted acids (Rinas et a!., 1989; Gerson et a!., 1988; Kleman et a!, 1991; Bech Jensen and Carlsen, 1990). In baker's yeast cultivation, the Crabtree effect means excess ethanol accumulates, but if the sugar concentration is too low, however, the biomass productivity is
again limited (Mizutani et aL 1987). It is often essential, therefore, to rapidly and accurately be able to estimate, or measure, glucose concentration inside the reactor. Further details of these effects are discussed in section 2.1.
Another reason for measuring glucose concentration in a fermentation is described by Garn et aL (1989). They used glucose measurements for on-line estimation of fermenter biomass concentration, by using glucose concentration values directly in a simple carbon balance equation:
glucose -. biomass + CO 2 + acetate
They obtained reliable estimates of biomass in the batch phase of the fermentation of a recombinant strain of E.coli using this method. Valero et a!. (1990 a), used a similar method in fermentations of Candida rugosa.
In these examples, rapid results are of utmost importance. On-line analysis of glucose concentration would considerably aid in obtaining good fermentation results. The on-line measurement of glucose and other sugars, and reasons for doing so, form a major part of this thesis.
Acetic acid
Acetic acid is the main by-product excreted by E. coli (the organism used in the project) when the concentration of sugar substrate in the medium is too high, and the oxidative capacity of the cells is exceeded; or when the growth rate of the culture is too high. Its presence in the fermentation broth is detrimental to the cells at high concentrations, and needs to be carefully controlled. A more detailed discussion of this is given in section 2.1. Acetate measurement (like glucose and other sugars) also forms a large part of this thesis.
Nitrogen. ammonia and phosphate
certain recombinant proteins, whose genes are linked to the alkaline phosphatase promoter in E. coil (Forman et aL, 1991). Nitrogen or phosphate limited growth is often used as an important strategy in the formation of fermentation products. Ammonium ions also appear as a product of metabolic pathways eg. in the decay and metabolism of glutamine in cell culture media (Doblhoff-Dier et aL 1989). In E. coil fermentations, growth is inhibited if ammonia concentration exceeds 170 mM (Thompson et a!., 1985), so it needs to be fed in high cell density culture.
Ethanol
There are a number of reasons for the interest in the analysis of ethanol: it is one of the earliest and most important fermentation products. In the early 1980s, the world market for ethanol produced by biotechnology was Ca. X 108, (Scheller and Kirstein, 1987) and current figures are likely to be much higher; ethanol is also important medically, hence the interest in methods of measurement. Although it is often the product in yeast fermentations, ethanol may be a byproduct in fermentations to produce yeast biomass, and its concentration needs to be closely monitored.
Protein
The term protein is one given to a macromolecular substance composed of a polymer of covalently linked amino acids. This includes structural proteins, enzymes, antibodies etc. Proteins and peptides make up a large slice of the biotechnology market, and fermentation accounts for products such as monoclonal antibodies and many different enzymes. Microorganisms are now also able to produce proteins or peptides with enzymic or hormonal activity, and antigens which are of use in the production of vaccines (Gustafsson et aL 1986).
Antibiotics
Scheller and Kirstein, (1987), estimate the world market for antibiotics in the early 1980s at approximately $8 x iO annually; the current annual tonnage of penicillin produced by fermentation is approximately 25 000 tonnes. Antibiotics have been produced by fermentation for many years, and because of the importance of antibiotics to the biotechnology industry, there has been much
work on the determination of the concentrations of penicillin and other antibiotics during the fermentation.
Amino acids
Amino acids are also important biotechnological products; their world turnover in 1981/82 estimated at DM 1.63 x iO (Finn and Präve, 1988). Annual tonnages of some amino acids produced in 1987 are: glutamate, 350 000; lysine, 87 000; and phenylalanine, 3 000. Fermentation is sometimes a preferable way of producing amino acids for many reasons, including cost. An important advantage is that only 1 optical isomer of the amino acid is formed during fermentation (usually the L-form, except glycine which is achiral), as opposed to racemic mixtures produced in chemical reactions. Veiy often, optically pure compounds are required (although racemates are used in feed-stocks). Only the L-form is found in protein.
Many amino acids, such as glutamic acid, lysine, phenylalanine, aspartic acid, and tryptophan are used in the food industry, eg. phenylalanine and aspartic acid are major components of aspartame. Many others are required as substrates in fermentations for the manufacture of other products.
Exhaust gas
CO2 and 02 are routinely measured on-line from a fermenter and with the measurement of a reference air stream, allows the calculation of such parameters as carbon dioxide evolution rate (CER), oxygen uptake rate (OUR) and respiratory quotient (RQ), which provide a measure of the relative respiratory or fermentative activity of the organism in the fermenter. This may be important for monitoring and control eg. in Baker's yeast production, where, for example, RQ correlates well with ethanol production rate; and OUR and CER are calculated to indirectly assess cell growth (Wang et a!., 1979).
Biomass
Biomass is monitored routinely in fermentation processes. It is important to monitor biomass concentration as close to real time as possible - either it must be maximised if cells are required eg. for single cell protein production, or it must be tightly controlled so that there is enough biomass to produce the required product, but not so much that the available nutrients are wasted on producing more cells at the expense of product formation. Monitoring biomass is important in many processes eg. in the production of some protein products in recombinant
E. coli fermentations to limit the growth rate to provide maximum protein production. An accurate estimate of biomass is required for good control over cell growth in fed-batch fermentations.
1.1.2. Sampling and sample preparation for analysis
This subsection deals with ways of getting a sample out of the fermenter and preparing it for analysis. Topics examined here include sampling techniques, methods for the separation of solid and liquid components of whole broth samples, and the maintenance of sterility, subjects which are closely related to much of the work described in the thesis. There is also a short description of cell disruption techniques, and their relevance to the on-line analysis of intracellular components.
1.1.2.1. Manual sampling
Most commercially available sampling devices are manually operated. They are generally either bottom or side sampling valves, or hooded samplers (Seifert and Matteau, 1988). The latter may either be sterilised separately, or with the fermenter, and are operated according to the vacuum principle. The bottom or side sampling valves are usually found on larger vessels, and use steam sterilisable or piston valves.
There are, however, a number of drawbacks to manual sampling: 1) it is expensive, requiring operator time, especially overnight 2) culture contamination may occur 3) it is not always easy to regulate sample volume, especially ' th
bottom sampling valves 4) hooded samplers are ineffective when used with airlift fermenters, because of the high airflow rates (Seifert and Matteau, 1988) 5) off-line analysis with manual sampling takes longer, and delay could lead to the characteristics of the sample altering 6) good laboratory safety practice -microbiologicals material should not come into contact with personnel. The development and use of automated on-line sampling would solve most of these problems.
1.1.2.2. Automated sampling
Sampling can generally divided into two aspects - removal and transportation of the sample; and the separation of the solid and liquid components, although both operations are often present in the same device. Samples can either pumped to the analyser continuously or discontinuously depending on the process and what is being measured (Bradley et a!., 1991).
by Reda et a!. (1991), in which an automated, aseptic sampling method for whole broth samples from up to six fermenters is based on a piston-type sampling valve, a local sample loop, and the ability to send the sample with sterile air through the sample line into a remote, chilled tube for later analysis.
Marshall et aL (1990) developed a commercial sampling system consisting of a peristaltic pump and recycle loop which passes through a 12 vial sampling device. At programmable intervals, a sample can be diverted to a vial in the sampling device; the vials being cooled for later analysis off-line. The commercial sampler has the advantages that it is comparatively inexpensive, asepsis is maintained, there is no dead volume, samples are representative, and it can be fitted to any fermenter. A similar device was described by Strudsholm et a!. (1992) where a needle connected to the fermenter by a tube breaks the seal on a sterile sample vial in a refrigerated fraction collector; the vacuum in the vial causes a sample to be taken. Other automated sampling devices involve various combinations of pumps and valves. Appelqvist et aL (1989), used two pneumatically operated three way diaphragm valves, and peristaltic pumps, all under computer control to provide samples from a fermenter for FIA. Other examples in the literature include the recycle loop of 3 way valves and a pump (Ghoul et aL, 1986); and the systems of valves and pumps developed by Kroner and Papamichael (1988); Seifert and Matteau, (1988) and Beitle and Ataai (1991).
Not all analyses require the separation of solid and liquid components. Nielsen
et aL (1989a), described the removal of a sample from a fermenter and pumping cells into a small stirred chamber. There, cells were deactivated by cooling and the addition of 0.02M chioramine solution. The subsequent mixture was then pumped to the analytical system which measures OD (optical density) and the concentrations of glucose, lactic acid and protein. Another sampling device that does not remove solids before analysis is that described by Hâkanson eta!. (1991). This device consisted of two concentrically arranged catheters, the inner one slightly shorter than the outer. A sample was sucked through the inner lumen, and an inhibitor added to terminate metabolic processes before analysis and is shown in figure 1.1.a. This is not usually done however; solid and liquid
components are generally separated before analysis.
0 • • • •
_____________________ : ::
Fig. 1.1.a. Sampling device of concentrically arranged catheters (HAkanson et aL, 1991)
1.1.2.3. Sample preparation by solid-liquid separation
The previous subsection described the removal of a sample from the fermenter. This subsection describes techniques available for separating sold and liquid components of the samples, either inside or outside the sterile fermenter barrier.
Extracellular components of cell broth include substrates, inhibitors, certain products and various metabolites. It may be necessary to analyze one or all of these during a fermentation, and in order to do so, the biomass and other solids nearly always need to be removed first. Separation devices may be placed either inside the fermenter (which is often preferred for viscous broths of filamentous organisms) which filter the broth; or outside the fermenter. Internal devices are not replaceable during a fermentation, but do not require repeated sterilisation. External devices have the advantage that they can be replaced during the fermentation; but pumps, tubing and other materials that come into contact with broth outside the fermenter, generally require steriuisation (Lorenz et aL, 1987).
Microfiltration
fouling, liquid flow can be made tangential to the membrane (cross-flow microfiltration). Millipore has developed a steam sterilizable filtration device using a cross-flow filtration module to filter fermentation broth outside the fermenter, which is analysed by HPLC; and unfiltered material is returned to the fermenter (Kalynaput, 1989). Other examples of the use of cross-flow filtration are given by Bayer et aL, (1986), Schmidt et aL, (1985), Forman et aL; (1991) and Freitag eta!., (1991). Kroner and Papamichael (1988), describe a sampling device (BIOPEM) which is an autoclavable, sterilizable, magnetically stirred filtration cell for the continuous aseptic separation of samples of fermentation media by dynamic filtration. BIOPEM has been used by a number of researchers (Koliander et aL, 1990; Lundström et a!., 1990) and is shown in figure 1.1.c. In spite of the wide usage of BIOPEM, it has still been shown to start to block during fermentation, especially where filamentous fungi are sampled (Christensen et a!., 1991).
Spiral * Filtrate collection
0-ring . 3cn
Out
Filtrate
In
Fig. 1.1.b. In situ sampling device described by Garn et al. (1989); reproduced from Bradley et aL, 1991)
Knurled screw Spindle Threaded pin
Hexagon socket screw Stirrer assembly
Magneuc core
Outlet sample Support ring Bottom o-ring
Fig. 1.1.c. Commercially available sampling device, BIOPEM, developed by Kroner and Papamichael (1988); reproduced from Bradley et al. (1991).
The problem of fouling has been tackled in other ways. Suizer AG, Switzerland, has developed a filter unit that decreases the effects of fouling for use in separating samples from a fermenter for analysis by FIA. It consisted of two coaxial cylinders, the outer one fixed and the inner one rotating; a membrane being fixed to the outer wall of the inner one. Filtration by centrifugal forces results, with the membrane surface being continually rinsed, so there is no clogging or fouling (Ogbomo et aL, 1990). Kroner et a!. (1987), described a similar device with a rotating shear filter which improves mass transfer at the membrane surface and may be used at the sampling point of the fermenter. This device seems to be rather complicated for its use in separating solid and liquid components in samples.
(1992) compared two in situ liquid sampling systems consisting of an inorganic membrane filter that is either rotating or stationaiy, and found the rotating device to give a better filtration performance. The failure of these systems during fermentations, however, may require the termination of the fermentation.
Ultrafiltration
Ultrafiltration separates large macromolecules and suspended solids from solution by forcing the solution through the membrane using a pressure gradient that dominates over osmotic differences across the membrane. This is particularly useful for colloidal or proteinaceous liquid streams as well as larger particulate matter. The materials used in ultrafiltration are graded according to cut-off point of molecular weight, usually between iO and 106 daltons, that is unable to pass through the membrane (Kroner et aL, 1987).
Many examples of the use of ultrafiltration for the production of solids-free samples exist in the literature. Ogbomo et a!. (1990), gave a number of applications for using ultrafiltration of samples eg. when analysing ethanol produced by Saccharomyces cerevisiae or in the analysis of glucose. Other examples include the use of an agitated ultrafiltration cell fed sequentially to provide a solids-free sample stream for process liquid chromatography (Gressin, 1988); other ultrafiltration based sampling systems for on-line HPLC (Dinwoodie and Mehnert, 1985 and Favre et a!., 1990), and with prefiltration to reduce clogging (Wang, 1984). Wang in this paper also suggested that because ultrafiltration rate is inversely proportional to the concentration of (yeast) cells in the fermentation, measurement of flux may be used to indirectly monitor the concentration of microbial biomass in the fermenter.
Dialysis
Another "filtration" alternative is dialysis. Whereas microfiltration membranes are graded according to pore size, dialysis as well as ultrafiltration membranes are graded in terms of molecular weight cut off points; dialysis being used to separate even smaller particles. In addition, dialysis membranes are diffusion driven as opposed to the majority of filtration devices which are pressure driven. With
dialysis, a semi-permeable membrane is used which generally retains material larger than about 15 000 daltons. The driving force for dialysis is a difference in concentration of a component on either side of the membrane. Some membranes are made from cellulosic material, but applications are limited due to hydrolysis by many organisms.
A number of sampling devices make use of dialysis, either on its own, or in conjunction with another technique. Bayer et a!. (1986) has used microfiltration to remove cells from a sample stream and then dialysis to remove proteins, and the device is shown in figure 1.1.d. Similarly, Niehoff et al. (1986) used dialysis to dilute and remove proteins from a sample already prepared by ultrafiltration.
Dialysis sampling systems have been constructed for use either inside or outside the fermenter. Mandenius et a!. (1984) mounted a steam sterilisable dialysis probe inside a fermenter, protected from fouling by a strong tangential flow of the sample solution (caused by placing a magnetic stirrer bar close to the membrane surface). The probe provided continuous samples for HPLC. Zabnskie and Humphrey (1978a) modified a stainless steel baffle in a fermenter vessel to construct a dialyser that could generate solids-free samples of fermentation broth. A dialysis probe of perspex and nylon has also been constructed, with a membrane stretched over the end; the whole thing being screwed into the headplate of an Anglicon fermenter. It was not steam sterilisable however, and had to be fitted in a laminar flow cabinet after vessel stenlisation (Gibson and Woodward, 1988), something that greatly limits its use. On-line dialysers may also be placed outside the fermenter eg. between an analysis device such as FIA, and a sterile barrier to the fermenter (Appelqvist et a!., 1989). Dialysis membranes are also used in conjunction with various biosensors (Cleland and Enfors, 1984).
1.1.2.4. Problems with sample separation techniques using filtration
A serious problem has emerged with all the above different types of sample filtration (microfiltration, ultra filtration and dialysis). It has frequently been mentioned that clogging or fouling of the different membrane types causes difficulties with the acquisition of representative samples for analysis, and veiy few of the techniques described to overcome it are practical, especially in production applications, or where the fermentations are long. Clogging or fouling of membranes is not only caused by cells and solids in the fermentation media, but also by components such as antifoam (Hoffman et a!., 1987). Antifoam effects are cumulative and cause a decrease in trans-membrane flux (Cabral eta!., 1985) eg. polyethylene glycol, a typical antifoam, lowers the permeability of many membranes commonly used for this purpose (Kroner and Kula, 1984). The problems can in many cases be eased by backflusiiing, or by the use of rotating filter systems (Kroner et a!., 1987; Rushton and Zhang, 1990), although the latter is not very practical for the typically small sample volumes. Even so, filters often need to be cleaned or even replaced during or between fermentations. Another
problem with filtration for sample preparation is that it only provides analysis of the filtrate, and hence only extracellular broth components; cells and solids are either returned to the fermenter or discarded. Clearly, a completely new approach is needed to overcome this problem.
1.1.2.5. Maintenance of sterility
A very important consideration in sampling from fermenters is the prevention of contamination. Many of the filters or probes described earlier are constructed either so they may be steam-steriised in situ; or fitted outside the fermenter so that valves etc. may be steam sterilised outside the fermenter. An example of this is a sampling system consisting of a recirculation loop, a pump and four three-way valves that are steam sterilisable (Ghoul eta!., 1986). Some researchers, however, have not found satisfactory methods for maintaining sterility; for example, a dialysis probe constructed by Gibson and Woodward (1988) was not steam sterilisable and had to be attached to the fermenter in a laminar flow cabinet after vessel sterilisation. This obviously limits its use to small portable ferinenters.
Other workers have concentrated on this problem. Methods of maintaining asepsis use discontinuous operating valve combinations flushed with steam, sterile water, sterile air, detergents and disinfectants (Hustedt et al.,1985). Appelqvist
et a!., 1992). This is an interesting approach, and it raises the question of how much emphasis should be placed on aseptic sampling when rapid growing organisms are used, especially when grown on a defined medium containing an antibiotic.
1.1.2.6. Analysis of intracellular components
The methods discussed so far are only useful for the analysis of extracellular components, because the cells are either retained by the fermenter, or discarded. Apart from non-invasive methods, veiy little work has been done on the analysis of intracellular components on-line, primarily because of the difficulties in automated sampling and on-line cell disruption. In spite of these difficulties, Ahlmann et a!. (1986), were able to monitor intracellular enzyme activity of recombinant Escherichia coil, by on-line automated sampling and disintegration of cells, followed by transport to an analyzer system which monitored coloured products of the enzyme spectrophotometrically. Different methods of cell disruption were examined for this application: lysozyme plus EDTA; CHC1 3 and toluene plus EDTA; and ultrasonic disintegration. The last of these gave the best results although exact details of the method were not given. Although some success was obtained, particularly early on in the fermentation, later on-line analyses showed substantial deviation from off-line values. Greater success was obtained by Kracke-HeIm et aL (1991) and Valero et a!. (1992) who monitored intracellular 13-galactosidase on-line during in E. coli fermentations by using automatic ultrasonic cell disruption and FIA analysis. In spite of these successes, it is still veiy difficult to do on-line analysis of intracellular components, and performing routine analyses of this type is probably a long way off.
Most work in the field of cell disruption has been done on large scale cell disruption and intracellular product recovery, but many methods may be adapted for small scale use. Methods for cell disruption include:
• Chemical disruption using alkali, detergents and solvents, although such harsh techniques may result in damage to or destruction of biological compounds. This method may be more suitable where small, more stable molecules need to be
analysed.
• Enzymatic methods, eg. the use of lysozyme in cell disruption. This is more effective on gram positive organisms, although some success can be obtained with gram negative cells if EDTA is also used.
• Osmotic shock, although this is generally only effective on fragile organisms. • Ultrasonication, which is useful for small scale cell disruption only.
• Agitation of microorganism suspensions with small glass beads. This is effective at small scale, although a lot of heat may be produced, therefore a cooling jacket may be required (Kula and Schütte, 1987).
• High pressure homogenisation, used for large scale cell disruption, although it may be adapted for disrupting fermenter sample size volumes of cell suspensions.
• Freeze-thawing using a freeze press (Magnusson and Edebo, 1976) or freeze-blasting (Omori et a!., 1989), which are both small scale techniques.
Applicability of current cell-disruption techniques to the analysis of samples of fermentation broth
1.1.3. AnalytIcal methods
This section deals with analytical techniques available for some of the more important fermentation variables that are not generally currently routinely measured on-line. The reasons for wanting to measure these variables have already been discussed in section 1.1.1.
1.1.3.1. Glucose
As mentioned previously, glucose is one of the most widely used substrates in fermentation and because of its clinical importance, a tremendous amount of work has been done on analysis methods, but in this review, only those that have been used in fermentation will be examined. There are a wide range of analysis techniques available, from the use of immobiised enzyme biosensors, to on-line HPLC.
Possibly the most widely used glucose analysis methods are enzymatic, either by using an enzyme electrode, or enzymic reaction in an FIA system or a glucose analyser. The most studied and developed method of enzymatically monitoring glucose is the electrochemical monitoring of H202 at a Pt anode which is produced in the reaction:
glucose + O -' gluconolactone + H202
The reaction is catalysed by the enzyme glucose oxidase (GOD), a stable flavoprotein, the most widely used enzyme in the field of biosensors (Wilson and Turner, 1992). A problem with the GOD reaction with glucose is the dependence on oxygen concentration in the medium. One way of overcoming this problem is described by Rishpon et a!. (1990). The electrode uses immobiised GOD "sandwiched" between two membranes - the inner one to separate the fermentation medium from the enzyme compartment and to reduce the glucose content reaching the enzyme by diffusional limitations; and the outer one being exposed to the air, allowing unlimited oxygen to reach the enzyme whilst preventing liquid leakage. Although it is not dependent on DOT in the
fermenter, a modified reactor is required for its use to enable contact between the outer surface of the probe and the air. This probe is capable of monitoring high levels of glucose (up to O.8M), useful for fermentation monitoring where high levels of glucose frequently occur.
Another way of overcoming the problem of variation in oxygen concentration within the fermenter causing inaccuracies in GOD based glucose measurements is by using a non-oxygen dependent glucose electrode, eg. a ferrocene mediated sensor. Although GOD is highly specific for glucose as opposed to other carbohydrates, oxygen as co-substrate and electron acceptor may be replaced by a number of other compounds. Ferrocene has been found to be excellent for this purpose, being a very good electron acceptor, and is suitable for use in a glucose sensor. Developments in this field have greatly improved the use of glucose probes in fermentation. Grundig and Krabisch (1989) developed an amperometric enzyme electrode for fermentation medium incorporating ferrocene or tetratnafulvene in a graphite epoxy matrix subsequently coated with immobiised GOD. Probes with steam sterilisable housings for in situ monitoring of glucose in fermentation broth using ferrocene mediated electrodes have been described by Brooks et at. (1987/88); Filippini et a!. (1991) and Bradley and Schmid (1991). Cleland and Enfors (1984) developed a sterilisable housing for a GOD based glucose probe with oxygen content of the enzyme preparation kept constant, instead of using ferrocene.