20th International Conference on Structural Mechanics in Reactor Technology (SMiRT 20) Espoo, Finland, August 9-14, 2009 SMiRT 20-Division 7, Paper 2023
Load factor in case when separating aleatory uncertainty and
epistemic uncertainty
Takeshi Ugata
aa
Specialized Structural Group, Taisei Corporation, 1-25-1,Nishi-Shinjuku, Shinjuku-ku, Tokyo, Japan, [email protected]
Keywords: Load and resistance factor design, Aleatory uncertainty, Epistemic uncertainty, Attenuation.
1
ABSTRACT
The uncertainty exists in loads acting on a structure. In general, this uncertainty contains both aleatory uncertainty and epistemic uncertainty. The former is virtually unavoidable, the latter is caused by the limited ability and/or the imperfect information and knowledge. Thus, the load factor derived from aleatory uncertainty is invariable, while that derived from epistemic uncertainty can be decreased when more reliable model or method is applied. This paper shows a procedure of calculating the load factor when aleatory uncertainty and epistemic uncertainty are separated.
2
INTRODUCTION
Various loads are applied to the nuclear facilities. In design process, nominal loads include some safety margins because of their inherent uncertainties.
These uncertainties can be classified into two types. One is aleatory uncertainty, and the other is epistemic uncertainty. The former is virtually unavoidable, such as the fluctuation of annual maximum wind velocity. It is obtained from statistics of observed records directly. The latter is caused by the limited ability and/or the imperfect information and knowledge. This uncertainty exists in several factors such as modelling, empirical formula, fitting of probability distribution and so on. Since aleatory uncertainty is unavoidable, the uncertainty, or the safety margin in nominal load cannot become zero. Only part of safety margin, which is derived from epistemic uncertainty, can be reduced.
Probabilistic safety assessment (PSA) treats these two uncertainties independently. Only aleatory uncertainty is considered in calculating hazard curve and fragility, and epistemic uncertainty is added in them as confidence interval. In design process, however, these uncertainties are not classified. If safety margin by aleatory uncertainty and that by epistemic uncertainty in design loads can be separated, it is beneficial to decrease safety margin. Because we reduce safety margin by epistemic uncertainty only when more detailed models or reliable formula is applied into design process.
3
LOAD FACTOR IN CASE OF SEPARATING ALEATORY UNCERTAINTY AND
EPISTEMIC UNCERTAINTY
Load factor is given as follow.
(
)
1
S S T
n
F
S ! " #
$ %
= (1)
Where FS
( )
x is cumulative distribution function of load, Sn is nominal value of load, !S is separationfactor, !T is target safety index. When both load and resistance have lognormal distribution, Eq.(1) is
(
, ,)
, , , , , 2 , , , exp exp 1 2 1 covS i T S i
S i S i S i
i S i T S i
n i S i n i
S S
! " #
µ µ #
$ = % % = +&! %" %# -( * ).,'
/ 0
1 2
+ (2)
Where !i is load factor of load i, µS i, , covS i, and !S i, are mean, coefficient of variance and logarithmic standard deviation of load i, respectively. There is the relation
2 2
, ln(1 cov , )
S i S i
! = + . (3)
in covS i, and !S i, .
Separation coefficient, !S, is given by
(
)
(
)
, , , 2 2 , ,S i i S i
S i
R R S i i S i
i
! " µ #
! $ µ ! " µ
% %
=
% % +
&
% %(4)
Where ! is resistance factor, µR and !R are mean and logarithmic standard deviation of resistance,
respectively. As seen in Eq.(2) and (4), !i is evaluated by !i itself. Therefore, there is no closed-form
solution, and it must be evaluated numerically. However, in case of single load, Eq.(4) is solved as
2 2 S S R S ! " ! ! = + (5)
If both aleatory uncertainty and epistemic uncertainty in load have lognormal distribution, and they are independent to each other, variability of load are given as.
2 2
, ,
S S r S u
! = ! +! (6)
Where !S r, and !S u, are logarithmic standard deviation of aleatory uncertainty and epistemic uncertainty, respectively.
Substituting Eq.(6) into Eq.(2) and dividing into the term including !S r, and !S u, , we can obtain load factor by aleatory uncertainty, !r, and that by epistemic uncertainty, !u. As seen in Eq.(6), !S r, and !S u, are compatible, so that it is assumed that !r and !u have the same expression. However, aleatory
uncertainty is virtually unavoidable, while epistemic uncertainty can be reduced. Thus, it is useful to express the following equation for designers.
r u
! =! "# (7)
Where, !r is load factor by aleatory uncertainty, and usually the designers never change its value. The
u
! is correction factor by epistemic uncertainty. It can be reduced depend on the degree of reliability of design method. The designers use more reliable model and method, so that !u can be reduced.
Unfortunately, it is difficult to divide into the term including !S r, and !S u, , because exponential function in Eq.(2) has the term of !S. Then, we use the following equation instead of Eq.(6).
, ,
S S r a S u
! =! + "! (8)
From Eq.(6) and (7), we obtain
(
)
2(
)
, , 1 , ,
S r S u S r S u
a= ! ! + " ! ! (9)
Substituting Eq.(6) into !S2 in Eq.(2) and Eq.(8) into !S in Eq(2), then we obtain
, ,
exp 1
2
S r S
r S T S r
n
S
! µ
" = %+# )$ )! '- * (.&,
/ 0
1 2
(10)
, ,
exp
2
S u
u S T S u a
! " = %+# )$ )! '- * (.&,
/ 0
1 2
(11)
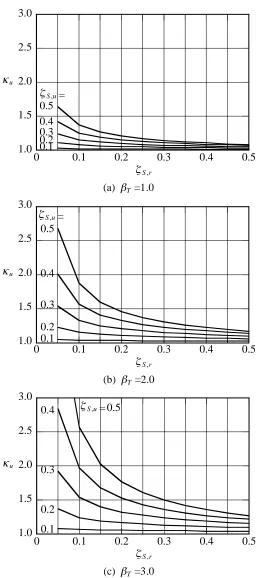
Assuming that 0.2 of logarithmic standard deviation in resistance is due to aleatory uncertainty only, and that nominal value is equal to mean for both load and resistance, we obtain !u shown in Fig.1 for 0.05 <
,
S r
! < 0.5 and 0.1 < !S u, < 0.5. From (a) to (c) in Fig.1 show the case of target safety index !T =1.0, 2.0 and
3.0, respectively. When logarithmic standard deviation of epistemic uncertainty in load, !S u, , is form 0.2 to 0.3, !u become 1.2 to 1.5 for !T=2.0. In other words, load factor by only aleatory uncertainty increases by
20 to 50 percentile by considering 0.2 to 0.3 of !S u, .
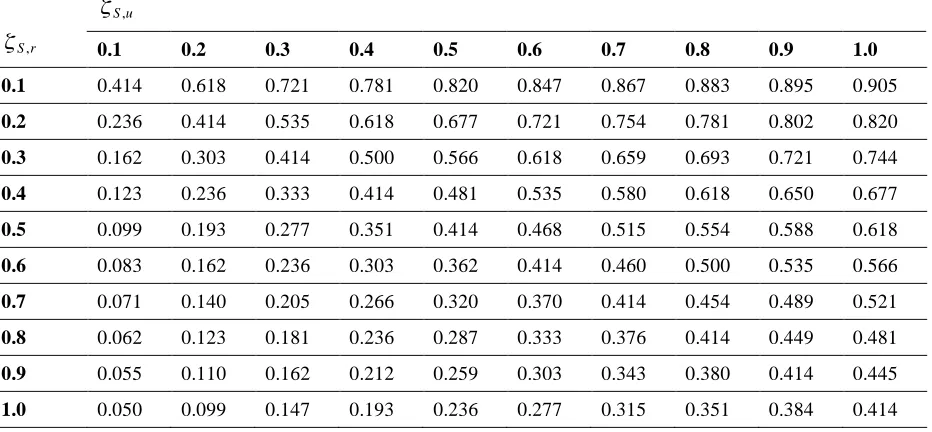
Table 1. Value of a which is calculated by Eq.(9). Where !S r, is logarithmic standard deviation of aleatory uncertainty and !S u, is that of epistemic uncertainty.
,
S u
!
,
S r
! 0.1 0.2 0.3 0.4 0.5 0.6 0.7 0.8 0.9 1.0
0.1 0.414 0.618 0.721 0.781 0.820 0.847 0.867 0.883 0.895 0.905
0.2 0.236 0.414 0.535 0.618 0.677 0.721 0.754 0.781 0.802 0.820
0.3 0.162 0.303 0.414 0.500 0.566 0.618 0.659 0.693 0.721 0.744
0.4 0.123 0.236 0.333 0.414 0.481 0.535 0.580 0.618 0.650 0.677
0.5 0.099 0.193 0.277 0.351 0.414 0.468 0.515 0.554 0.588 0.618
0.6 0.083 0.162 0.236 0.303 0.362 0.414 0.460 0.500 0.535 0.566
0.7 0.071 0.140 0.205 0.266 0.320 0.370 0.414 0.454 0.489 0.521
0.8 0.062 0.123 0.181 0.236 0.287 0.333 0.376 0.414 0.449 0.481
0.9 0.055 0.110 0.162 0.212 0.259 0.303 0.343 0.380 0.414 0.445
1.0 1.5 2.0 2.5 3.0
0 0.1 0.2 0.3 0.4 0.5
0.5 =
0.4 0.3 0.2 0.1
,
S r
! ,
S u
!
u
"
(a) !T =1.0
1.0 1.5 2.0 2.5 3.0
0 0.1 0.2 0.3 0.4 0.5
,
S r
!
u
"
0.5 =
0.4
0.3
0.2 0.1 ,
S u
!
(b) !T =2.0
1.0 1.5 2.0 2.5 3.0
0 0.1 0.2 0.3 0.4 0.5
,
S r
!
u
"
0.5 = 0.4
0.3
0.2
0.1
,
S u
!
(c) !T=3.0
Figure 1. Correlation factor, !u, which is calculated by Eq.(11). Where !S r, is logarithmic standard deviation of aleatory uncertainty, !S u, is that of epistemic uncertainty and !u is correlation factor by
4
EXAMPLE FOR SEISMIC LOAD
In order to confirm the effect of the method shown in previous section, we will demonstrate the example of a seismic load factor for the structural design in the nuclear power plant.
Assume that there is a dominant active fault nearby an objective site. It is predicted that the earthquake with M7.0 will occur from this fault. Its equivalent hypocentral distance, Xeq, is 15km. Thus, a designer decide a seismic source with M7.0 and Xeq =15km as design seismic load.
Several design earthquakes at the nuclear power plant site in Japan are generally evaluated by empirical response spectral attenuation relation, which is proposed by Noda et al. (2002). Using this attenuation relation, we obtain about 2.1 m/s2 of peak ground acceleration (PGA) as shallow crustal earthquake. However, there are uncertainties in this result. According to Noda et al. (2002), about 0.53 of logarithmic standard deviation is estimated as the regression error when this attenuation relation is regressed using strong motion records observed at several rock sites. Of course, several factors, such as regression model, regression procedure, database and so on, cause epistemic uncertainty, so that the regression error includes not only aleatory uncertainty but also epistemic uncertainty. Although it is difficult to estimate the error of aleatory uncertainty only, we assume it referring to the minimum value of the regression error about existing attenuation relations. As long as the author knows, even if detailed regression model and excellent database are applied, the minimum value of the regression error is about 0.2 and more. Thus, the author chooses 0.2 of logarithmic standard deviation of aleatory uncertainty on peak ground acceleration for earthquake with the same magnitude and hypocentral distance. From Eq.(6), we obtain logarithmic standard deviation of epistemic uncertainty.
2 2 2 2
, , 0.53 0.2
S u S S r
! = ! "! = " =0.49 (12)
Note that variability due to the uncertainty on the nuclear facility plant structures is negligible, so that we treat above logarithmic standard deviations as those of structural response, because structural uncertainties are much smaller than that of seismic load.
On the other hand, logarithmic standard deviation of structural strength is assumed to be 0.15 based on experimental results for ultimate strength of seismic wall. Assuming that recurrence period of the interested active fault is 1000 year, and we allow this structure to have 10-6 of annual failure probability for the earthquake due to this fault, then target safety index, !T , become about 2.3 as 10!2 =10!6"1000 of the
conditional failure probability.
Under above condition, we evaluate load factor by aleatory uncertainty, !r, and correction factor by
epistemic uncertainty, !u, from Eqs.(10) and (11).
, ,
0.2
exp 1 exp 0.96 2.3 0.2 1
2 2
S r S
r S T S r
n
S
! µ
" = ,%# )$ )! '. * (/-&= %, ) ) .' * (/&-+
0 1
0 1 2 3
2 3
1.5 (13)
, ,
0.49
exp exp 0.96 2.3 0.49 0.67
2 2
S u
u S T S u a
!
" = ,%# )$ )! '. * (/-&= ,% ) ) .' * (/&-+
0 1
0 1 2 3
2 3
1.6 (14)
Where separation coefficient, !S, and value of a were calculated as follows,
2 2 2 2
0.53
0.15 0.53
S S
R S
! "
! !
= =
+ + =0.96 (15)
(
)
2(
) (
)
2(
)
, , 1 , , 0.2 0.49 1 0.2 0.49
S r S u S r S u
a= ! ! + " ! ! = + " =0.67 (16)
Next, let us consider that we use more reliable attenuation relation. The attenuation relation by Noda et al. (2002) is regressed using seismic records observed at several sites. Therefore, there is epistemic uncertainty due to the difference of site characteristics in this relation. If we can obtain new attenuation relation based on the records observed at objective site, it is more suitable for this site, and epistemic uncertainty is expected to become small.
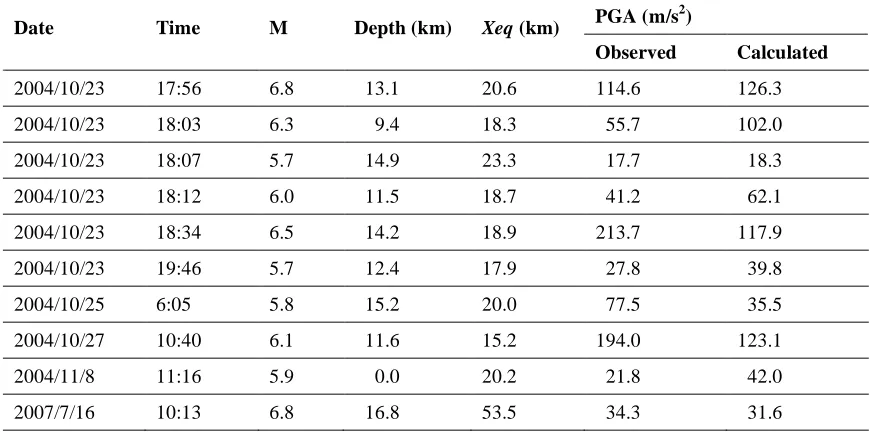
Now, we use strong ground motion data at NIGH12 (Yunotani in Niigata prefecture, Japan) of KiK-net as those of objective site. Table 2 shows peak ground acceleration on rock with 780m/s of shear velocity at NIGH12. Ten shallow crustal earthquakes over M5.5 occur around NIGH12 from AD2000 to period. Using these data, we regress an attenuation relation. Following regression model is adopted.
(
)
logPGA=a M! " !b log Xeq+e " !c Xeq+d (17)
Where we use e=0.006!M0.51 referring to Fukushima and Tanaka (1991). Table 2 also shows calculated PGA using regression results. The logarithmic standard deviation calculated from difference between observed PGA and calculated PGA is 0.43, which is less than that of Noda et al. (2002). In the same manner, assuming that logarithmic standard deviation of aleatory uncertainty is 0.2, we obtain
2 2 2 2
, , 0.43 0.2
S u S S r
! = ! "! = " =0.38. (18)
Using this, we can calculate correlation factor, !u, for new attenuation relation.
0.38 exp 0.96 2.3 0.38 0.60
2
u
! = ") & & $+ ' %,#*(
- .
/ 0
1.4 (19)
Where a=
(
0.2 0.38)
2 +1!(
0.2 0.38)
=0.60 is used. Noted that the separation coefficient, !S, alsochanges because logarithmic standard deviation of seismic load is reduced. However, it does not influence
the separation factor. Indeed, !S =0.43 0.152+0.432 =0.94 is similar to Eq.(15). Furthermore, new attenuation relation provides the same 2.1m/s2 of PGA for design earthquake with M7.0 and Xeq =15km. Thus, the same load factor by aleatory uncertainty, !r, can be used, and we have to design a structure using
(
)
2.1 !1.5 1.4" of load factor for earthquake with 2.1m/s2 of peak ground acceleration. Compared with the case using Node et al.(2002), load factor decreased by about 15%.
Table 2. Strong motion data at NIGH12 used in the regression analysis.
PGA (m/s2)
Date Time M Depth (km) Xeq (km)
Observed Calculated
2004/10/23 17:56 6.8 13.1 20.6 114.6 126.3
2004/10/23 18:03 6.3 9.4 18.3 55.7 102.0
2004/10/23 18:07 5.7 14.9 23.3 17.7 18.3
2004/10/23 18:12 6.0 11.5 18.7 41.2 62.1
2004/10/23 18:34 6.5 14.2 18.9 213.7 117.9
2004/10/23 19:46 5.7 12.4 17.9 27.8 39.8
2004/10/25 6:05 5.8 15.2 20.0 77.5 35.5
2004/10/27 10:40 6.1 11.6 15.2 194.0 123.1
2004/11/8 11:16 5.9 0.0 20.2 21.8 42.0
5
CONCLUSION
The author presented an example of procedure to separate the load factor by epistemic uncertainty as the correction factor from that by aleatory uncertainty. Separating aleatory uncertainty and epistemic uncertainty in load factor is convenient for the designers. If we prepare the correction factor that corresponds to each design model or empirical formula, the designers can change the correction factor according to the adopted model or formula. Adopting a detailed model demands the efforts for the designers, but gives the smallest correction factor. In other words, it becomes the profit of an excellent designer who uses more reliable design techniques. Thus, the author hopes that the research of this area advances.
Acknowledgements. The author would like to acknowledge National Research Institute for Earthquake
Science and Disaster Prevention who gave strong motion data of KiK-net.
REFERENCES
S. Noda, K. Yashiro, K. Takahashi, M. Takemura, S. Ohno, M. Tohdo and T. Watanabe (2002) Response Spectra for Design Purpose of Stiff Structure on Rock Sites, OECD-NEA Workshop on the Relations between Seismological Data and Seismic Engineering Analysis, Oct. 16 18, Istanbul , 399 408