5
IX
September 2017
“A Comparative Study of Static and Dynamic
Analysis of an Irregular Multistory Building with
Different Location of Shear Wall”
Arpana Jain1, prof. Anubhav Rai2
1
M-Tech Student of Structural Engineering, 2
Asst.Prof, Department of Civil Engineering in Gyan Ganga Institute of Technology and Sciences, Jabalpur (M.P.), India. – 482003
Abstract: The main objective this paper is to study the seismic analysis of structure for static and dynamic analysis in an irregular multi-storey structure. Method of analysis Adopted the equivalent static and response spectrum techniques to analyse the model for the present study and observe the lateral displacement of the structure in an irregular structure with and without shear wall position. From the results, it has to be found that which structure will give better performance in zones III for medium soil condition conditions as per earthquake load IS 1893(PART1):2002. We considered the residential building of G+ 11 storied structure for the seismic analysis and it is located in zone III. The total structure was analysed by computer with using STAAD.PRO software. This study aims at comparing various parameters such as shear force, bending moment, maximum displacement, storey displacement. etc. of a building under lateral loads. For this purpose, THREE models are considered without shear wall, with shear wall at interior and shear wall at boundary.
Keywords: Static analysis - ESM, Dynamic analysis – RSM, Shear wall, Irregular building, Staad.pro.
I. INTRODUCTION
Earthquake occurred in multi-storeyed building shows that if the structures are not well designed and constructed with and adequate strength it leads to the complete collapse of the structures. The behaviour of the building during earthquakes depends on its overall shape, size and geometry. Progressive collapse refers to a phenomenon in which local damage in a primary structural element leads to total or partial structural system failure. To ensure safety against seismic forces of multi-storied building hence, there is need to study of seismic analysis to design earthquake resistance structures. As the world move to the accomplishment of Performance Based Engineering philosophies in seismic design of structures Engineering, new seismic design provisions require Structural Engineers to perform both static and dynamic analysis for the design of structure of multi-storey building. This necessitates the need for design based on seismic responses by suitable methods to ensure strength and stability of structures. Shear wall systems are one of the most commonly used lateral load resisting systems in high rise buildings.
The main aims of the present study are as follows
A. To model structures for analysing multi-storeyed frames having different location of shear wall. B. To carry out the analysis of the selected buildings in seismic zone III.
C. To analyse structure by two method ESM and RSM and find out effective one.
D. To make a comparative study with the help of results like bending moment, shear force, displacement etc.
II. LITERATURE REVIEW
Lakshmi K.O.1, Prof. Jayashree Ramanujan, have discussed the Effect of shear wall location in buildings subjected to seismic loads. This study aims at comparing various parameters such as storey drift, storey shear, deflection, reinforcement requirement in columns etc. of a building under lateral loads based on strategic positioning of shear walls. Based on linear and nonlinear analysis procedures adopted. The software used is ETABS 9.5 and SAP 2000. V.14.1.
V.B.S.Purna Nath, Dr. Shaik Yajdani, have done Comparative Study of Static and Dynamic Seismic Analysis of a Multistoried Building under Pushover Analysis. Ten storied building is analyzed and compared in seismic zone-II using Equivalent Static Method and Response Spectrum Method, then Pushover Analysis is assigned in both methods.
analyzed with linear static analysis (Equivalent Static method). Secondly, linear dynamic analysis (response spectrum method) is used. The results of analysis such as lateral story loads, displacement, storey shear, storey stiffness, storey moment and storey drift are obtained.
Shahzad Jamil Sardar and Umesh. N. Karadi, have presented effect of change in shear wall location on storey drift of multistorey building subjected to lateral loads. Two sixteen storey building have been modeled using software package ETABS for earthquake V zone in India. Different position and location of shear walls are considered for studying their effectiveness in resisting lateral forces. This paper also deals with the Dynamic Linear Response spectra method and static method on multi-storey shear wall building with variation in number and position of shear wall. Based on the analysis results they found that as per the analysis storey drift in the Model M2 is less than Model M1.
Mr. Shailesh Patil , Prof. K. K. Tolani, have presented Review on Limit State Design and Analysis of Multi-storey Building with and Without Shear Wall by Using STAAD Pro software. In this paper, the main focus is to carry out extensive literature survey and to determine the scope of work regarding shear wall analysis and design. In this paper, the scope of study is to investigate the effect of location of shear wall in a building under lateral forces.
III. METHODOLOGY
A. Methodology and Selection of Problems
1) The analysis of a structural system to determine the deformations and forces induced by applied loads or ground excitation is an essential step in the design of a structure to resist earthquakes.
A structural analysis procedure requires:
a)
a model of the structure,b)
a representation of the earthquake ground motion or the effects of the ground motion andc)
a method of analysis for forming and solving the governing equations.There is a range of methods to analysis of a detailed structural model that can be used, depending on the purpose of the analysis in the design process. In many design procedures it is common to perform equivalent static analysis for static analysis and response spectrum analysis for dynamic analysis.
2) The following steps were followed in analysing the structures through simplified code method –
a)
Selection of building geometry, bays and storey with and without shear wall.b)
Selection of response reduction factor (SMRF and shear wall with SMRF) models as per Table 7 of IS 1893 (PART 1):2002.c)
There are different zones as per Table 2 of IS 1893 (PART 1): 2002.We are Selecting seismic zones III.d)
Selection of Importance factor as per Table 6 of IS 1893 (PART 1):2002.e)
Modelling of building frames using STAAD. Pro software.f)
We analyse the building with ESM and RSM. And determine the seismic weight of building as per IS 1893 (PART 1): 2002. With different models shear wall and wall frame.g)
In ESM analyses, different models, seismic zones III and 15 load combinations are considered.h)
In RSM analyses, different models, seismic zones III and 20 load combinations are considered.i)
Comparative study of results in terms of beam forces, displacement and storey displacement.j)
Remove all the load combination of (RS) Response (load case no. 5, 10, 13, 17 and 20) which is given in below chart and use remain 15 Load Combinations for ESM Analyses.LOAD CASE NO. LOAD CASE DETAILS
1. E.Q. IN X_DIR.
2. E.Q. IN Z_DIR.
3. DEAD LOAD
4. LIVE LOAD
5. RESPONSE
6. 1.5 (DL + LL)
8. 1.2 (DL + LL + EQ_X)
9. 1.2 (DL + LL + EQ_Z)
10. 1.2 (DL + LL +RS)
11. 1.2 (DL + LL - EQ_X)
12. 1.2 (DL + LL - EQ_Z)
13. 1.2 (DL + LL - RS)
14. 1.5(DL)
15. 1.5 (DL + EQ_X)
16. 1.5 (DL + EQ_Z)
17. 1.5 (DL + RS)
18. 1.5 (DL - EQ_X)
19. 1.5 (DL - EQ_Z)
20. 1.5 (DL - RS)
B. 3.2 Analysis Of Building Frames
Modelling and Analysis of building frames is carried out as per following details 1) Modelling of building frames
STAAD. Pro is used in modelling of building frames. STAAD. Pro is Structural Analysis and Design Program is a general-purpose program for performing the analysis and design of a wide variety of structures. The essential 3 activities which are to be carried out to achieve this goal are -
a)
Model generationb)
Calculations to obtain the analytical resultsc)
Result verification- These are all facilitated by tools contained in the program's graphical environment. Following geometries of building frames are considered for analysis-CASES STRUCTURE METHOD
USED STRUCTURE TYPE
CASE 1 STATIC STRUCTURE ESM WITHOUT SHEAR WALL
CASE 2 STATIC STRUCTURE ESM SHEAR WALL AT INTERIOR
CASE 3 STATIC STRUCTURE ESM SHEAR WALL AT BOUNDARY
CASE 4 DYNAMIC STRUCTURE RSM WITHOUT SHEAR WALL
CASE 5 DYNAMIC STRUCTURE RSM SHEAR WALL AT INTERIOR
CASE 6 DYNAMIC STRUCTURE RSM SHEAR WALL AT BOUNDARY
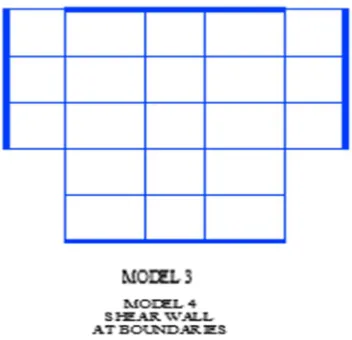
C. Structural Models
Figure 3.1: Common Base Plan For All Three Structures
The column size is of 0.50 m x 0.50 m, and the beam size is 0.23 m x 0.50 m.
D. Material And Geometrical Properties
Following properties of material have been considered in the modelling - Unit weight of RCC: 25 kN/m3
Unit weight of Masonry: 20 kN/m3 (Assumed) Modulus of elasticity, of concrete: 5000 Poisson's ratio: 0.17
The depth of foundation is 2 m and the height of floor is 3 m.
E. Loading Conditions
Following loading conditions are used-
1) Dead Loads: according to IS code 875 (part 1) 1987
a)
Self weight of slabb)
Slab = 0.15 m x 25 kN/m3 = 3.75 kN/m2 (slab thickness 0.15 m assumed) Finishing load = 1.5 kN/m2 , Total slab load = 3.75 + 1 = 5.25 kN/m2c)
Masonry external wall Load = 0.23 m x 3 m x 20 kN/m3 = 13.8 kN/md)
Masonry internal wall Load = 0.115 m x 3 m x 20 kN/m3 = 6.9 kN/me)
Parapet wall load = 0.23 m x 1 m x 20 kN/m3 = 4.6 kN/m 2) Live Loads: according to IS code 875 (part-2) 1987 Live Load = 3 kN/m2Live Load on earthquake calculation = 0.75 kN/m2
3) Seismic Loads: Seismic calculation according to IS code 1893 (2002)
a)
Seismic zone- III (assume) (Table - 2)b)
Importance Factor: 1.5 (Table - 6)c)
Response Reduction Factor:d)
SMRF WITHOUT SHEAR WALL: 5 (Table - 7)e)
3.2 SMRF WITH SHEAR WALL: 4 (Table - 7)f)
Damping: 5% (Table - 3)g)
Soil Type: Medium Soil (Assumed)h)
Period in X direction (PX): .i)
Period in Z direction (PZ): .√ seconds: (.88 Sec.) Clause 7.6.2
where, h = building height in meter
dx= dimension of building along X direction in meter dz= dimension of building along Z direction in meter F. Loading Diagram
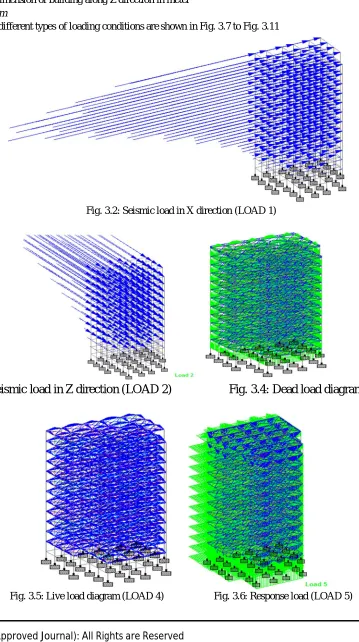
[image:6.612.125.484.129.771.2]Typical diagram for different types of loading conditions are shown in Fig. 3.7 to Fig. 3.11
Fig. 3.2: Seismic load in X direction (LOAD 1)
[image:6.612.132.475.163.325.2]Fig. 3.3: Seismic load in Z direction (LOAD 2) Fig. 3.4: Dead load diagram (LOAD 3)
IV. RESULT ANALYSIS
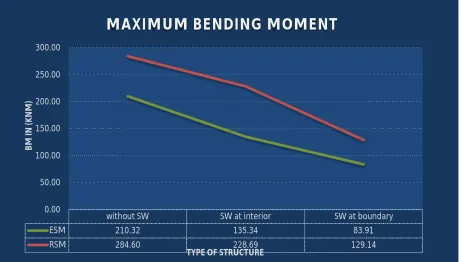
A. Bending moment
Maximum bending moment (kNm) for Zone III is shown in Fig.4.1.
Figure 4.1: Maximum Bending Moment (kN) in Zone III
It is observed that maximum bending moment is seen in RSM and minimum in ESM. In RSM, at without SHEAR WALL structure showed most bending moment. In ESM, considerable difference in moment and minimum bending moment in shear wall at boundary structure.
B. Shear Force
[image:7.612.77.539.118.380.2]Maximum shear force (kN) for all four structures is shown in Fig. 4.2.
Figure 4.2: Maximum Shear Force (kN) in Zone III
without SW SW at interior SW at boundary
ESM 210.32 135.34 83.91
RSM 284.60 228.69 129.14
0.00 50.00 100.00 150.00 200.00 250.00 300.00 B M IN ( K N M )
TYPE OF STRUCTURE
MAXIMUM BENDING MOMENT
Without SW SW at interior SW at baundary
ESM 126.45 114.58 85.89
RSM 137.41 125.60 105.17
0.00 20.00 40.00 60.00 80.00 100.00 120.00 140.00 160.00 SHE AR F O R C E IN ( K N )
TYPE OF STRUCTURE
It is observed that maximum shear force is seen in RSM and minimum in ESM. The shear forces are close values in all cases. SHEAR WALL at BOUNDARY structure showed minimum shear forces value and without shear wall structure showed most shear force value.
C. Maximum Displacement
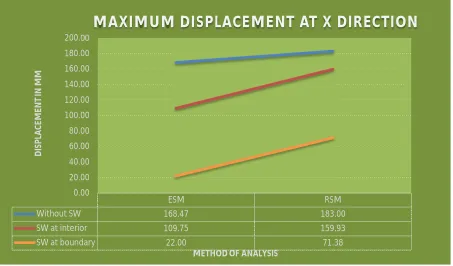
[image:8.612.81.534.154.420.2]Maximum displacement (mm) in Zone III at X direction is shown in Fig.4.3
Figure 4.3: Maximum Displacement (mm) In Zone III at X Direction
It is observed that in X Direction maximum displacement is seen in RSM and minimum in ESM. In both ESM & RSM without SHEAR WALL structure showed most displacement and SW at BOUNDARY structure showed minimum displacement. In ESM, considerable difference in displacements.
Maximum displacement (mm) in Zone III at Z direction is shown in Fig.4.4.
Figure 4.4: Maximum Displacement (mm) In Zone III at Z Direction
ESM RSM
Without SW 168.47 183.00
SW at interior 109.75 159.93
SW at boundary 22.00 71.38
0.00 20.00 40.00 60.00 80.00 100.00 120.00 140.00 160.00 180.00 200.00 D ISP LAC EM EN T IN M M
METHOD OF ANALYSIS
MAXIMUM DISPLACEMENT AT X DIRECTION
ESM RSM
Without SW 138.28 138.28
SW at interior 93.03 93.03
SW at boundary 30.05 30.05
0.00 20.00 40.00 60.00 80.00 100.00 120.00 140.00 160.00 D ISP LAC E M EN T IN M M
METHOD OF ANALYSIS
[image:8.612.77.538.494.722.2]It is observed that in Z maximum Direction displacement is same in both method (ESM and RSM) and for all four cases of structure.
D. Storey Displacements
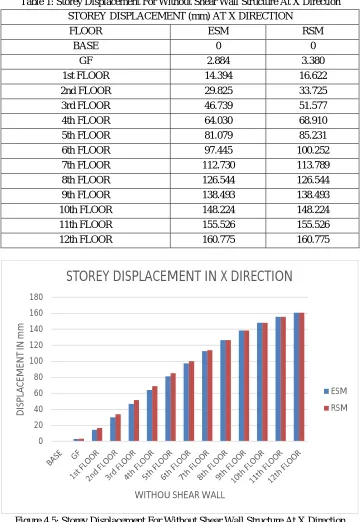
Storey displacement (mm) for Without SHEAR WALL structure at X direction is shown in Table 1 and Fig.4.5. Table 1: Storey Displacement For Without Shear Wall Structure At X Direction
STOREY DISPLACEMENT (mm) AT X DIRECTION
FLOOR ESM RSM
BASE 0 0
GF 2.884 3.380
1st FLOOR 14.394 16.622
2nd FLOOR 29.825 33.725
3rd FLOOR 46.739 51.577
4th FLOOR 64.030 68.910
5th FLOOR 81.079 85.231
6th FLOOR 97.445 100.252
7th FLOOR 112.730 113.789
8th FLOOR 126.544 126.544
9th FLOOR 138.493 138.493
10th FLOOR 148.224 148.224
11th FLOOR 155.526 155.526
[image:9.612.126.489.144.666.2]12th FLOOR 160.775 160.775
Figure 4.5: Storey Displacement For Without Shear Wall Structure At X Direction
In ESM and RSM it is observed that storey displacement is seen same in top 5 story and seen difference in below story and maximum displacement is seen in RSM and minimum in ESM
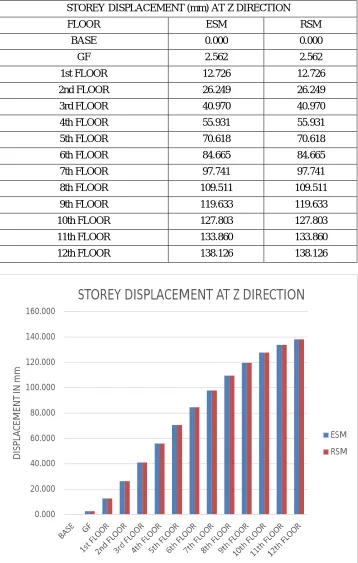
Storey displacement (mm) in Without SHEAR WALL structure at Z direction is shown in Table 2 and Fig.4.6.
0 20 40 60 80 100 120 140 160 180
D
IS
P
LA
C
EM
E
N
T
IN
m
m
WITHOU SHEAR WALL
STOREY DISPLACEMENT IN X DIRECTION
ESM
Table 2: Storey Displacement For Without Shear Wall Structure At Z Direction STOREY DISPLACEMENT (mm) AT Z DIRECTION
FLOOR ESM RSM
BASE 0.000 0.000
GF 2.562 2.562
1st FLOOR 12.726 12.726
2nd FLOOR 26.249 26.249
3rd FLOOR 40.970 40.970
4th FLOOR 55.931 55.931
5th FLOOR 70.618 70.618
6th FLOOR 84.665 84.665
7th FLOOR 97.741 97.741
8th FLOOR 109.511 109.511
9th FLOOR 119.633 119.633
10th FLOOR 127.803 127.803
11th FLOOR 133.860 133.860
[image:10.612.128.486.90.653.2]12th FLOOR 138.126 138.126
Figure 4.6: Storey Displacement For Without Shear Wall Structure At Z Direction
It is observed that storey displacement is seen same in ESM and RSM.
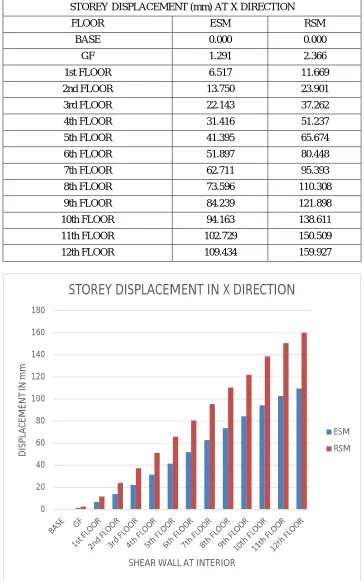
Storey displacement (mm) for SHEAR WALL at INTERIOR structure at X direction is shown in Table 3 and Fig.4.7.
0.000 20.000 40.000 60.000 80.000 100.000 120.000 140.000 160.000
D
IS
P
LA
C
EM
EN
T
IN
m
m
WITHOUT SHEAR WALL
STOREY DISPLACEMENT AT Z DIRECTION
ESM
Table 3: Storey Displacement For Shear Wall At Interior structure At X Direction STOREY DISPLACEMENT (mm) AT X DIRECTION
FLOOR ESM RSM
BASE 0.000 0.000
GF 1.291 2.366
1st FLOOR 6.517 11.669
2nd FLOOR 13.750 23.901
3rd FLOOR 22.143 37.262
4th FLOOR 31.416 51.237
5th FLOOR 41.395 65.674
6th FLOOR 51.897 80.448
7th FLOOR 62.711 95.393
8th FLOOR 73.596 110.308
9th FLOOR 84.239 121.898
10th FLOOR 94.163 138.611
11th FLOOR 102.729 150.509
12th FLOOR 109.434 159.927
Figure 4.7: Storey Displacement For Shear Wall At Interior structure At X Direction
It is observed that in SHEAR WALL at INTERIOR structure, maximum storey displacement is seen in RSM and minimum in ESM. Storey displacement (mm) for SHEAR WALL at INTERIOR structure at Z direction is shown in Table 4 and Fig.4.8.
0 20 40 60 80 100 120 140 160 180
D
IS
P
LA
C
E
M
E
N
T
IN
m
m
SHEAR WALL AT INTERIOR
STOREY DISPLACEMENT IN X DIRECTION
ESM
[image:11.612.124.488.91.672.2]