Specification and Analysis of Discrete Behavior
of Hybrid Systems in the Workbench ISMA
Yury V. Shornikov, Dmitry N. Dostovalov, Maria S. Myssak, Artem N. Komarichev, Andrey M. Tolokonnikov
Department of Automated Control Systems, Novosibirsk State Technical University, Novosibirsk, Russia Email: [email protected], [email protected], [email protected],
[email protected], [email protected]
Received 2013
ABSTRACT
Hybrid systems are important in applications in CAD, real-time software, robotics and automation, mechatronics, aero-nautics, air and ground transportation systems, process control, and have recently been at the center of intense research activity in the control theory, computer-aided verification, and artificial intelligence communities. In the past several years, methodologies have been developed to model hybrid systems, to analyze their behavior, and to synthesize con-trollers that guarantee closed-loop safety and performance specifications. These advances have been complemented by computational tools for the automatic verification and simulation of hybrid systems. Modern technologies of computer simulation tools include preparing, debugging, analysis and calculation of effective program models, meaningful inter-pretation of research results.
Keywords: Hybrid System; Statechart; Event Detection; Differential-algebraic Equations; Simulation Tools
1. Introduction
There are many systems (mechanical, electrical, chemi-cal, biologichemi-cal, etc.), the behavior of which can be con-veniently described as a sequential change of continuous modes. These systems are referred to as hybrid (HS) or event-continuous. Each mode is given by a set of differ-ential-algebraic equations with the following constraints:
0
0 0
0 0 y x y y x y x y x k N N N N N N N Nx N N Sy f x, y, t ,x x, y, t , pr : g x, y, t , t t , t ,x t x , y t y
x R , y R ,t R, 0,
f : R R R R ,
: R R R R ,
g : R R R R .
) (1)
The vector-function g x, y,t(
0
is referred to as event function or guard. A predicate determines the con-ditions of existence in the corresponding mode or state. Inequality means that the phase trajectory in the current mode should not cross the border
. Events occurring in violation of this con-dition and leading to transition into another mode with-out crossing the border are referred to as one-sided.
Many practical problems are characterized by stiff modes, and the surface of boundary has sharp angles or solution has several roots at the boundary [1]. Numerical analysis of such models by traditional meth-ods is difficult or impossible, as it gives incorrect results. Therefore it is necessary to use special methods to detect events accurately.
pr
( )
g x, y,t
) 0 (
g x, y,t
( )
g x, y,t 0
Computer analysis of these systems is typically per-formed in simulation tools, best of which are Charon (USA), AnyLogic (Russia), Scicos (France), MVS (Rus-sia), Hybrid Toolbox and HyVisual (USA), DYMOLA (Sweden) and etc.
The specification of the discrete behavior of HS re-flects the instantaneous discrete transitions from one state to another one. State diagrams allow to easily describe HS models of any formalism and to represent semantics of HS modes and mechanism of discrete transitions in intuitive manner.
This paper describes the features of design and HS models analysis in the ISMA instrumental environment [2].
2. Discreet Behavior of Hybrid Systems and
Its Specification
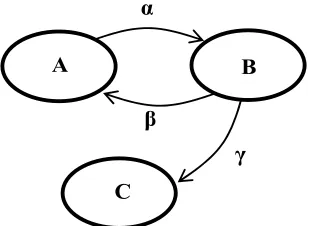
in information technology and related fields. This ap-proach was proposed by D. Harrel [3] and is a descrip-tion of complex dynamic systems. Statecharts represent directed graph whose nodes correspond to states of con-tinuous object, arcs – to discrete transitions (changing of states). System can be represented by statecharts if it is characterized by a finite number of continuous states. The method allows to describe the operating logic of the object in visual form in order to represent its behavior at the continuous parts of the phase trajectory and to specify the continuous state changes conditions. For example, Figure 1 shows a Harel statechart, where A,B,C corre-sponds to the continuous states; α, β, γ – to the predicates (conditions).
Graphics Editor
Graphics editor was designed by our team for a clearer representation of statecharts (Figure 2).
The editor is developed on the object-oriented pro-gramming language Java. The main reason for choosing this language is that programs written in Java are cross-platform.
α
β
γ
A B
[image:2.595.83.264.506.725.2]C
Figure 1. Example of statetchart.
Figure 2. Graphics editor.
The right panel is for editing of the base statechart. On the left panel there are elements that can be dragged to the right panel for further work with them (drag-and- drop). In addition, there was developed menu that is standard for applications running on the Windows.
The editor commands are controlled by hot keys. These keys are responsible for copy, paste, delete, and edit the selected state or arc. Thus the editing of states and transitions is a convenient process.
Designed application allows you to convert a graphical representation of simulation model. The transformation algorithm includes the steps of the analysis and the selec-tion of all the states and transiselec-tion, relaselec-tionships defini-tion and generadefini-tion in computadefini-tional model taking into account the defined relations.
3. Event Detection in Hybrid Systems
The correct analysis of hybrid models is significantly depends on the accuracy of detection of the change of the local states of the HS. Therefore, the numerical analysis is necessary to control not only the accuracy and stability of the calculation, but also the dynamics of the event- function. The degree of approximation by the time the event occurred is defined by the behavior of event driven function.
Consider the mode of one-sided HS as a Cauchy prob-lem with constraints (1).
Any non-linear guard g(x, y,t) can be reduced to linear form by adding the phase variable zg(x, y,t). As a result, problem (1) can be rewritten as follows (for simplicity we omit the algebraic equations and proceed to the autonomous Cauchy problem:
0
g g
y f ( y ), z f ( y ) z
y t ,
.
In solving these problems by using explicit methods [4], we obtain yn1ynhn1n, . Then the event dynamic is described as
0 1 2
n , , ,...
1 1
n n n n n n 1
g g( y h ,t h ).
Decomposing the gn1 gn1 in a Taylor series and taking into account the linearity of g y,t
, we obtain the dependence of gn1 of the projected step hn1:1 1 n
n n n g n gn
g g h
y t
(2) Theorem. The choice of the step according to the formula
1 1 n
n
n n
n g
h ( )
g g
y t
(3)
as a stable linear system, the solution of which is asymp-totically approaching to the surface g( y,t )0.
Proof. Substituting (3) in (2), we have gn1gn, . Converting recurrently this expression we
get 0
0 1 2 n , , ,
1
n n 1
g g . Given that 1, then takes place when . In addition, condition
0 n
g
0
n
implies that function gn does not change sign. There-fore, when 0 , will be valid for all n. Then the guard condition will potentially never cross poten-tially the dangerous area
0
g gn0
n nt
0n t
g y , , which com-pletes the proof.
Let us formulate integration algorithm, taking into ac-count the forecast of step by an event function. Let the solution n in the point n is calculated with step n. Then the approximate solution at the point
y t h
1 is cal-culated as follows.
Step 1. Calculate the function fn f ( y )n n
.
Step 2. Calculate the functions g g(y ,t )n n ,
n n n
g / y g( y ,t ) / y
, g / tn g( y ,tn n
1
) / y
.
Step 3. Calculate the step hnp by (3), where n fn
.
Step 4. A new step n 1 is calculated by the formula 1
1 , where 1 is step by selecting the numerical method of integration.
h
1 p n
n n n
h min h ,h n
n h
Step 5. Go to next step of integration.
In the practical implementation of the algorithm it is necessary to consider the following. Near the boundary regime denominator (3) will be positive, and away from the boundary becomes negative. Then, de-fining the direction of change event-function, we cannot perform step 4 of the algorithm and do not impose any further restrictions on the integration step if the event- function is removed from the boundary of state.
0 g( y,t )
Test of the Event-detection Algorithm
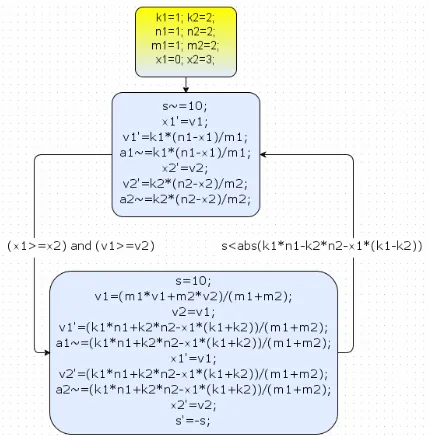
To illustrate the event-detection algorithm we consider a hybrid system of two oscillating masses on springs [5], shown in Figure 3.
The system can be in one of two local states: when masses move separately or together. Mathematical model is not presented here because of the proximity to descrip-tion of the computer model. A computer model of system in the ISMA shown in Figure 4.
Qualitative simulation results are obtained with en-abled event-detection algorithm (Figure 5). Traditional analysis of the system without using the event-detection algorithm does not allow to obtain valid results as shown in (Figure 6).
[image:3.595.316.531.84.302.2]Figure 3. The system of two oscillating masses.
[image:3.595.321.520.344.476.2]Figure 4. A computer model of the system in ISMA instru-mental environment.
[image:3.595.322.522.515.654.2]Figure 5. Calculation results (using the event-detection al-gorithm).
Figure 6. Calculation results (excluding the event-function dynamics).
4. Dry Friction Dynamics Simulation
Figure 7. Simulation object.
[image:4.595.354.491.85.210.2]The motion of body has an oscillation nature, where the motion stage and the resting stage are changing peri-odically. The motion stage is divided on the motion in range of Shtribeck effect at low speeds and the motion in range of Amonton-Coloumb law.
Figure 8. The hybrid model of dry friction.
[image:4.595.180.415.313.553.2]Obtained simulation results are shown in the Figure 9 and Figure 10. Time charts of tension of spring x, body velocity V, friction force F, displacement of the body relative to the origin l and local state z are presented in Figure 9.Figure 10 illustrates the phase diagram. The Hybrid model in the formalism of hierarchical
behavioral maps designed in the ISMA is shown in Fig-ure 8.
[image:4.595.63.280.584.677.2]Figure 8(a) corresponds to the top-level behavioral map, Figure8(b) illustrates the motion stage.
Figure 9. Simulation results. Time characteristics.
Figure 10. Simulation results. Phase diagram.
5. Acknowledgements
This work was supported by the Russian Foundation for
Basic Research under grant 11-01-00106-a.
REFERENCES
[1] J. Esposito, V. Kumar and G.J. Pappas, “Accurate Event Detection for Simulating Hybrid Systems,” In: Hybrid Systems: Computation and Control (HSCC), Vol. LNCS 2034, 1998.
[3] D. Harel, “Statecharts: A Visual Formalism for Complex Systems,” Science of Computer Programming Program-ming, Vol. 8, 1987, pp. 231-274.
[4] E. A. Novikov, “Explicit Methods for Stiff Systems,” Novosibirsk: Nauka. Sib. Enterpr. The Russian Academy of Sciences, 1997.
[5] A. E. Novikov, E. A. Novikov, Y. V. Shornikov and D. N. Dostovalov, “Numerical Simulation of Hybrid
Sys-tems with an Explicit Method of Order in the ISMA In-strumental Environment,” Problems of Informatics, Vol.3, 2010, pp. 73-80.