IJPSR (2019), Volume 10, Issue 11 (Research Article)
Received on 10 February 2019; received in revised form, 15 May 2019; accepted, 01 June 2019; published 01 November 2019
QbD BASED RP-HPLC METHOD DEVELOPMENT FOR FIVE FLUOROQUINOLONE ANTI-BACTERIALS - THROUGH CREATION OF DESIGN SPACE FOR CRITICAL ATTRIBUTES
S. S. Kudchadkar * and S. P. N. Pai
Department of Pharmaceutical Analysis, Goa College of Pharmacy, 18th June Road, Panaji - 403001, Goa,
India.
ABSTRACT:Quality by Design (QbD) has become an important concept for the pharmaceutical industry, and ICH recommends this concept through the Guideline Q8 (R2) wherein if the method is proved to be rugged and robust within the limits of a Design Space then approval may be requested for such a Design Space, and the method does not need redevelopment, revalidation, and reapproval during transfers, thereby saving significant time and resources. In this study, the QbD approach was used to develop a reverse-phase–high-performance liquid chromatography (RP–HPLC) method that could be applied for the estimation of several antibacterial agents of the fluoroquinolone group. The method was applied to five selected fluoroquinolones, namely, ciprofloxacin, levofloxacin, norfloxacin, moxifloxacin, and ofloxacin. The method developed used C18 column of make Phenomenex (250 mm × 4.6 mm, 5 μm) with mobile phase comprising of methanol and phosphate buffer (pH 3.0) in the proportion 70:30 at a flow rate of 1.25 ml/min and detection was carried out using a PDA detector at 294 nm. The method while being validated as per ICH guidelines, using ANOVA, simultaneously created a design space which set limits for critical attributes affecting the robustness. Any variations in these parameters within the design space does not affect method performance, making the method easily transferrable.
INTRODUCTION: The fluoroquinolones (FQs)
are a family of broad-spectrum, systemic
antibacterial agents that are being used widely for the treatment of respiratory and urinary tract
infections. The first quinolone was reported in the
early 1960s, with the isolation of 7-chloro-l-ethyl-1, 4-dihydro-4-oxyquinoline-3-carboxylic acid, a by-product of the commercial preparation of chloroquine.
QUICK RESPONSE CODE
DOI:
10.13040/IJPSR.0975-8232.10(11).4907-12
This article can be accessed online on www.ijpsr.com
DOI link: http://dx.doi.org/10.13040/IJPSR.0975-8232.10(11).4907-12
Since this particular substance was discovered to have anti-bacterial activity, it was used to produce
nalidixic acid, which is a 1, 8-naphthyridine 1.
After the passage of many decades, the members of this class, even the older agents are still finding a
use for various treatments 2, 3. The concept of
Quality by Design has gained a lot of importance in Pharma Industry, and any analytical method developed using QbD principles does not need redevelopment, revalidation, and reapproval during transfers, provided one work within the limits of the approved Design Space, thereby saving time
and resources 4.
The work reported here describes our efforts towards using QbD principles and creation of a Design Space as recommended by ICH Q8 (R2) in
Keywords:
Fluoroquinolones, RP-HPLC, QbD, Design space
Correspondence to Author: S. S. Kudchadkar
Assistant Professor,
Department of Pharmaceutical Analysis, Goa College of Pharmacy, 18th June Road, Panaji - 403001, Goa, India.
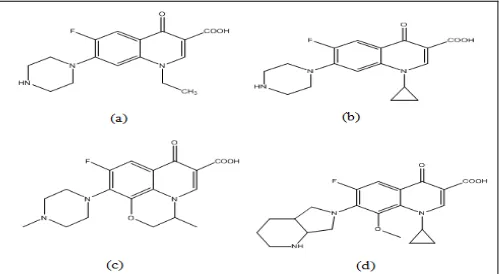
the development and validation of a common analytical method for five selected FQs, namely,
ciprofloxacin (CIP), levofloxacin (LEV),
moxifloxacin (MOX), norfloxacin (NOR) and ofloxacin (OFL), the chemical structures of which
have been shown in Fig. 1. A literature survey did
not reveal any common method for these five FQs. Most of the reported analytical methods aimed at simultaneous estimation of FQs making the method complicated, involving gradient elution and fluorescence or other highly sophisticated detection
and quantitation methods 5, 6, 7, 8, 9. As such, even
though one often deals with multiple members of this class, they are not used in combination with each other. Hence, it was thought to develop an analytical method which was simple and quick and could be commonly used for the majority of the class. The method has been developed and
validated as per ICH guidelines10 and using QbD
approach 11, 12, 13, 14.
FIG. 1: STRUCTURES OF (A) NOR, (B) CIP, (C) OFL
AND LEV* AND (D) MOX. *LEV is levorotatory whereas
OFL is a racemic mixture, having the same chemical structure MATERIALS AND METHODS:
Chemicals: The chemicals used were methanol (HPLC grade of Merck), HPLC grade water obtained in-house from BioAge Ultra Water Purification system, orthophosphoric acid and potassium dihydrogen orthophosphate (AR grade)
The pure drugs were obtained as gift samples from Abaris Healthcare Pvt. Ltd., Ahmedabad, Gujarat, India.
The experimental work was performed at the Central Instrument Laboratory of Goa College of Pharmacy, Panaji, Goa, India.
Equipment: The following equipment/instruments were used: Electronic Weighing Balance (Wensar),
sonicator (Citizen), pH meter (Labtronics), HPLC (Jasco) with ChromNav software and Phenomenex C18 column.
Chromatographic Conditions: The HPLC system used was Jasco CO-4061 with Autosampler (AS-4050) and a PDA detector and built-in degasser. The system used ChromNav software.
After various trials, Phenomenex C18 column (250 mm × 4.6 mm i.d., 5µ) was selected with a mobile phase composed of methanol and phosphate buffer.
The mobile phase used was 70 parts methanol and 30 parts buffer. Phosphate buffer pH 3.0 was prepared by dissolving Potassium dihydrogen orthophosphate in water and adjusting the pH to 3.0 by using orthophosphoric acid. Mobile phase components were sonicated for 15min and filtered through 0.45µ membrane filters before use.
The flow rate was maintained at 1.25 ml/min and a detector set to wavelength 294 nm. Autosampler used had variable loop volume 0-100 µl, and in this method, 20 µl was injected. The system had a column oven making it possible to program column temperatures during the run. After a trial at various temperatures, it was decided to set the column temperature at 40 °C throughout the method.
Optimized chromatographic conditions for selected
fluoroquinolones are shown in Table 1.
TABLE 1: OPTIMIZED CHROMATOGRAPHIC
CONDITIONS
Parameters Values
Stationary phase (column)
C18
(250 mm × 4.6 mm, 5 μm) Mobile phase Methanol: phosphate buffer
pH 3.0 (70:30, v/v) Flow rate (mL/min) 1.25
Run time (min) 5.0 Column Temperature 40°C Injection Volume (µl) 20 Detection Wavelength (nm) 294 Method Development:
Selection and Preparation of Mobile Phase:
Mobile phases containing methanol, water,
[image:2.612.49.299.340.477.2]pH3.0. The 20 mM buffer was prepared by dissolving 2.72 gm of potassium dihydrogen orthophosphate per liter of buffer solution and adjusting pH to 3.0 by using orthophosphoric acid with the help of pH meter. Both components of the mobile phase were filtered through 0.45µm membrane filters by application of vacuum and sonicated for 15 min before introducing into the system.
Preparation of Standard Stock Solutions: The standard solutions of the drugs were prepared in methanol. A quantity of 25 mg of each drug was weighed and dissolved in methanol in 25 ml volumetric flasks, to give standard stock solutions
of 1000 μg/mL of each drug. The standard stock
solutions were further diluted with methanol to obtain required concentrations of each drug. All solutions, including stock solution, were freshly prepared each day.
Preparation of Calibration Curve: Volumes of standard stock solutions of each drug were transferred to a 10 mL volumetric flask and diluted up to the mark with methanol. Aliquots were taken in such a way to obtain final concentrations in the range of 10-60 μg/mL for each drug.
Three injections of 20 µl of each concentration were analyzed using optimized conditions. Each reading or peak area recorded was average or meant of three readings.
Calibration curves were plotted for each drug by plotting peak areas recorded for each concentration on the y-axis and the concentration of the drug on
the x-axis. The coefficient of determination (R2)
was calculated for the calibration curve of each drug.
Method Validation: The method developed was validated as per ICH guidelines by evaluating parameters such as accuracy, precision, linearity,
robustness, ruggedness, detection, and
quantification limits. The results were evaluated considering acceptable limits as less than 2% for Relative Standard Deviation (RSD).
Precision: The precision of the developed method was confirmed for each of the drugs. The peak areas recorded by actual analysis of six replicate injections of a standard concentration of each drug.
The precision of the method was also checked in terms of the intra- and inter-day variation in the peak areas by calculating the RSD.
Accuracy: The accuracy of the method was tested for each of the drugs by spiking a known concentration of each drug at three different concentration levels, namely 80%, 100%, and 120%, and then comparing the difference between
the expected/theoretical value and the
concentration determined by the method.
Linearity: A stock solution of 1000 μg/mL in
methanol was prepared for each drug, namely, CIP, LEV, MOX, NOR, and OFL. From this stock, working standard solutions were prepared for each of the drugs, in the range of 10 to 60 μg/mL and injected into the HPLC system. It was proved that each drug shows linearity in the range of 10–60 μg/mL. The calibration graph (obtained by plotting peak areas of the drug under consideration versus its concentration) was generated by replicate analysis at all concentration levels, and the linearity of the relationship was established using Microsoft Excel® program.
Robustness and QbD Approach to Designate Critical Attributes: Robustness of the developed
method for selected fluoroquinolones was
confirmed by checking the effect of variation in critical parameters, namely, flow rate, pH and proportion of mobile phase components. ANOVA was applied to statistically prove robustness.
Detection and Quantification Limit: The limit of detection (LOD) and limit of quantification (LOQ) were calculated based on the linearity curve plotted. The formulae used for computing these values were:
LOD = 3.3σ/s LOQ = 10σ/s
Where σ is the standard deviation of the y-intercept of the regression line, and s is the slope of the calibration curve.
RESULTS AND DISCUSSION: Method Development:
Chromatographic Separation: After a number of trials, chromatographic conditions were optimized
and selected based on System Suitability
The optimized chromatographic conditions are
reported in Table 1.
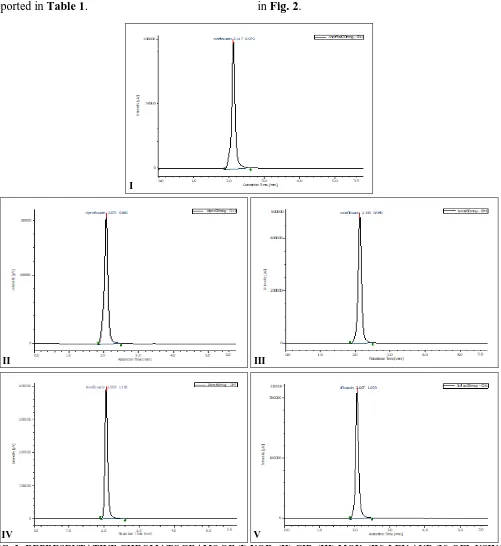
[image:4.612.57.558.69.615.2]Representative HPLC Chromatograms are shown in Fig. 2.
FIG. 2: REPRESENTATIVE CHROMATOGRAMS OF (I) NOR, (II) CIP, (III) MOX, (IV) LEV AND (V) OFL USING C18 COLUMN WITH MOBILE PHASE OF METHANOL AND PHOSPHATE BUFFER, pH 3.0 (70:30) AT 1.25 mL/min AND DETECTION AT 294 nm
[image:4.612.47.564.688.752.2]System Suitability parameters for each drug were checked and are tabulated in Table 2.
TABLE 2: SYSTEM SUITABILITY PARAMETERS
S. no. Parameters Acceptance Criteria CIP LEV MOX NOR OFL
1 Theoretical Plates >1000 2327 3793 2380 2848 4059 2 Tailing factor <2 0.891 0.890 0.877 0.960 0.877 3 RSD of area <2% 0.196 0.390 0.051 0.075 0.067 4 RSD of Ret.Time <1% 0.197 0.197 0.280 0.017 0.156
I
II III
Calibration Curve: The correlation coefficients
(R2) for each of the three drugs under consideration
and also the linearity equations are displayed in
Table 3.
Method Validation: The method was validated and applied to marketed formulations. The results
are reported in Table 4.
TABLE 3: CORRELATION COEFFICIENTS AND LINEARITY EQUATIONS
S. no. Drug R2 Linearity equation
1 CIP 0.999 y = 852.1x + 2198 2 LEV 0.999 y = 69819x + 134352 3 MOX 0.999 y = 66363x + 97550 4 NOR 0.999 y = 36901x + 1747.1 5 OFL 0.999 y = 62185x + 10414
TABLE 4: VALIDATION RESULTS
CIP LEV MOX NOR OFL
Linearity range(µg/ml) 10-60 10-60 10-60 10-60 10-60
LOD(µg/ml) 1.79 1.57 1.57 0.799 1.39
LOQ(µg/ml) 5.96 5.24 5.22 2.667 4.64
Precision Complies Complies Complies Complies Complies Assay (Limits 90-110%) * 100.05% 104.19% 103.17% 106.75% 98.004% Accuracy 101-102% 95-101% 96-102% 102-105% 96-105% Robustness** Complies Complies Complies Complies Complies *Performed on marketed formulations; **Proved through the application of ANOVA
TABLE 5: CRITICAL ATTRIBUTES AND RANGES ANALYSED
S. no. Critical Attribute Value Range
1 % of Methanol 70% 68-72%
2 pH of Buffer 3.0 2.8-3.2
3 Flow Rate 1.25ml/min 1.05-1.45ml/min
Creation of Design Space for Critical Attributes through QbD:
Identification of Critical Attributes and their Range: The critical attributes in designing a robust and easily transferrable method were identified and
tested over ranges, as shown in Table 5.
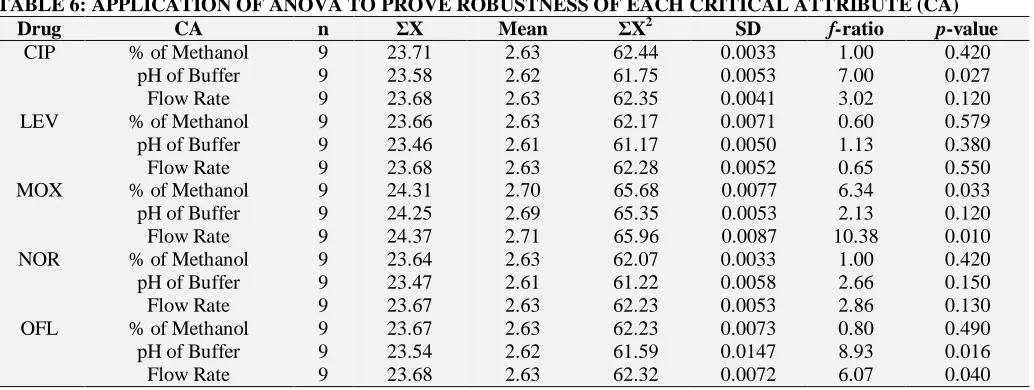
Application of ANOVA to Creation of Design Space: Application of statistical analysis in the form of ANOVA proved the method to be robust and helped create a Design Space for each critical
parameter as enlisted in Table 6.
[image:5.612.50.567.470.665.2]The f- ratio shows that there is no significant difference in results of the method if one works within the Design Space studied, thus displaying that method need not be redeveloped and revalidated during transfers.
TABLE 6: APPLICATION OF ANOVA TO PROVE ROBUSTNESS OF EACH CRITICAL ATTRIBUTE (CA)
Drug CA n ƩX Mean ƩX2 SD f-ratio p-value
CIP % of Methanol 9 23.71 2.63 62.44 0.0033 1.00 0.420 pH of Buffer 9 23.58 2.62 61.75 0.0053 7.00 0.027 Flow Rate 9 23.68 2.63 62.35 0.0041 3.02 0.120 LEV % of Methanol 9 23.66 2.63 62.17 0.0071 0.60 0.579
pH of Buffer 9 23.46 2.61 61.17 0.0050 1.13 0.380 Flow Rate 9 23.68 2.63 62.28 0.0052 0.65 0.550 MOX % of Methanol 9 24.31 2.70 65.68 0.0077 6.34 0.033 pH of Buffer 9 24.25 2.69 65.35 0.0053 2.13 0.120 Flow Rate 9 24.37 2.71 65.96 0.0087 10.38 0.010 NOR % of Methanol 9 23.64 2.63 62.07 0.0033 1.00 0.420 pH of Buffer 9 23.47 2.61 61.22 0.0058 2.66 0.150 Flow Rate 9 23.67 2.63 62.23 0.0053 2.86 0.130 OFL % of Methanol 9 23.67 2.63 62.23 0.0073 0.80 0.490 pH of Buffer 9 23.54 2.62 61.59 0.0147 8.93 0.016 Flow Rate 9 23.68 2.63 62.32 0.0072 6.07 0.040 DISCUSSION: In the reported research work, the
RP-HPLC analytical method for the selected fluoroquinolones was developed and validated as per the ICH guidelines. Since all the validation parameters checked were within limits, the method was considered successfully validated.
hypothesis that within this range there is no significant difference in the results, thereby proving that changes within the Design Space do not need revalidation of the method.
CONCLUSION: The developed RP–HPLC
method was found to be suitable for the analysis of selected fluoroquinolones, namely, CIP, LEV, MOX, NOR, and OFL, in bulk form, as well as in marketed formulations like tablets. The method was found to be simple, quick, sensitive,
economical, reliable, and precise. A Design Space
was simultaneously created setting limits for critical attributes affecting the robustness. Any variations in parameters within the Design Space did not affect method performance, making the method easily transferrable without additional expenditure of time or money. This method can, therefore, be useful as a common and easily transferrable method for estimation of any of the selected fluoroquinolones, in bulk form or pharmaceutical dosage forms. This HPLC method will prove to be advantageous for laboratories handling numerous fluoroquinolones, especially since the method may be transferred without the need for revalidation within the Design Space.
ACKNOWLEDGEMENT: The authors are
grateful to the Principal of Goa College of
Pharmacy, for providing the facilities for working
and to Abaris Healthcare Pvt. Ltd., Ahmedabad, Gujarat, India for supplying the pure drugs as gift samples.
CONFLICT OF INTEREST: There is no conflict of interest.
REFERENCES:
1. Sheehan G and Chew NSY: The history of quinolones: Fluoroquinolone Antibiotics. Birkhäuser Basel 2003: 1-10. 2. Hooper DC: New Uses for New and Old Quinolones and the Challenge of Resistance. Cli Inf Dis 2000; 30: 243-54. 3. Murray TS and Baltimore RS: Pediatric uses of
fluoroquinolone antibiotics. Pediatric Annals 2007; 36: 336-42.
4. International Conference of Harmonization of Technical Requirements for Registration of Pharmaceuticals for Human Use, ICH Harmonized Tripartite Guideline, Q8(R2) 2009.
5. Lee SJ, Desta KT, Eum SY, Dartois V, Cho SN, Bae D and Shin SC: Development and validation of LC-ESI-MS/MS method for analysis of moxifloxacin and levofloxacin in the serum of multidrug-resistant tuberculosis patients: potential application as a therapeutic drug monitoring tool in medical diagnosis. Journal of chromatography b: Analytical Technologies in the Biomedical and Life Sciences 2016; 1009-1010: 138-43. 6. Czyrski A, Anusiak K and Teżyk A: The degradation of
levofloxacin in infusions exposed to daylight with an identification of a degradation product with HPLC-MS. Scientific Reports 2019; 9(1): 1-7.
7. Pan Z, Peng J, Chen Y, Zang X, Peng H, Bu L, Xiao H, He Y, Chen F and Chen Y: Simultaneous determination of five fluoroquinolones by the selective high-performance liquid chromatography associating with sensitive resonance light scattering and mechanism study. Microchemical Journal 2018; 136(1): 71-79.
8. Zhou M, Peng J, He R, He Y, Zhang J and Li A: High-Performance Liquid Chromatography coupled with resonance rayleigh scattering for the detection of three fluoroquinolones and mechanism study. Spectrochimica Acta Part A: Molecular and Biomolecular Spectroscopy 2015; 136(B): 1181-87.
9. Sousa J, Alvesb G, Campos G, Fortuna A and Falcão A: First liquid chromatography method for the simultaneous determination of levofloxacin, pazufloxacin, gatifloxacin, moxifloxacin and trovafloxacin in human plasma. Journal of Chromatography B 2013; 930: 104-11.
10. Szerkus O, Jacyna J, Gibas A, Sieczkowski M, Siluk D, Matuszewski M, Kaliszan R and Markuszewski MJ: Robust HPLC–MS/MS method for levofloxacin and ciprofloxacin determination in human prostate tissue. Jou of Pharma and Biomed Analy 2017; 132: 173-83.
11. International Conference of Harmonization of Technical Requirements for Registration of Pharmaceuticals for Human Use, ICH Harmonized Tripartite Guideline, Validation of Analytical Procedures: Text and Methodology Q2 (R1), 2005.
12. Sumithra M, Shanmugasundaram P and Ravichandran V: Quality by design-based optimization and validation of new reverse phase – high - performance liquid chromatography method for simultaneous estimation of levofloxacin hemihydrate and ambroxol hydrochloride in bulk and its pharmaceutical dosage form. Asian Journal of Pharmaceutical and Clinical Research 2016; 9(3): 190-96. 13. Shah P, Pandya T, Gohel M and Thakkar V: Development
and validation of HPLC method for simultaneous estimation of rifampicin and ofloxacin using experimental design. Journal of Taibah University for Science 2019; 13(1): 146-54.
14. Padala A, Kurla VV and Pawar AKM: Quality by Design (Qbd) based Development of a Stability-Indicating RP-HPLC Method for Estimation of Cobicistat in bulk. Int Journal of Pharmaceutical Sci 2018; 9(6): 2589-94. 15. Vanitha C, Reddy B and Satyanarayana SV:
Quality-by-design approach to selective stability indicating RP- HPLC method development and validation for estimation of Sofosbuvir in bulk drug. International Journal of Pharmaceutical Sciences 2018; 9(2): 298-08.
All © 2013 are reserved by International Journal of Pharmaceutical Sciences and Research. This Journal licensed under a Creative Commons Attribution-NonCommercial-ShareAlike 3.0 Unported License.
This article can be downloaded to Android OS based mobile. Scan QR Code using Code/Bar Scanner from your mobile. (Scanners are available on Google Play store)
How to cite this article: