International Research Journal of Natural and Applied Sciences Vol. 3, Issue 10, October 2016 IF- 3.827 ISSN: (2349-4077)
© Associated Asia Research Foundation (AARF)
Website: www.aarf.asia Email : [email protected] , [email protected]
Development and Optimization of Value Added Biscuits Using Response
Surface Methodology
1
Neetu Mishra, 2Vinita Puranik, 3Akansha Prajapati,
4
Devinder Kaur and 5Renu Tripathi
Centre of Food Technology, University of Allahabad, Allahabad, India 211002
ABSTRACT
Ginger (Zingiber officinale) is an important commercial crop belonging to the family
Zingiberaceae grown for its aromatic rhizomes which are used both as spice and medicine. The
herbal therapeutic benefits of ginger are mainly due to the presence of volatile oils.
Consumption of bakery products in the country is increasing day by day and biscuit is commonly
consumed food like bread having several attractive features. In the view of health benefit of
ginger, it may be worthwhile to explore possibility of incorporating ginger extract in wheat flour
for the development of biscuits to provide a convenient food to supplement the diet’s nutrition.
Present study was an effort to standardize the level of ginger extract in formulation for the
development of value added biscuits. To optimize the quantity of butter, sugar and ginger extract
to be added, Response Surface Methodology (RSM) was used, while rest of the ingredient level
was kept constant. The lower and upper limits for butter, sugar and ginger extract were taken as
50-70 g, 25-35 g and 8- 16 ml, respectively. Control treatment was prepared without ginger
extract addition. All 20 combinations and control were subjected for sensory quality evaluation
on a 9 point hedonic scale. From the study, it was found that the biscuit having composition 60 g
butter, 20 g sugar, 12 ml ginger extract per 100 g of biscuits was found optimum and the said
formulation was acceptable and recommended for value added biscuit. The optimized biscuit
was found to be superior in terms of minerals, calcium and iron as compared to control biscuit.
consumption for children and old age people. The addition of ginger extract, also gave an
excellent antioxidant effect on the biscuits compared with control. Addition of natural
antioxidants can increase shelf-life of food products containing fats and oils. It can be
recommended as one of the value added product.
Key words: Biscuits, Gingerol, Oleoresin, Volatile oils, Zingiber officinale,
1. INTRODUCTION
Nutritionally, biscuits can be easily fortified with ginger extract to provide a convenient food to supplement the diet’s nutrition. Since consumption of bakery products in the country is increasing day by day and in the view of above health benefit of ginger it may be worthwhile to explore possibility of incorporating ginger extract in wheat flour. Present study was an effort to standardize the level of ginger extract in formulation for the development of value added biscuits.
2 MATERIALS AND METHODS
Ginger used for this investigation were purchased from the local market.
All required ingredients like as sugar, butter, refined white flour, common salt, baking powder, ammonium, cumin seeds were purchased from local market of Allahabad, India. All the chemicals used in analysis were of (analytical reagent) AR grade obtained from Centre of Food Technology, University of Allahabad. This work was carried out from March to June 2016 at Centre of Food Technology, University of Allahabad, Allahabad, U.P., India.
2.1 Preparation of Aqueous Ginger Extract:
The ginger was washed, drained and then grated with the help of grater and then the aqueous extract is prepared & used to incorporate it in the biscuit preparation, (Francisco BF et al.,2008).
2.2 Development and Optimization of Value Added Biscuits
Biscuits were prepared as per the method of Sai Manohar & Haridas Rao, 1999. Sugar and fat were creamed for 3–4 min in a laboratory mixer. The extracts were blended with the fat and the emulsion was mixed with sugar. Dough water containing sodium and ammonium bicarbonate (1.5 and 3 g), and sodium chloride (3 g) was added to the above cream and mixed for 5 min to obtain a homogenous dough. Refined flour sieved twice with baking powder (0.9 g) was added and mixed for 3 min. The dough was sheeted to a thickness of 3.5 mm and cut into circular shapes using 45-mm cutter and placed on an aluminium tray, baked at 160 0C for 10 min and then allowed to cool. The biscuits were stored in air-tight containers at ambient temperature. To optimize the quantity of butter, sugar and ginger extract to be added, Response Surface Methodology (RSM) was used while rest of the ingredients like refined white flour, common salt, baking powder, ammonium carbonate, cumin seeds level were kept constant on the basis of hit and trial method on the basis of sensory evaluation using 9-point hedonic scale (Murray, J.M. et al., 2001). Response Surface Methodology (RSM) is a collection of statistical and
Telesphore, Q. et al., 2009), for statistical and graphical analysis of the experimental data and also for monitoring the combined effects of variables (Sivakumar, P.S. et al., 2010). The butter (60 g), sugar (30 g), ginger extract (12 ml) was repeated 5 times as central points. The lower and upper limits for butter, sugar and ginger extract were taken as 50-70 g, 25-35 g and 8- 16 ml, respectively. Control treatment was prepared without antioxidant extract addition. All 20 combinations and control was subjected for sensory quality evaluation by 15 trained panelists. The process flow chart is adopted for the preparation of biscuits by using various ingredients like refined white flour, common salt, baking powder, ammonium and cumin seeds by traditional creamery method. The process flow chart for the preparation of biscuit is given in Fig. 1.
Creaming of sugar and butter
Proper mixing of ingredients along with ginger extract in specified proportion of refined wheat flour and dough was made
Biscuit shaped loaves prepared
Kept in oven at 1000 C for 15-20 minutes
Crispy ginger biscuits with brown coating were prepared
Fig. 1 Process flow chart in the preparation of value added biscuits.
2.3 Proximate and Mineral Content Analysis
2.4 Sensory Analysis
To carry out initial optimization of the ingredients of RSM design, the 30 combinations were judged by a trained panel of 15-members using a 9 point hedonic scale (9-like extremely and 1-dislike extremely) for color, flavor, crispiness and mouthfeel. (Sharma et al., 1998).
2.5 Determination of Antioxidant Activity
The antioxidant activities of native and processed raw materials were also measured by the DPPH radical scavenging method (De Ancos, Sgroppo, Plaza, & Cano, 2002). An aliquot (0.10ml) of sample extract in methanol was mixed with 2 ml of methanolic 0.1 mM DPPH solution and the volume is made upto 5 ml with distilled water. The mixture was thoroughly vortex-mixed and kept in dark for 30 min. The absorbance was measured at 515 nm. The result was expressed as percentage of inhibition of the DPPH radical. The percentage of inhibition of the DPPH radical was calculated according to the following equation:
%inhibition of DPPH = [(Abs control-Abs sample)/ (Abs control)] X 100
where, Abs control is the absorbance of the DPPH solution without the extracts.
2.6 Determination of Total Phenol Content
Total polyphenols were estimated as per procedure described by Singleton et al., (1999) using folin ciocalteu method, where 250 mg sample was taken in 10 ml of acetone and water (70:30 v/v) solution in a graduated test tube and heated on water bath at 70oC for 10 min. The sample was brought to room temperature, centrifuged at 3500 rpm for 10 min. The supernatant (0.2 ml) was made up to 10 ml with distilled water. This solution was diluted 10 fold and sample solution (5 ml) was mixed with saturated sodium carbonate (0.5 ml) and Folin-Ciocalteaue reagent (0.2 ml) and made up to 10 ml with distilled water. The absorbance was read at 765 nm after 60 min by UV visible double beam spectrophotometer (Model Evolution 600, Thermo Electron, US).
2.7 Texture Analysis of Optimized Biscuit
2.8 Statistical Analysis
The data obtained were analyzed statistically for analysis of variance (ANOVA) using completely randomized design with least significant difference (LSD) at P < 0.05 using Co.Stat 6.303, CoHort software (USA).
3 RESULTS AND DISCUSSION
3.1 Optimization of Value Added Biscuit
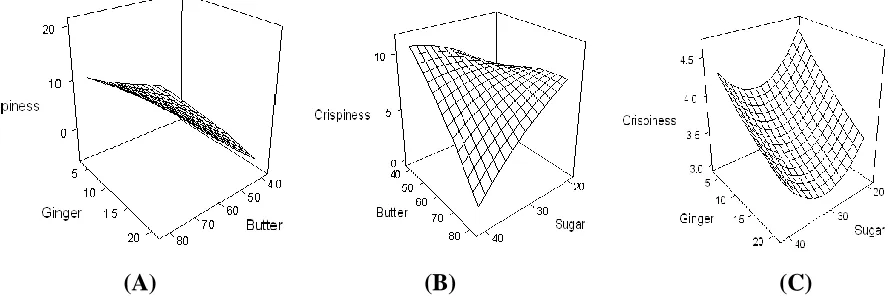
For the optimization of the variables, the responses, colour, flavour, crispiness and mouthfeel were selected. From the anova result in Table 1, there was significant difference found for each variable of sensory attributes at p<0.05. On the basis of that, these responses had direct effect on the quality of biscuits (Puranik, et al., 2013). Butter (Fig. 2) had significant positive (P < 0.05) effect on flavour and interaction between sugar and ginger extract showed positive effect on the flavour (Fig. 2). The interaction between butter to ginger extract showed negative effect on flavor, as we increase the concentration of ginger extract (Fig. 2). With increase in the amount of butter, color response decreases, then increases (Fig. 3). Interaction between sugar and ginger extract to colour had significant negative effect on colour (P < 0.05) (Fig. 3). With increase in the amount of ginger, crispiness slightly decreases then increases (Fig 4). The interactive effect of butter to sugar showed positive effect on crispiness of biscuits (Fig. 4). On increasing the amount of butter, mouth feel increases and when ginger increases, the mouth feel slightly decreases (Fig.5). On increasing sugar, mouth feel decreases and when butter increases mouth feel decreases & then increases (Fig 5). With increase in the amount of butter and sugar, the
mouth feel increases then slightly decreases (Fig.5).
biscuits was found optimum and the said formulation was recommended for preparation of value added biscuit.
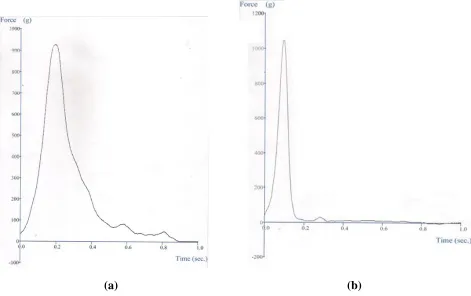
3.2 Texture Analysis of Optimized Biscuit
From the results of texture analysis, the hardness of control biscuit and optimized biscuit was found to be comparatively near to each other i.e. 915 g and 1015 g respectively (Fig. 6). This result can be correlated with the acceptable sensory scores of control and optimized biscuits (crispiness score of 8 & 8.1 respectively).
3.3 Nutritional Evaluation of Optimized Biscuit
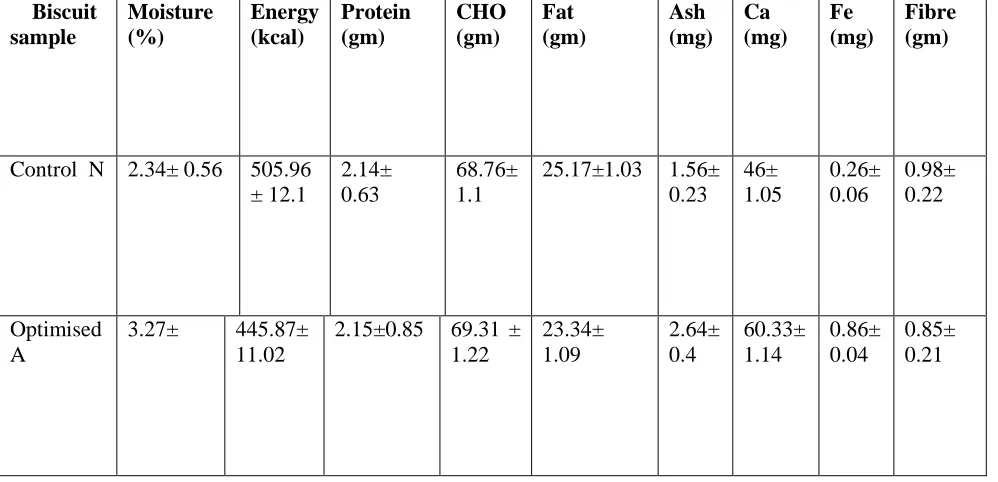
The chemical composition of optimized biscuit regarding moisture, ash, crude fat, crude protein, crude fiber, carbohydrate and mineral contents are presented in (Table 3). The nutritive value of ginger extract incorporated biscuit was significantly higher than that of control. By incorporation of ginger extract, the ash content was increased from 1.56% to 2.64%. The optimized biscuit was found to be superior in terms of minerals, calcium and iron, 60.3 and 0.86 mg/100g respectively as compared to control biscuit (46 & 0.26 mg/100g). The moisture, protein, fat and carbohydrate content was not changed significantly as extract increased in the blends. Since, the biscuit was a good source of calcium and iron (Table 3), hence it can be recommended for consumption for children and old age people.
3.4 Evaluation of Antioxidant Activity
Antioxidant activity in terms of total phenol content and DPPH % radical scavenging activity was found to be 408.92 mgGAE / 100g and 92.81% respectively, for ginger extract incorporated optimized biscuit which was higher than control biscuit (214.09 mgGAE / 100g & 62.11%) (Table 4). The addition of ginger extract, gave an excellent antioxidant effect on the biscuits compared with control. In biscuits, addition of purified extracts of marjoram, mint and basil is reported to have an excellent antioxidant effect compared with the effect of BHA (Bassiouny et al., 1990). The higher efficiency of the ginger extract could be due to the stability of this natural
4. CONCLUSION
TABLE 1 ANOVA Results for Value Added Biscuits
Source Color Flavour Crispiness Mouthfeel
Model SS 0.7975 5.0253 14.491 3.2475
Model DF 3 3 3 3
Mean MS 0.27606 0.63023 1.9504 0.1662
Pure Error 0.5630 0.3413 1.824 1.9941
Mean 6.5 7.5 7 7.5
F Tabulated 0.556 0.210 0.050 0.752
F Calculated 0.73 1.81 3.72 0.8941
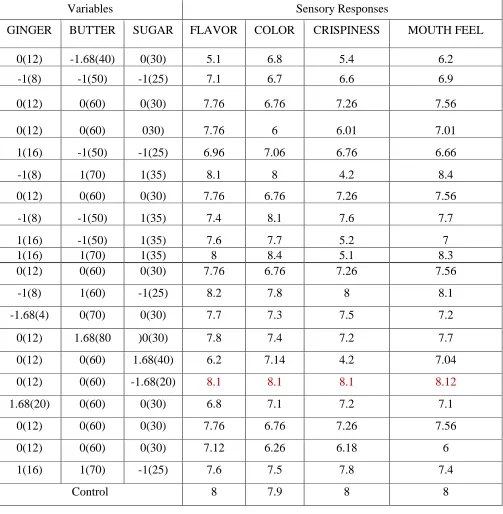
TABLE 2 Effects of Variables on The Sensory Attributes of Developed Ginger Biscuits
0(12) 0(60) 0(30) 7.76 6.76 7.26 7.56
-1(8) 1(60) -1(25) 8.2 7.8 8 8.1
-1.68(4) 0(70) 0(30) 7.7 7.3 7.5 7.2
0(12) 1.68(80 )0(30) 7.8 7.4 7.2 7.7
0(12) 0(60) 1.68(40) 6.2 7.14 4.2 7.04
0(12) 0(60) -1.68(20) 8.1 8.1 8.1 8.12
1.68(20) 0(60) 0(30) 6.8 7.1 7.2 7.1
0(12) 0(60) 0(30) 7.76 6.76 7.26 7.56
0(12) 0(60) 0(30) 7.12 6.26 6.18 6
1(16) 1(70) -1(25) 7.6 7.5 7.8 7.4
Control 8 7.9 8 8
Variables Sensory Responses
GINGER BUTTER SUGAR FLAVOR COLOR CRISPINESS MOUTH FEEL
0(12) -1.68(40) 0(30) 5.1 6.8 5.4 6.2
-1(8) -1(50) -1(25) 7.1 6.7 6.6 6.9
0(12) 0(60) 0(30) 7.76 6.76 7.26 7.56
0(12) 0(60) 030) 7.76 6 6.01 7.01
1(16) -1(50) -1(25) 6.96 7.06 6.76 6.66
-1(8) 1(70) 1(35) 8.1 8 4.2 8.4
0(12) 0(60) 0(30) 7.76 6.76 7.26 7.56
-1(8) -1(50) 1(35) 7.4 8.1 7.6 7.7
1(16) -1(50) 1(35) 7.6 7.7 5.2 7
TABLE 3 Nutritional Composition of Control and Optimised Value Added Biscuits Biscuit sample Moisture (%) Energy (kcal) Protein (gm) CHO (gm) Fat (gm) Ash (mg) Ca (mg) Fe (mg) Fibre (gm)
Control N 2.34± 0.56 505.96 ± 12.1
2.14± 0.63
68.76± 1.1
25.17±1.03 1.56± 0.23 46± 1.05 0.26± 0.06 0.98± 0.22 Optimised A
3.27± 445.87±
11.02
2.15±0.85 69.31 ± 1.22 23.34± 1.09 2.64± 0.4 60.33± 1.14 0.86± 0.04 0.85± 0.21
TABLE 4 Antioxidant Activity of Control and Optimized Value Added Biscuits
BISCUIT SAMPLE TPC
(MG GAE/100 GM)
DPPH (%)
CONTROL N 214.09± 10.05 62.11± 1.57
[image:11.612.68.551.384.552.2](A) (B) (C)
FIG. 2 Response Surface and Counter Plots Showing Effects of Variable on the Flavor Of
Value Added Biscuit, (A) Ginger Vs. Sugar, (B) Butter Vs. Sugar, (C) Ginger Vs. Butter
[image:12.612.74.528.276.412.2]
(A) (B) (C)
FIG. 3 Response Surface and Counter Plots Showing Effects of Variable on the Colour Of
Value Added Biscuit, (A) Ginger Vs. Sugar, (B) Butter Vs. Sugar, (C) Ginger Vs. Butter
(A) (B) (C)
FIG. 4 Response Surface and Counter Plots Showing Effects of Variable on the Crispiness
[image:12.612.86.531.480.628.2](A) (B) (C)
FIG. 5 Response Surface and Counter Plots Showing Effects of Variable on the Mouthfeel
of Value Added Biscuit, (A) Ginger Vs. Sugar, (B) Butter Vs. Sugar, (C) Ginger Vs. Butter
(a) (b)
FIG. 6 Effects of Variables on the Texture of Biscuits: (a) Control Biscuit and (b)
[image:13.612.67.538.271.567.2]ACKNOWLEDGMENT
The authors are thankful to Centre of Food Technology, University of Allahabad, Allahabad India, for providing necessary facilities for the research work.
REFERENCES
1. AOAC, 1990. Officials Methods of Analysis of Association of Analytic Chemists, 15th ed., Washington DC, U.S.A.
2. AOAC, 1997. Officials Methods of Analysis of Association of Analytic Chemists, Washington DC, U.S.A.
3. Badreldin, H., et al., 2008. Some phytochemical, pharmacological and toxicological properties of ginger (Zingiber officinale Roscoe): A review of recent research. Food and Chemical Toxicology 46; 409–420.
4. Bassiouny, S. S., Hassanien, F. R., El-Razik Ali, F., and El-Kayati, S. M. 1990. Efficiency of antioxidants from natural sources in bakery products. Food Chemistry, 37, 297–305.
5. Bhattarai, S., Tran VH, and Duke CC. 2001. The stability of gingerol and shogaol in aqueous solutions. J Pharm Sci.;90 (10):1658-64.
6. Chrubasik, S., pittler MH, et al. 2005. Zingibaris rhizome: a comprehensive review on the ginger. Phytomedicine, 12(9):684-701.
7. De - Ancos B, Sgroppo S, Plaza L. and Cano MP. 2002. Possible nutritional and health-related value promotion in orange juice preserved by high-pressure treatment. Journal of the Science of Food and Agriculture, 82: 790–796.
8. Francisco C., et al., 2008. Alterations in behavior and memory induced by the essential oil of Zingiber officinale Roscoe (ginger) in mice are cholinergic-dependent, Journal of medicinal plant research, Vol.2(7), pp. 163-170.
9. Lal, G., Siddappa G.S., Tandon G.L. 2010. Chutneys, Sauces and Pickles, Preservation of Fruits and Vegetables, ICAR Publication, New Delhi, pp. 235-269.
10. Murray, J.M., Delahunty C.M., Baxter I.A. 2001 Descriptive sensory analysis: past, present, future, Food Res. Int. 34, 471-641.
12. Sivakumar, P.S., Panda S.H., Ray R.C., Naskar S.K., and Bharathi L.K., 2010. Consumer acceptance of lactic acid fermented pickle, J. Sensory Stud. 25 706-719.
13. Philip John Kanu, Zhou H.M., Baby K. J., Zhu K.X., Zhu K.R., and Qian H.F., 2007. The use of response surface methodology in predicting sesame (Sesamum indicum L.) protein extractability with water and the analysis of the protein extracted for it amino acid
profile, Biotechnology 6 447-455.
14. Manohar Sai, R., & Haridas Rao, P. 1999. Effect of emulsifiers, fat level and type on the rheological characteristics of biscuit dough and quality of biscuits. Journal of Science of Food and Agriculture, 79, 1223–1231.
15. Sharma, G.K., Padmashri, A. And Bawa, A.S. 2003. Baked Products- A global Scenario.Proc Food Ind,14-24.
16. Vernon L. Singleton, et al., 1999. Analysis of total phenols and other oxidation substrates and antioxidants by means of folin-ciocalteu reagent. Methods in Enzymology, Volume 299, 1999, Pages 152–178.
17. Thomson, M., et al., 2002. The use of ginger (Zingiber officinale Rosc.) As a potential anti-inflammatory and antithrombotic agent. Prostaglandins Leukot Essent Fatty Acids.67(6):475-8.
18. Puranik, V., Chauhan, D. K., and Mishra,V., 2013. Development of herbal functional RTS beverage, International Journal of Biotechnology Research, Vol. 1(3), pp. 028-037, April 2013.