International Research Journal of Natural and Applied Sciences Vol. 3, Issue 7, July 2016 IF- 3.827 ISSN: (2349-4077)
© Associated Asia Research Foundation (AARF)
Website: www.aarf.asiaEmail : [email protected] , [email protected]
GENETIC DIVERSITY FOR YIELD AND ITS COMPONENTS IN
BLACKGRAM
Y. Pushpa Reni, J. Sateesh Babu and M.V. Ramana
Regional Agricultural Research Station, Lam, Guntur-522034, A.P
ABSTRACT
Multivariate analysis by D2 statistic is a powerful tool in quantifying the degree of
divergence among all possible pairs of population at genotypic level. The availability of
genetically diverse germplasm is the basic need for the progress in plant breeding. Choice of
parents for hybridization is one of the important considerations for creating new variability.
Several biometrical approaches have been shown to be useful in selecting parents for successful
hybridization programmes. D2 analysis has been found most effective and, therefore, widely used
for the classification of parental lines. The present study was therefore, undertaken to estimate
the amount of genetic diversity in twenty five genotypes of black gram (Vigna mungo L.) and to
identify genetic diverse parents for hybridization programme aimed at yield improvement in this
crop. Twenty five genotypes of blackgram (Vigna mungo (L.) comprising released varieties and
landraces were analysed during rabi 2015 for genetic diversity using Mahalanobis D2 stastistic
based on six characters. The genotypes were grouped into 6 clusters. Group IV had maximum
number of genotypes (6) followed by III and V with 5 genotypes each. Maximum intercluster
divergence was found between V and VI. The intercluster distances were greater than intra
cluster distances revealing that considerable amount of genetic diversity existed among the
accessions. Pods per plant, days to 50% flowering and branches per plant were major traits
causing genetic divergence among accessions. Cluster IV has more number of pods per plant
of branches per plant and more number of pods per plant. The genotypes belong to cluster V and
VI has highest intercluster distance and can be used for hybridization programme.
INTRODUCTION :
Blackgram (Vigna mungo L.Hepper, 2n=22) is one of the nutritious pulse crop. Popularly known
as urdbean. It is important short duration pulse crop and self pollinated grain legume grown in
many parts of India. This crop is grown in cropping systems as mixed crop, catch crop,
sequential crop besides growing as sole crop under residual moisture conditions after the harvest
of rice and also before and after the harvest of other summer crops under semi irrigated and
dryland conditions. Its seeds are highly nutritious with protein (25-26%), carbohydrates (60%),
fat (1.5%), minerals, amino acids and vitamins. Like other pulses it also enriches the soil fertility,
improves the soil structure and used as green fodder for cattle. Blackgram is one of the important
pulse crops of India contributing 12 per cent of the total pulse production of the country.Inspite
of its importance, the productivity of the crop is relatively low. The development of new
varieties depends largely on the availability of genetic variability in the base material and the
extend of variability for the desired character. The information about the nature and magnitude
of genetic divergence is essential for selection of diverse parents which upon hybridization lead
to a wide spectrum of recombinations. Mahalanobis’s D2
statistics is very sensitive tool for
measuring genetic divergence based on quantitative traits and also widely used by many breeders
for section of divergent parents for hybridization programme. The importance of genetic
diversity of parents in hybridization programme has been much emphasized (Joshi and
Dhawan,1960 and Murthy and Arunachalam,1966). Genetically diverse parents are likely to
produce not only high heterotic effect but also desirable segregants. Therefore , the present
investigation to study the genetic divergence in blackgram is to suggest suitable genotypes for
use in future breeding programme.
MATERIALS AND METHODS
The material under investigation consisted of twenty five genotypes of blackgram (Vigna mungo
L.Hepper) were grown in Rabi 2014-15 and evaluated in a randomized block design with three
replications at Regional Agricultural Research Station, Lam, Guntur , Andhrapradesh. The
were sown and later, thinned out to a single seedling per hill. All the recommended package of
practices were followed for raising healthy crop. Five plants were tagged randomly for recording
observations in each replication for the characters , plant height, days to 50% flowering, number
of branches per plant, number of pods per plant, hundred seed weight and seed yield per hectare
were used for stastistical analysis. Mahalanobis’s D2 (Mahalanobis,1936) statistics and grouped
into different clusters following Tocher’s method as described by Rao (1952).Average intra and
inter cluster distances were determined Using GENRES version 3.11,1994 Pascal Intl. Software
as suggested by Singh and Chaudhary (1977).
RESULTS AND DISCUS SIONS
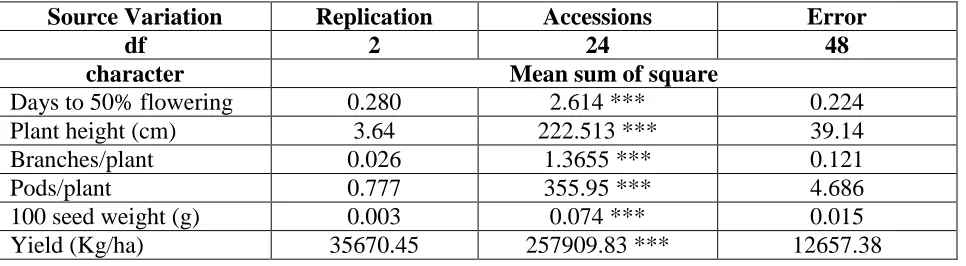
The analysis of variance for randomized block design revealed highly significant differences
among accessions for all the characters under investigation thereby indicating the presence of a
presence of a considerable magnitude of genetic variability among 25 accessions of blackgram
for these characters (Table-1)
The multivariate analysis giving the D2 values between 25 accessions, all these entries can be
grouped into six clusters (Table-2). On the basis of divergence 25 genotypes under investigation
have been grouped into six distinct clusters (Table 2), indicating wide diversity in the
experimental materials for majority of the characters. Distance between all pairs of genotypes
was calculated using squared Euclidean distance method and the genotypes were clustered based
on Tocher's method. Cluster IV had maximum 6 genotypes (6) followed by cluster III and V1
which has 5 each, followed by cluster II which has 4 genotypes followed by cluster I which has
3 genotypes and cluster VI has digenotypic. The pattern of clustering proved the existences of
significant amount of variability. It is obvious that the genotypes have grouped into different
cluster irrespective of their geographical origins. It means that the genetic constitution of the
varieties was more important than their origin and origin and distribution (Rai et al., 2009). The
divergence within the cluster indicates the divergence among the genotypes in the same cluster.
On the other hand inter cluster divergence suggests the distance (divergence) between the
genotypes of different 2 clusters. Inter and intra cluster D2 values were worked out from
divergence analysis. Critical assessment of clusters showed that clusters were heterogeneous
The lower D2 value between their characters suggested that the genetic constituents of these
genotypes in one cluster were in close proximity with those genotypes in other cluster. Similar
result was reported earlier by Gadakh et.al.(2013).
The composition of cluster and values of inter and intra cluster distances are given in Table 3 and
Fig.1. The inter cluster distance were greater than the intra cluster distance revealing that
significant amount of diversity existed among the accession. The intra cluster distance ranged
from 0.000 to 14.343 and the inter cluster distance ranged from 10.145 to 113.676 indicating that
the land races were divergent (Table 3). The minimum intra cluster distance was recorded in
cluster I (4.705) followed by cluster II (10.210). Cluster V had highest (14.343) intra cluster
distance. The genotypes within the cluster were less divergent. The maximum inter cluster
distance was observed between cluster V and VI (113.676) followed by cluster III and V
(86.881). The inter cluster distance between cluster VI with rest of the cluster were more,
suggesting that the land race LBG 752 belonging to this cluster may be used as a parent for
further hybridization programme to develop desirable type because divergent parents results in
transgressive segregants. Least inter cluster distance was recorded between cluster I and
IV(10.145) followed by clusters I and II (19.536).
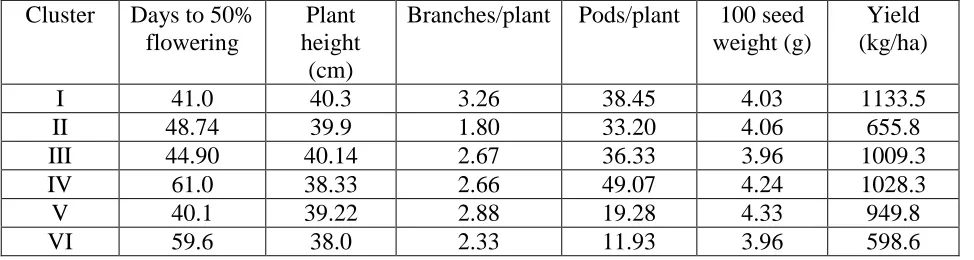
The cluster mean values were estimated over genotypes for 6 yield attributing characters in black
gram related to yield, which revealed that a wide range of variation (Table 4). Minimum days to
50% flowering was observed in genotype of cluster V followed by cluster I. A maximum day to
50% flowering was recorded in cluster IV. Highest mean value for plant height was recorded
with cluster I. Cluster VI had lowest mean value for plant height. Number of primary branches
plant was was more with the genotypes of cluster I. The maximum number of pods per plant
was observed in cluster IV followed by cluster I. The maximum 100 seed weight was observed
in cluster V and yield were more in genotypes of recorded in cluster I. The characters
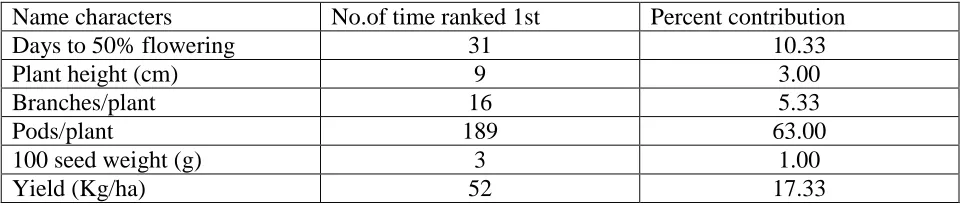
contributing maximum divergence needs greater emphasis for deciding on the clusters for the
purpose of selection of parents in the respective cluster for hybridization. The number of times
each of the yield component characters appeared first in rank and its respective percent
contribution towards genetic divergence was presented in Table 5. Among the yield attributing
traits the maximum contribution towards divergence was made by pods per plant (63%) followed
clusters having high means for desired characters and with maximum divergence may be
successfully used in hybridization programmes.
Promising genotypes from each cluster for specific traits which can be further utilized in
breeding programme are presented in Table 5. From the above study it can be concluded the
diversity in blackgram genotypes for yield and yield attributing characters may be due to early
maturity, number of cluster/plant, pod/plant, seed/pod, pod length and 100 seed weight results
are similar with the reports of Pariya et al., 1997, Singh et al. 2012 and Ali et al. 2008. The
pattern of distribution of genotypes into various clusters indicates that geographical diversity
having no parallelism with clustering pattern which was in agreement with earlier reports in
black gram (Ganesh Ram et al. 1997; Sagar. et al. 2001). The genotypes belonging to different
clusters having maximum divergence can be successfully utilized in hybridization programmes
to get desirable transgressive segregants. It is assumed that maximum amount of heterosis will be
manifested in cross combinations involving the parents belonging to most divergent clusters
(Panigrahi et al. 2014). However, for a practical plant breeder, the objective is not only high
heterosis but also to achieve high level of production. To improve any particular trait donor for
hybridization could be chosen from an appropriate cluster and that should be utilized in breeding
[image:5.612.67.550.449.582.2]programme.
Table :1 Analysis of variance for yield and yield attributing characters of 25 blackgram genotypes during rabi 2015.
Source Variation Replication Accessions Error
df 2 24 48
character Mean sum of square
Days to 50% flowering 0.280 2.614 *** 0.224
Plant height (cm) 3.64 222.513 *** 39.14
Branches/plant 0.026 1.3655 *** 0.121
Pods/plant 0.777 355.95 *** 4.686
100 seed weight (g) 0.003 0.074 *** 0.015
Table 2 : Distribution of blackgram genotypes in 6 clusters
Cluster Number
No.of consisting genotypes
Name of Genotypes
I 3 IPU2-43,Vamban 7,TU 94-2
II 4 TU 67,DKU 11,NDUK 13-4,NDUK 13-6
III 5 PU-11-14,IU02-13,NUL 244,AKU-11-8,AK 10-6
IV 6 MU 44, LBG 791,KU 13-01,MU 06,VBG 11-31,VBG 11-016
V 5 COBG 10-6,SBC 47,KUG 715,PU 0937,KU 96-7
VI 2 LBG 752,LBG 623
Table 3: Intra and inter cluster average divergence (D2 values) among eight clusters involving of 25 blackgram genotypes (Tocher Method)
Clustert I II III IV V VI
I 4.705 19.536 38.414 10.145 19.917 67.85
II 10.210 30.963 18.667 38.285 44.378
III 12.834 36.081 86.881 21.026
IV 0.000 24.752 49.518
V 14.343 113.676
VI 0.000
Table 4: Cluster means involving 25 blackgram genotypes in respect of 6 clusters (Tocher Method)
Cluster Days to 50%
flowering
Plant height
(cm)
Branches/plant Pods/plant 100 seed
weight (g)
Yield (kg/ha)
I 41.0 40.3 3.26 38.45 4.03 1133.5
II 48.74 39.9 1.80 33.20 4.06 655.8
III 44.90 40.14 2.67 36.33 3.96 1009.3
IV 61.0 38.33 2.66 49.07 4.24 1028.3
V 40.1 39.22 2.88 19.28 4.33 949.8
[image:6.612.66.553.426.556.2]Table 5: Percent Contribution of different characters towards diversity in blackgram genotypes
Name characters No.of time ranked 1st Percent contribution
Days to 50% flowering 31 10.33
Plant height (cm) 9 3.00
Branches/plant 16 5.33
Pods/plant 189 63.00
100 seed weight (g) 3 1.00
Yield (Kg/ha) 52 17.33
REFERENCES
Ali, M.N., Gupta, S., Bhattacharyya, S. and Sarkar, H. K. 2008.Evaluation of blackgram (Vigna mungo (L.) Hepper) germplasm using multivariate analysis. Environ. and Ecol., 26(2A):943-945.
Gadakh, S.S., Dethe, A.M., Kathale, M.N. and Kahate, N.S. 2013. Genetic diversity for field and its component traits in green gram [ Vigria radiata(L.)
Ganesh Ram, S., Rajkumar, R., Gomathi, N. and Rathnaswamy, R. 1997. Variability and association of analysis yield components in green gram. Madras Agrl. J., 85: 188-198.
Joshi, A. B., and Dhawan, N. L.1966 “Genetic improvement of yield with special reference to self- fertilizing crops,” Indian Journal of Genetics and Plant Breeding, vol. 26, pp. 101–113, 1966.
Mahalanobis, P.C. 1936. On the generalized distance in statistics.Proc. Nat. Acad. Sci. India., 2: 49-55.
Murthy B.R. and V. Arunachalam. 1966. The nature of divergence in relation to breeding system in some crop plants. Indian J. of Genetics and Plant Breeding. 26A: 188-198.
Panigrahi, K. K. and Baisakh, B. 2014. Genetic diversity assessment for yield contributing characters of green gram [Vigna radiata (L.) Wilczek] cultivars from Odisha. Environ. & Ecol., 32 (1A): 294-297.
Pariya, M.B., Pandya, H.M. and Dhameliya, H.R. 1997. Genetic divergence in blackgram. Gujarat Agril. Res. J. 22: 13-17.
Rai, N., Asati, B. S. and Singh, A. K. 2009. Genetic divergence in Indian bean. Legume Res. 32(2): 166-172.
Rao, C. R. (1952) Advanced Statistical Methods in Biometric Research. John Wiley and Sons Inc., New York., pp.130-3.
Singh, R.K., and Chaudhary, B.D. 1977. Biometrical Methods in Quantitative Genetic Analysis. New Delhi. Kalyani Publication.,: pp. 318.