3937
DECISION MAKING IN THE INDONESIAN STOCK
EXCHANGE USING A FUZZY LOGIC METHOD
1ZUHERMAN RUSTAM, 2AINI SURI TALITA, 3LINTANG A.M. PERTIWI
1,3 Department of Mathematics, Faculty of Mathematics and Natural Sciences, University of Indonesia,
DEPOK, INDONESIA
2 Faculty of Computer Science and Information Technology, Gunadarma University, DEPOK,
INDONESIA
E-mail: 1[email protected], 2[email protected]
ABSTRACT
Defining the best strategy to trade stocks is difficult, especially on the Indonesian stock exchange. A small mistake can lead to a huge loss. Investors analyze stock behavior of targeted companies to make decisions to buy, sell, and hold. Various technical analysis methods use a combination of chart indicators to make these decisions. This study proposes combining four existing indicators with fuzzy logic to create a method for predicting the appropriate action for a stock. This method will use the Moving Average Convergence/Divergence (MACD), the Relative Strength Index (RSI), the Stochastic Oscillator (SO), and the On-Balance Volume (OBV) indicators to recommend a buy, sell or hold decision to an investor. This experiment used two Indonesian companies to test the accuracy of the algorithm. Based on 2014 data, using the fuzzy logic method, accuracy of the algorithm reached 66.67% and 75% for the two companies.
Keywords: Fuzzy Logic, Stock, Moving Average Convergence/Divergence, Relative Strength Index, Stochastic Oscillator
1. INTRODUCTION
Investing has always been a popular method of fulfilling current needs and maintaining a standard of living during retirement. In economics, business investment refers to the purchase of a physical asset, such as buildings, equipment, or inventory. It can also refer to an individual's purchase of a new home [1]. No longer just about gold or property, investing now includes company stocks that can earn large profits. Stocks are securities or certificates representing fractional company ownership and can be purchased as an investment [2]. In Indonesia, the place that provides stock trading is called Indonesia Stock Exchange (IDX).
On buy and selling activity of stocks or usually called trading, the parties involved are companies registered on the Indonesia Stock Exchange, potential investors, and brokers. Stockbroker is a firm or individual entity that role as a representative or intermediary on stock exchanging for the
investors so that the investors might able to have a transaction online and real time. Investors sometimes asked for a help on stock analyst to decide which stock that potentially earn a good benefit before conducting some transaction represented by the broker. Stock analyst will analyze the stock exchange condition before give their advice to their clients. They might be use some scientific method to decide which stock that reccomended to be bought or sold.
3938 analysis has various indicators that can be used as tools to predict stock's price. Some of the technical analysis indicators used by traders are the Moving Average Convergence/Divergence (MACD), the Relative Strength Index (RSI), the Stochastics Oscillator (SO), the On-Balance Volume (OBV) indicator.
Fuzzy logic is a multivalued extension of Boolean logic based on the fuzzy set theory on which truth values are extended from the endpoints of the interval [0, 1] to a range through the entire interval [3]. In other research using fuzzy logic for stock trading, a combination of technical indicators is used to recommend market entry and investment amount [4]. There are several research that also implementing fuzzy concept as in Fuzzy method on classification problems, for example [5] use Fuzzy Kernel K-medoids to classify several classification benchmark dataset. While at [6], Karayiannis and Bezdek discuss about Fuzzy Learning Vector Quantitation and they also propose a new concept to choose different fuziness degree on each iteration at the classiffier. On [7], Rustam and Talita use Fuzzy Kernel k-medoids on security problem, involving anomaly detection problem. In this paper, fuzzy logic will be used with MACD, RSI, SO, and OBV to determine a trade decision of buy, sell or hold. On this paper, we choose our experimental data based on LQ 45 index which is a regular index published by Indonesia Stock Exchange every six months with periods February-July and August-January. Some of the company criteria to be included on the LQ 45 index are:
The company must be in the top 60 rank on the total stock exchange on regular market (average transactions value for the last six months).
Rank based on market capitalization.
Registered on Indonesia Stock Exchange minimal three months respectively.
Have a good monetary condition with a positive prospect of growth.
The stocks on LQ 45 will be monitored for evaluation every six months. It is possible for a included stock to be left out of the list if it fails to fulfilled the requirement. The company data that was used to test the algorithm is listed in the IDX.
2. FUZZY SYSTEM MEMBERSHIP FUNCTION
Fuzzy set is a set that each element on it have a membership value between 0 and 1. Membership function of a fuzzy set map each object on the universe into a space that assumed as a unit interval. If 𝑋 define a set which member is 𝑥, then fuzzy set 𝐴 on 𝑋 represented by ordered pair, 𝐴
𝑥, 𝜇 𝑥 |𝑥 ∈ 𝑋 .
It was introduced first by Lotfi A. Zadeh on 1965. He defined fuzzy logic as a system with a logic as approximate reasoning. Approximate reasoning is a process aim to build a imprecise possible conclusion from chaning premises. Fuzzy logic works by fuzzy inference system.
Fuzzy Inference System (FIS) is a computation system that works based on fuzzy logic principal that is to process input value into output value. In practice, Fuzzy inference system can be divided into 3 steps, fuzzification, inference rules, and final step the inverse transformation of fuzzification which is defuzzification.
On fuzzification, numerical variable or the input will be transformed into fizzy variable known as linguistic variable. On this step, the input in crisp data form will be transformed into fuzzy set form. Other than that, on this step we also determine the membership function that will be used and also deciding the values of the parameters on the membership function.
The membership function is used for mapping the elements from domain to the membership value or degree of membership between 0,1 [8].
On inference rules, we set a rules regarding every input to get an output. In general, the rules infolfing implication If-Then rules. There are two types known in general about inference rules, but on this paper we use Mamdani rules, where the general form is:
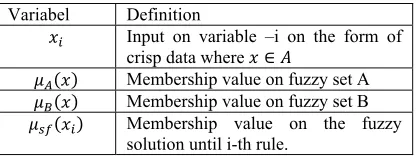
[image:2.612.315.524.633.712.2]IF 𝑥 is 𝐴 AND…AND 𝑥 is 𝐴 THEN y is B Where 𝐴 , 𝐴 , … , 𝐴 and 𝐵 is a fuzzy set with 𝑥 and 𝑦 as scalars. The variables used on Mamdani rules gives on Table 1.
Table 1: Variables on Mamdani Rules
Variabel Definition
𝑥 Input on variable –i on the form of crisp data where 𝑥 ∈ 𝐴
𝜇 𝑥 Membership value on fuzzy set A
𝜇 𝑥 Membership value on fuzzy set B
𝜇 𝑥 Membership value on the fuzzy
3939
𝜇 𝑥 Membership value of fuzzy
consequent until i-th rule.
The last step on FIS is defuzzification that is a process to transform linguistic variable into numerical variable. There are several defuzzification methods, in this paper we use Center of Area Method.
Crisp solution was computed by taking the center (z*) from domain of the fuzzy which is 𝜇 𝑧 .
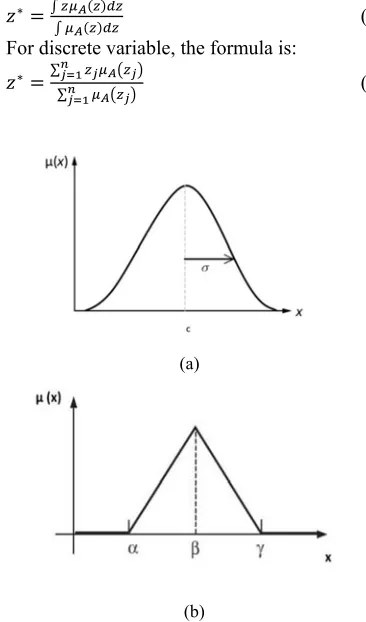
For continuous variable, the formula is:
𝑧∗ (1)
For discrete variable, the formula is: 𝑧∗ ∑
∑ (2)
Figure 1 : Membership Function of Fuzzy Logic
From Figure 1, there are two types of membership functions that will be used in this paper:
(a) Gaussian Membership Function for the inputs, where 𝑐 is middle point of the interval, and 𝜎 is a curve’s width as shown in Eq. (3).
𝑔𝑎𝑢𝑠𝑠𝑖𝑎𝑛 𝑥; 𝑐, 𝜎 𝑒 (3)
(b) Triangular Membership Function for the output is shown in Eq. (4).
𝑡𝑟𝑖𝑎𝑛𝑔𝑢𝑙𝑎𝑟 𝑥; 𝛼, 𝛽, 𝛾
⎩ ⎪ ⎨ ⎪
⎧ 0, 𝑥, 𝛼 𝛼𝑥 𝛽
, 𝛽 𝑥 𝛾
0, 𝑥 𝛾
(4)
3. FUZZY SET OPERATOR AND FUZZY INFERENCE SYSTEM FUNCTIONS
A fuzzy set operator defines a combination of two or more fuzzy sets. An operator that is used in this paper is the intersection of fuzzy sets, with the ‘𝑎𝑛𝑑’ operator. The intersection of two fuzzy sets 𝐴 and 𝐵 is the fuzzy set 𝐶, written as 𝐶 𝐴 ∩ 𝐵 or 𝐶 𝐴 𝑎𝑛𝑑 𝐵 [8], whose membership function is related to those of 𝐴 and 𝐵 by Eq. (5).
𝜇 𝑥 min 𝜇 𝑥 , 𝜇 𝑥 (5)
Following Mamdani Fuzzy Models, fuzzy logic works by a system called the fuzzy inference system (FIS), that process an input to become an output. There are three steps in FIS [8]:
[image:3.612.105.288.221.532.2]Step 1, Fuzzification, takes the numeric variable or input and converts it to a fuzzy variable or linguistic variable. The membership function is determined in this step. Tables 2–5 define the fuzzification process for the input where 𝑑 is distance or dissimilarity function. And 𝑚 ∈ 1, ∞ is the fuzziness degree for cluster partition.
Table 2: Fuzzification for MACD
Numeric Variable
Fuzzy Variable
Membership function
0 𝑥 5 LOW 𝜇 𝑥
exp 1
2 𝑥 2.123
5 𝑥 10 HIGH
𝜇 𝑥
exp 1
2
𝑥 10
2.123
On practice with fuzzy logic, MACD defined as two Gaussian forms. Before we compute its membership values, we need to find the parameters values c and 𝜎 first. Since MACD has only two membership function (MF), then the shape of the line MF is area on the right side and half on the left side. Parameter 𝑐 and 𝜎 will be found by triangular MF so that for MACD with range input [0,5] will results in the right side area with the peak point or
(a)
3940 the value of c is 0, inParams (1) = 0 and inParams (2) = 5. Next we will find 𝜎:
𝑟𝑡𝑊𝑎𝑖𝑠𝑡 1 𝑦𝑊𝑎𝑖𝑠𝑡
𝑖𝑛𝑃𝑎𝑟𝑎𝑚𝑠 2 𝑐 𝑐 (6)
𝑟𝑡𝑊𝑎𝑖𝑠𝑡 2.5 (7)
[image:4.612.79.532.44.732.2]𝜎 2.123 (8)
Table 3: Fuzzification for RSI
Numeric Variable
Fuzzy
Variable Membership function
0 𝑥 30 LOW 𝜇 𝑥
exp 1
2 𝑥 10.82
30 𝑥 70 MEDIUM 𝜇 𝑥
exp 1
2
𝑥 50
8.493
70 𝑥
100
HIGH 𝜇 𝑥
exp 1
2
𝑥 100
10.82
RSI as a leading indicator will be defined with three MF, gaussian type. RSI divided into three areas, left, right and the middle. For the right area, the range is (0,30) where c equal to 0, inParams (1) = 0, inParams (2) = 30. Next we will compute the value of 𝜎.
𝑟𝑡𝑊𝑎𝑖𝑠𝑡 1 0.5 30 0 0 15 (9) 𝜎
. 10.82 (10)
While for the mid area, the range is (30,70) and its peak point inParams (1) = 30, inParams (2)=70, so the 𝜎 is:
𝑟𝑡𝑊𝑎𝑖𝑠𝑡 1 0.5 70 50 50
60 (11)
𝜎 . 8.493 (12)
Table 4: Fuzzification for SO
Numeric Variable
Fuzzy
Variable Membership function
0 𝑥
20 LOW
𝜇 𝑥
exp 1
2 𝑥 8.493
20 𝑥
80 MEDIUM
𝜇 𝑥
exp 1
2
𝑥 50
10.82
80 𝑥
100 HIGH
𝜇 𝑥
exp 1
2
𝑥 100
8.493
Similar with RSI, SO will be also defined by three Gaussian MF. Numerical variable of SO will be changed into fuzzy variable and we will find the membership value. The computation of 𝑐, 𝜎 is a bit similar with on SO, but differ in range of its input. For the first area, which is the right side the range is [0, 20) with the peak point is 0, while inParams (2) = 20. SO that we have 𝜎:
𝑟𝑡𝑊𝑎𝑖𝑠𝑡 1 0.5 20 0 0 10 (13)
𝜎 . 8.493 (14)
While for the mid area, the range is (30,70) and its peak point inParams (1) = 30, inParams (2)=70, so the 𝜎 is:
𝑟𝑡𝑊𝑎𝑖𝑠𝑡 1 0.5 70 50 50
60 (15)
𝜎
. 8.493 (16)
Table 5: Fuzzification for OBV
Numeric Variable
Fuzzy
Variable Membership function
0 𝑥 5 LOW 𝜇 𝑥
exp 1
2 𝑥 2.123
5 𝑥
10 HIGH
𝜇 𝑥
exp 1
2
𝑥 10
2.123
After fuzzification, the second step defines a set of rules for each input. The rules are in an ‘If-Then' format, for example:
R01 : If 𝑥 = LOW AND 𝑥 = LOW AND 𝑥 = LOW AND 𝑥 = LOW then 𝑧 𝑧∗.
R02 : If 𝑥 = LOW AND 𝑥 = MEDIUM AND 𝑥 = MEDIUM AND 𝑥 = LOW then 𝑧 𝑧∗.
Previous research has used 9 rules [9], but on this paper there will be 20 rules as defined in Table 7.
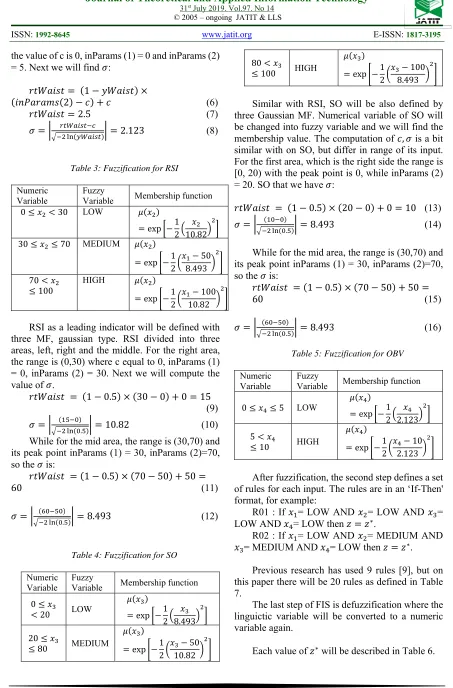
The last step of FIS is defuzzification where the linguictic variable will be converted to a numeric variable again.
3941
Table 6: Classification of Output
z* Reccomendation
0 𝑧 10 SELL
10 𝑧 20 HOLD
20 𝑧 30 BUY
The MACD indicator was first introduced by Gerrad [10]. MACD is calculated by subtracting a 26-day exponential moving average (EMA) of a stock’s price from a 12-day EMA [11]. The result is an indicator that oscillates above and below zero. When the result is above zero, it means a 12-day EMA is higher than a 26-day EMA, and implying a bullish trend (investors expect upward price movement in the stock market). On the other hand, when the result is below zero, a 12-day EMA is less than a 26-day EMA, and implying a bearish trend (the investors expect downward price movement). Besides those two EMA, there is another 9-day EMA as a trigger line to know when to buy or sell.
Table 7: Inference Rules
No. MACD RSI SO
R01 LOW LOW LOW
R02 LOW MEDIUM MEDIUM
R03 LOW MEDIUM HIGH
R04 LOW HIGH MEDIUM
R05 LOW HIGH HIGH
R06 HIGH LOW LOW
R07 HIGH LOW MEDIUM
R08 HIGH MEDIUM MEDIUM
R09 HIGH MEDIUM LOW
R10 HIGH MEDIUM LOW
R11 HIGH MEDIUM MEDIUM
R12 HIGH HIGH HIGH
R13 LOW MEDIUM MEDIUM
R14 LOW HIGH HIGH
R15 HIGH LOW LOW
R16 HIGH MEDIUM MEDIUM
R17 - LOW LOW
R18 - MEDIUM MEDIUM
R19 - HIGH HIGH
R20 - MEDIUM MEDIUM
No. OBV Recommendation
R01 LOW SELL
R02 LOW SELL
R03 LOW SELL
R04 LOW SELL
R05 LOW SELL
R06 HIGH BUY
R07 HIGH BUY
R08 HIGH BUY
R09 LOW HOLD
R10 HIGH BUY
R11 LOW HOLD
R12 HIGH BUY
R13 - HOLD
R14 - SELL
R15 - BUY
R16 - HOLD
R17 HIGH BUY
R18 HIGH HOLD
R19 LOW SELL
R20 LOW HOLD
𝑀𝐴𝐶𝐷 𝐸𝑀𝐴 𝐸𝑀𝐴 (17)
𝑀𝐴
𝐶 𝛼 𝑆𝑀𝐴 1 𝛼 , 𝑖 𝑁
𝐶 𝛼 𝐸𝑀𝐴 1 𝛼 , 𝑖 𝑁 (18)
𝑆𝑀𝐴 ∑ (19)
[image:5.612.91.291.111.160.2]3942 where 𝐸𝑀𝐴 is the exponential moving average of 𝑖-th day and 𝐶 is the close price of 𝑖-th day, for 𝑁 12 and 𝑁 26 [4].
RSI indicates if the market is in an overbought (a security that traders believe is trading above its true value) or oversold condition (a security price fall below its true value). The RSI is most typically used on a 14-day timeframe, and measured on a scale from 0 to 100 [11]. If the RSI is below 30, the market is in the oversold condition, but if the RSI is above 70, the market is in the overbought condition.
𝑅𝑆𝐼 100 (21)
𝑅𝑆 (22)
The variable RS means relative strength, AG is average gaining, and AL is the average loss.
Stochastic Oscillator (SO) compares where a stock’s price closed relative to its price range over a given time period [11]. SO is displayed as two lines. The first line is called %K and the second line is called %D.
%𝐾
%
% %
100
(23)
%𝐷 ∑ % 100 (24)
If SO is above 80, the market is overbought. But if the SO is below 20, the market is oversold.
On-Balance Volume (OBV) relates the company stock price to its volume [11]. Up-volume is a condition when today’s close price is higher than yesterday. Down-volume is a condition when today’s close price is less than yesterday.
𝑂𝐵𝑉 𝑂𝐵𝑉
𝑣𝑜𝑙𝑢𝑚𝑒, 𝑖𝑓 𝑐𝑙𝑜𝑠𝑒 𝑐𝑙𝑜𝑠𝑒 0, 𝑖𝑓 𝑐𝑙𝑜𝑠𝑒 𝑐𝑙𝑜𝑠𝑒 𝑣𝑜𝑙𝑢𝑚𝑒, 𝑖𝑓 𝑐𝑙𝑜𝑠𝑒 𝑐𝑙𝑜𝑠𝑒
(25)
4. RESULTS AND DISCUSSION
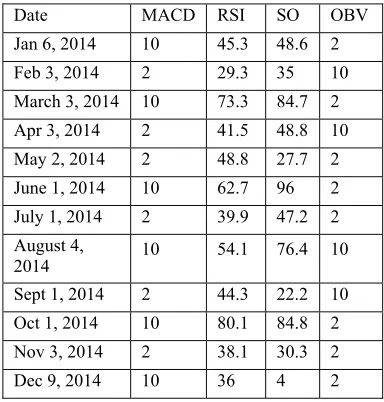
The companies that were used to test the program were PT Media Nusantara Citra Tbk and PT Lippo Karawaci Tbk, and the company stock data for the year 2014 are listed below in Tables 8 and 9, respectively. There are 24 data sets from two
companies; each data set represents the stock technical indicators for the year 2014.
All data using in this paper are available at the following links.
https://finance.yahoo.com/quote/LPKR.JK?p= LPKR.JK&.tsrc=fin-srch
[image:6.612.312.504.236.437.2] https://finance.yahoo.com/quote/MNCN.JK?p= MNCN.JK&.tsrc=fin-srch
Table 8: PT Media Nusantara Citra Tbk Stock Data
Date MACD RSI SO OBV
Jan 6, 2014 10 45.3 48.6 2
Feb 3, 2014 2 29.3 35 10
March 3, 2014 10 73.3 84.7 2
Apr 3, 2014 2 41.5 48.8 10
May 2, 2014 2 48.8 27.7 2
June 1, 2014 10 62.7 96 2
July 1, 2014 2 39.9 47.2 2
August 4,
2014 10 54.1 76.4 10
Sept 1, 2014 2 44.3 22.2 10
Oct 1, 2014 10 80.1 84.8 2
Nov 3, 2014 2 38.1 30.3 2
Dec 9, 2014 10 36 4 2
Table 9: PT Lippo Karawaci Tbk Stock Data
Date MACD RSI SO OBV
Jan 6, 2014 10 22.2 35 2
Feb 3, 2014 2 60 42 2
March 3, 2014 2 52.9 43.1 2
Apr 3, 2014 2 61 42.3 10
May 2, 2014 2 36.6 28.5 10
June 1, 2014 2 42.3 7.3 2
July 1, 2014 2 23.6 18.7 2
August 4, 2014 2 57.3 37.9 10
Sept 1, 2014 2 16.3 7.8 2
Oct 1, 2014 2 28.5 7.1 2
Nov 3, 2014 10 78.1 95.2 10
Dec 9, 2014 2 58.6 37.4 2
[image:6.612.314.517.467.662.2]3943 determined by comparing the resulting recommendation to the open price for seven days following the recommendation date. Figure 2 shows the membership function editor in the Matlab program.
Figure 2 : Membership Function Editor
For example, on February 3, 2014, the stock price from PT Media Nusantara Citra Tbk was at Rp. 2250,00 (US$ 0.16)with MACD at 10, RSI at 29.5, SO at 35, and OBV at 10. In Figure 3(a), the algorithm shows a result of 15.2 to this combination of indicators, recommending Hold for the stock. To confirm this, we compared the result with the close price to the next 7 days. On February 10, 2014, there was no drastic increase in stock price since the price increased by only Rp. 45,00. The candle bar in Figure 3(b) shows a stable stock price. Thus, the recommendation from the system is correct.
Figure 3 : (a) System Result, (b) Candle Bar in Feb 2014
As an example for the computation and steps on fuzzification and the invers process, we choose a historical data from PT. Telekomunikasi Indonesia on September 18th 2014 that was given on the Table
[image:7.612.108.306.163.340.2]10.
Table 10: Numerical Variabel for PT. Telekomunikasi Indonesia
Date August 4th 2014
MACD 10
RSI 81
SO 93
OBV 10
The first step is fuzzification process, on this step input data is a crisp data that will be transformed into fuzzy data.
For MACD
Since the value of 𝑥 10, which is the fuzzy variable of 𝑥 is quite high, then the low fuzzy membership value is 0, while the high fuzzy membership value can be compute by:
𝜇 𝑥 exp 1
2
𝑥 10
2.123
𝜇 10 exp . 1 (26)
For RSI
(a)
[image:7.612.314.440.403.470.2]3944 The fuzzy variable for 𝑥 81 is quite high, with the low and mid fuzzy membership value is 0. For the high fuzzy membership value will be compute as follows.
𝜇 𝑥 exp 1
2
𝑥 100
10.82
𝜇 81 exp . 0.214 (27)
So the high fuzzy membership value for 𝑥 is 0.214.
For SO
The fuzzy variable for 𝑥 93 is quite high, with the low and mid fuzzy membership value is 0. For the high fuzzy membership value will be compute as follows.
𝜇 𝑥 exp 1
2
𝑥 100
8.493
𝜇 93 exp . 0.712 (28)
We have the high fuzzy membership value for 𝑥 is 0.712.
For OBV
For the last component of the input with value is 10, the low fuzzy membership value is 0, while the computation for finding the high fuzzy membership value is given as follow.
𝜇 𝑥 exp 1
2
𝑥 10
2.123
𝜇 10 exp . 1 (29)
The summary for four input variable was given on Table 11.
Table 11: Fuzzy Varible Computation Results
Numerical Fuzzy 𝜇 𝑥
MACD 10 Low 0
High 1
RSI 81 Low 0
Mid 0
High 0.214
SO 93 Low 0
Mid 0
High 0.712
OBV 10 Low 0
High 1
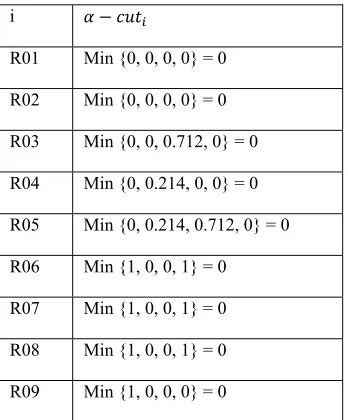
After we successfully compute the fuzzy variable, the next step is inference rules. By using Mamdani rule, the implication function that was used is minimum function that is looking for 𝛼 𝑐𝑢𝑡 for each rules with
𝛼 𝑐𝑢𝑡 min 𝜇 𝑥 , 𝜇 𝑥 , 𝜇 𝑥 , 𝜇 𝑥 for 𝑅01 𝑖 𝑅20.
The system itself consist on several condition, then for the next step we use composite rule with maximum function. One thing that is important to be considered is the domain results from each rule. If there exist two or more results from different domain then domain for 𝜇 𝑧 is results from combining those domains. But if there exist more than one results from the same domain then 𝜇 𝑧 max 𝛼 𝑐𝑢𝑡 .
Table 12: . 𝛼 𝑐𝑢𝑡 Values For Each Rules
i 𝛼 𝑐𝑢𝑡
R01 Min {0, 0, 0, 0} = 0
R02 Min {0, 0, 0, 0} = 0
R03 Min {0, 0, 0.712, 0} = 0
R04 Min {0, 0.214, 0, 0} = 0
R05 Min {0, 0.214, 0.712, 0} = 0
R06 Min {1, 0, 0, 1} = 0
R07 Min {1, 0, 0, 1} = 0
R08 Min {1, 0, 0, 1} = 0
[image:8.612.314.488.492.702.2]3945
R10 Min {1, 0, 0, 1} = 0
R11 Min {1, 0, 0, 0} = 0
R12 Min {1, 0.214, 0.712, 1} = 0.214
R13 Min {0, 0, 0} = 0
R14 Min {0, 0.214, 0.712, 1} = 0
R15 Min {1, 0, 0} = 0
R16 Min {1, 0, 0} = 0
R17 Min { 0, 0, 1} = 0
R18 Min { 0, 0, 1} = 0
R19 Min { 0.214, 0.712, 0} = 0
R20 Min {0, 0, 0} = 0
Based on 𝛼 𝑐𝑢𝑡 computation results on Table 12, there is only one domain that is non zero, which is 𝜋 𝑧 0.214 from R12, where on that rule, the domain is fuzzy variable “buy” with interval [20, 30].
The last step is defuzzification, the invers transformation from fuzzy variable to numerical variable. We use Center of Area (Centroid) with 𝜇 𝑧 0.1427, 20 𝑧 30. The solution z* is computed by formula below.
𝑧∗ .
. 25. (30)
So we have the output for input data MACD = 10, RSI = 81, SO = 93, and OBV = 10 have output 25 that is to recommend “BUY”.
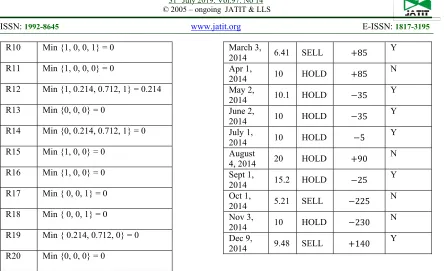
[image:9.612.90.534.52.323.2]The results of analysis for two companies using the following data are summarized in Tables 13 and 14, where Rec means recommendation and Y = Yes, N = No.
Table 13: PT Media Nusantara Citra Tbk Results
Date 𝒛∗ Rec Price
Difference Accurate
Jan 6,
2014 15 HOLD 30
Y
Feb 3,
2014 15.2 HOLD 45
Y
March 3,
2014 6.41 SELL 85
Y
Apr 1,
2014 10 HOLD 85
N
May 2,
2014 10.1 HOLD 35 Y
June 2,
2014 10 HOLD 35 Y
July 1,
2014 10 HOLD 5 Y
August
4, 2014 20 HOLD 90
N
Sept 1,
2014 15.2 HOLD 25
Y
Oct 1,
2014 5.21 SELL 225 N
Nov 3,
2014 10 HOLD 230 N
Dec 9,
[image:9.612.314.524.349.627.2]2014 9.48 SELL 140 Y
Table 14: . PT Lippo Karawaci Tbk Results
Date 𝒛∗ Rec Price
Difference Accurate
Jan 6,
2014 16.4 HOLD 10 Y
Feb 3,
2014 10 HOLD 10
Y
March
3, 2014 10 SELL 95
Y
Apr 1,
2014 15 HOLD 110
N
May 2,
2014 15.2 HOLD 15 Y
June 2,
2014 16.6 HOLD 10 Y
July 1,
2014 6.04 SELL 100
Y
August
4, 2014 15 HOLD
+50
Y
Sept 1,
2014 15.08 HOLD 20
Y
Oct 3,
2014 5.81 SELL 15 N
Nov 3,
2014 25 BUY 60 Y
Dec 9,
2014 10 SELL 85
N
Next on another comparison, by using PT Media Nusantara Citra Tbk data, on the next one week, stock price on 15th January 2014 declined by 35,
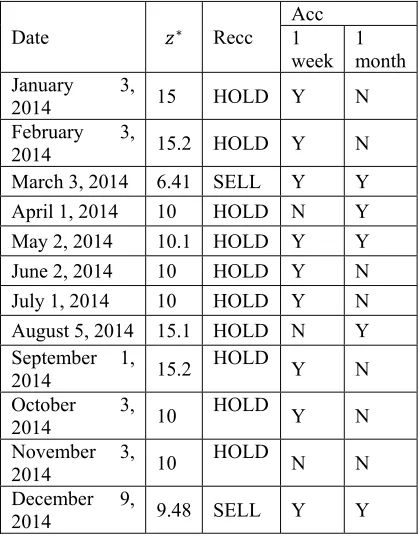
3946 Acc means accuracy, recc means recommendation, Y means that it is a good recommendation and N for not a good recommendation.
Table 15: Experiment results accuracy by time period
Date 𝑧∗ Recc Acc 1
week 1 month January 3,
2014 15 HOLD Y N
February 3,
2014 15.2 HOLD Y N
March 3, 2014 6.41 SELL Y Y April 1, 2014 10 HOLD N Y May 2, 2014 10.1 HOLD Y Y June 2, 2014 10 HOLD Y N July 1, 2014 10 HOLD Y N August 5, 2014 15.1 HOLD N Y September 1,
2014 15.2 HOLD Y N
October 3,
2014 10 HOLD Y N
November 3,
2014 10 HOLD N N
December 9,
2014 9.48 SELL Y Y
Based on Table 15, from 12 experiments, on 1 week period, there exists three failed experiment where the recommendation is not good, so we have one week period accuracy is 75%. While on a month period, the accuracy decline to 41.67%.
5. CONCLUSION AND FUTURE WORKS
The algorithm showed the four recommendations differed from the real-time conditions, so the accuracy level for PT Media Nusantara Citra Tbk was 66.67%. For PT Lippo Karawaci, there were only had three recommendations that differed from the real-time conditions, so the accuracy level for it was 75%. Therefore, this method can provide accurate recommendations for decision-making in stock trading.
ACKNOWLEDGMENTS
This research was supported financially by the Indonesia Ministry of Research and Higher
Education, with the PDUPT 2018 research grant scheme ID number 389/UN2.R3.1/HKP05.00/2018.
REFERENCES
[1] Herbert B. Mayo, Investment: An Introduction, 10th ed, Mason, OH, South-Western Cengage Learning, 2011, pp. 3-20.
[2] George A. Fontanills, T. Gentile, and R. M. Cawood, The Stock Market Course, New York, John Wiley & Sons, Inc, 2001, pp. 1-6.
[3] Timothy J. Ross, Fuzzy Logic With Engineering Applications, 3rd ed, Chicheste, West Sussex,
John Wiley & Sons, Ltd, 2010, pp. 117-139. [4] R. Naranjo, A. Meco, J. Arroyo, and M. Santos,
“An Intelligent Trading System with Fuzzy Rules and Fuzzy Capital Management”,
International Journal of Intelligent Systems,
Vol. 30, No. 8, 2015, pp. 963-983.
[5] Z. Rustam and A. S. Talita, “Fuzzy Kernel K-Medoids Algorithm for Multiclass Multidimensional Data Classification”, Journal of Theoretical and Applied Information
Technology, Vol. 80, Issue 1, October 2015, pp
147-151.
[6] N. B. Karayiannis and J. C. Bezdek, “An Integrated Approach to Fuzzy Learning Vector Quantization and Fuzzy C-Means Clustering”,
IEEE Trans. Fuzzy Systems, Vol. 5, No. 4, 1997,
pp. 622-628.
[7] Z. Rustam and A.S. Talita, “Fuzzy Kernel k-Medoids Algorithm for Anomaly Detection Problem”, AIP Conference Proceedings 1862 (1), 2017, 030154.
[8] J. R. Jang, C. Sun, E. Mizutani, Neuro-Fuzzy and Soft Computing: A Computational Approach to Learning and Machine Intelligence, New Jersey, Prentice Hall, 1997, pp. 73-89.
[9] A.D. Ijegawa, V.O. Rebecca, F. Olusegun, and O. O. Isaac, “A Predictive Stock Market Technical Analysis Using Fuzzy Logic”,
Computer and Information Science Journal,
Vol. 7, No. 3, 2014, pp. 1-17.
[10] G. Appel, Technical Analysis Power Tools for Active Investors, New Jersey, Pearson education, Inc, 2005, pp. 166.

![2,5 Dimethyl N [1 (1H pyrrol 2 yl)ethylidene]aniline](data:image/gif;base64,R0lGODlhAQABAIAAAP///wAAACH5BAEAAAAALAAAAAABAAEAAAICRAEAOw==)