5327
ALG CLUSTERING TO ANALYZE THE BEHAVIOURAL
PATTERNS OF ONLINE LEARNING STUDENTS
1AGUNG TRIAYUDI, 2ISKANDAR FITRI
12Informatic Department
Universitas Nasional, INDONESIA
E-mail : 1[email protected], 2[email protected]
ABSTRACT
In this paper, we describe a student's behavior search pattern using new method of Agglomerative Hierarchical Clustering (AHC) that is ALG (Average Linkage Dissimilarity Increment Distribution - Global Cumulative Score Standart). The dataset was taken from the 1523 student posts. This calculation resulted in 8 student behavior patterns obtained from 12 primary clusters. The cluster evaluation using the silhouette coefficient (S) generated the highest value of 0.9464 and cluster evaluation using cophenetic correlation coefficient (CPCC) generated the highest value of 0.9925.
Keywords: AHC, ALG, Dataset, Cluster, CPCC.
1. INTRODUCTION
Information and communication play a key role in building society with global knowledge. In fact, the rapid development of ICT and its use has facilitated the generation of information in accessing the basic components of knowledge for large segments within the community [1].
Finding the hidden patterns and knowledge of the education system data can greatly assist decision-makers to improve the educational process such as planning, monitoring, evaluation and service. Hidden patterns are found to help the higher education systems to make better decisions and have a more advanced program to guide students. Therefore, it will bring many benefits such as maximizing the efficiency of the education system, reducing the rate of disappearance of students, improving student graduation rates, student success, and student learning outcomes, as well as reducing the cost of the education system [7].
To understand how the best design and process in online learning, we need a fundamental and profound understanding of the processes carried out by members of the online learning community. First, we need to examine the validity of online learners characterization according to the model type of learning that comes from conventional pedagogical model. Online learning may have the same goal to learn face to face but fundamentally different. Equipment and structures are embedded in online learning may have a material effect on the
kinds of contributions made by learners and various interactions between learners, teachers and learning materials [8].
Therefore, this study argues that online learning styles and models are more complex than conventional methods, this can be attributed to a simple classification of cognitive styles [23]. While individuals who rely on preferences for one type of contribution, these changes with more to the context of learning [6]. If any, individual learning strategies that refer to socio-cultural phenomena, arising from group membership tend to be more professional or disciplined, than one cognitive [26].
ISSN: 1992-8645 www.jatit.org E-ISSN: 1817-3195
5328 individual and how the knowledge of the individual's learning style can be translated into useful pedagogical structure. In fact, there is evidence to suggest that learning style is more driven by the learning environment and not with individual cognitive style [11].
Clustering (or cluster analysis) can be defined as the process of separating labeled datasets into a discrete set of clusters based on similarities [2][3]. this technique becomes one of the most common descriptive methods, in which the purpose of cluster analysis is to identify the structure of data by means of descriptive taxonomic cluster approaches (where similar objects are labeled with the same cluster label) that characterize data where previously unknown [4][24]. cluster analysis seeks to find groups of closely related objects in the data [5][28][29].
The first paper in the related study [7], used Ward agglomerative clustering algorithm and compare the characteristics of learners using the Euclidean distance. Because it is not known for certain, the optimal number of clusters was assigned manually by getting some clustering solutions (from one to sixty-cluster) and compared according to the distance between partner clusters. The result is the 3 special approaches to online learning that are identified:
1. Mastery-oriented approach to the material formed by the students (59.3% of the sample) 2. Task focused approach (or "Get it done")
formed by students (22% of the sample) 3. A minimalist approach to the effort (or
"Procrastinator") formed by students (18.7% of the sample).
In this paper, we look at not fully discussing the behavior patterns of online learning students, it is proved that only three general properties of students are not identified in detail.
Next, second paper [8] more focused on the conception of learners through face-to-face discussions. Enter data from the enclosed questionnaire answered by 113 students who follow a political science course along one semester. The existence of different groups of learners with conception, approach and different academic performance is explored through agglomerative hierarchical cluster analysis, using the standard Z-score for the variable and the Euclidean distance as a measure of closeness. After doing a manual check of the results and discriminant analysis between groups, there are two separate groups of learners. The result is two different types of learners that are identified in accordance with the conception and approach to learning:
1. Those who have a cohesive learning concept and conduct in-depth approach to the online discussion (71.7% of the sample).
2. Those who have a fragmented conception and take a surface approach to online discussion (28.3% of the sample).
In this paper, the concept of behavioral patterns is divided into two general concepts whose level of accuracy to each student is questioned,
The third paper [22]. used Matrix squared Euclidean distance and Ward agglomerative clustering algorithm to determine the distance between groups. Differences in variables along the three clusters are confirmed by performing some statistical analysis (one way ANOVA and posthoc analysis using HSD Tukette criteria with an alpha level Bonferroni correction). The results are three types of learners are identified according to their behavior :
1. Superficial listeners (31% of the sample) 2. Concentrated listeners (49% of the sample), 3. Broad listeners (20% of the sample).
In this paper, the concept of behavioral patterns used only for students who listened, not compared with the pattern of student behavior in writing, causing the results obtained are not balanced.
The fourth paper [18] is a study in terms of participation in social learning about patterns of behavior associated with learners who access the online discussion forum. 303 learners enter data of a course on project management. These data were taken over the last two years (163 students in the first year; 140 students in the second year) were analyzed separately by using a cluster analysis of Euclidean distance as a measure of closeness, and Ward agglomerative clustering algorithm. After doing a manual check of the results clustering, two sets of five clusters obtained (one set per year). After applying subjective criteria to obtain two sets of clusters, Anha and Tukey one way posthoc test is made to find a statistically significant difference between groups. Results. By combining the two series generated from the 5 groups (one set per year), seven different types of learners identified : Strategic learners, Apathetic learners Detached learners, Directed learners, Purposive learners, Inquisitive learners, Committed learners.
In this paper, the concept of behavioral patterns used is detailed. but there are weaknesses that the behavior patterns obtained are not compared with the final grade of the courses obtained by each student.
5329 3 semesters using cluster analysis LSS-GCSS algorithm. After examining the clustering, the clustering evaluation used the coefficient silhouettes and got the average value of 0.623 and evaluation using CPCC to obtain an average value of 0.78. From the results of the grouping, it was obtained seven different models of student activity : Non-participants, Listeners, Questioners, Joining Conversationalists, Regular Participants, Dialogical Learners, Leading Participants.
In this paper, the concept of behavioral patterns used is appropriate only the cluster method used has a gap in the distance between the cluster trees are not balanced, evidenced by the validation value of sillhouette coefficient and cophenetic correlation coefficient which get a small value.
The conclusions of the literature described in this paper, there are several problem statements: (1) of some models of identification of student behavior patterns in online learning, not described in detail, especially the comparison between behavior patterns and final grades in a course obtained by a student online learning (2) The cluster method used to analyze student behavior patterns can not precisely locate the optimal number of clusters.
Significant differences of research in this paper is that in this paper examines the patterns of behavior of the students in online learning by collecting the postings of each student grouped into five datasets that Submission (assignment), Course Modules (forum), Discussion (forum), Course View, and Observe. Research in these five objects is taken from the results of students who listened and wrote, the end result of student behavior patterns compared with the final grade of the online student learning. The clustering algorithm used is a new method in agglomerative hierarchical clustering that is ALG (Average Linkage Dissimilarity Increment Distribution - Global Cumulative Score Standart) algorithm which is expected to find exactly the optimal number of clusters and eliminate the gap distance between cluster trees.
2. ALG ALGORITHM
In this paper, it is introduced a new hierarchical clustering algorithm namely ALG (Average Linkage Dissimilarity Increment Distribution - Global Cumulative Score Standart).
This new algorithm is the result of a combination of AHC (Agglomerative Hierarchical Clustering) based on DID (Dissimilarity Increment Distribution) [25] and parameter-free algorithm GCSS (Global Cumulative Score Standart) [9].
Algorithm 1 : ALG Algorithm 1 : Input: dataset X and parameter H 2: procedure
3: Mp : Mp(i,j)
4: Select the most similar clusters (Ci, Cj) minDist
= min{d(xi,xj) : xiϵ Ci , xjϵ Cj
5: if |Ci| < H and |Cj| < H then
6: Merge clusters Ci, Cj into a new cluster Cb
using ALDID (eq.4) and GCSS (eq.7) 7: end if
8: if |Ci| ≥ H and |Cj| < H then
9: if dissinc(xi, xj, xk) = |d(xi, xj) − d(xj, xk)| of (Cj)
is not in the tail then
10:the pdissinc(w; λ) (eq.2) then dissinc(xi, xj, xk) =
|d(xi, xj) − d(xj, xk)| of (Ci) then
11:Merge clusters Ci, Cj into a new cluster Cb using
ALDID (eq.4) and GCSS (eq.7) 12: else
13: Do not merge Ci, Cj
14: end if 15: end if
16: if |Ci| ≥ H and |Cj| ≥ H then
17: Compute gapCi(Cj) and gapCj(Ci)
18: Compute DC(Ci), DC(Cj) and DC(Ci∪ Cj)
19: if gap Ci(Cj) is in the tail of the pdissinc(w;
λ) (eq.2) then
20: disinc(xi, xj, xk) = |d(xi, xj) − d(xj, xk)| of
(Ci) then
21: Freeze cluster Ci
22: else if gap Cj (Ci) is in the tail of the
pdissinc(w; λ) (eq.2) then
23: disinc(xi, xj, xk) = |d(xi, xj) − d(xj, xk)| of
(Cj) then
24: Freeze cluster Cj
25: else if DC(Ci∪ Cj) ≤ DC(Ci) + DC(Cj)
then
26: Merge clusters Ci, Cj into a new cluster Cb
using ALDID (eq.4) and GCSS (eq.7) 27: else
28: Do not merge Ci, Cj
29: end if 30: end if
31: until all pairs of clusters should not be merged
2.1. First Step
Determining the proximity matrix (Mp) where the
AHC Method starts with every single object in one cluster (single cluster M) and performs a series of merging operations (M-1 merging steps).
𝑀𝑝 𝑋
⎝ ⎛
0 𝑑 … 𝑑
𝑑 0 … 𝑑
⋮ ⋮ ⋱ ⋮
𝑑 𝑑 … 0 ⎠
⎞ (1)
ISSN: 1992-8645 www.jatit.org E-ISSN: 1817-3195
5330 The DID was derived in, using the Euclidean distance as the dissimilarity measure d(ꞏ, ꞏ), under the hypothesis of Gaussian distribution of data. This distribution was written as a function of the mean value of the dissimilarity increments, which is denoted as λ [24].
𝑝𝑑𝑖𝑠𝑠𝑖𝑛𝑐 𝑤; 𝜆 𝜋𝛽
4𝜆 𝑤 𝑒𝑥𝑝
𝜋𝛽
4𝜆 𝑤
𝜋 𝛽
8√2𝜆 X
4𝜆
𝜋𝛽 𝑤
𝑒𝑥𝑝 𝜋𝛽
8𝜆 𝑤 𝑒𝑟𝑓𝑐
√𝜋𝛽
2√2𝜆𝑤
(2)
Specify the merging criteria based on AHC-DID [25]:
It is considered that Cj has M minus patterns and
M patterns have more, if the mean of the addition of Cj is less than the average α of Ci, ie
the increase of Cj at the tail of the DID Ci. If it
does not fall on the tail, the Ci and Cj clusters
are combined; If not, then it keeps separated.
Now, suppose Ci and Cj already have M or more
patterns. So, check if gap Ci (Cj) is behind the
DID cluster Ci. When that happens, Ci is
"frozen", meaning Ci is no longer available for
merging with other groups. Similarly, tests for Cj with respect to Ci are performed, but only if
the preceding Ci is not "frozen". Here only
allows one cluster to be "frozen" in each algorithm iteration.
In the end, if Ci or Cj is “not frozen”, for the
cluster yielded from the merging of Ci and Ci, Ci
U Cj, is calculated by the same procedure, with
the assumption that λij is the parameter of DID
for cluster Ci U Cj. Now, if DC Ci U Cj has
lower value of DC (Ci) + DC (Cj) (the length of
description to leave cluster which is separated), cluster Ci and Cj is merged and forms new cluster; If not, the group is made separated purposely.
2.3. Third Step
The assumption of the ALDID algorithm is to consider the newly formed cluster, Cb = Ci ∪ Cj,
obtained by combining Ci and Cj, and Ca is one of
the remaining groups formed in the preceding steps. Also, let's consider | Ci | and | Cj | as the number of
patterns on the Ci and Cj clusters, respectively. We
define the ALDID algorithm by characterizing the merging function, according to the size of the d * (Ca, Cb) distance between the clusters [25].
𝑑 𝐶 , 𝐶 |𝐶 |
|𝐶 | 𝐶 𝑑 𝐶 , 𝐶
𝐶
|𝐶 | 𝐶 𝑑 𝐶 , 𝐶
(4)
2.4. Fourth Step
GCSS alhorithm in essence compares the closeness level of a new cumulative hypothetical cluster (cdk) with the closeness level of cumulative
of both prospective groups (cdi and cdj). The
closeness level of cumulative compared to the context of distribution of cumulative closeness level presents in each cluster, is modeled with the procedure of cssk, cssi and cssj, respectively.
Therefore, basically, if cdk involves an increase in
context Ck is higher then both in steps cdi and cdj
are involved in the context of Ci and Cj (namely if
cssk is higher than both cssi and cssj), Ci and Cj will
not be suited for global combination.
Firstly, let Cx be any given cluster in the dendrogram ∆ resulting from the agglomeration process of the objects in X and let 𝑐𝑑 be the sample consisting of its own cumulative proximity level (cdx) and the cumulative proximity levels of its nested clusters in dendrogram ∆. The cumulative standard score statistic of cluster Cx (cssx) is defined
as the standard score of cdx with respect to 𝑑 [9]:
𝑐𝑠𝑠 𝑐𝑑 𝑐𝜇
𝑐𝜎 𝑐𝜇 (5)
where cµx and cσx are the first and second moments of 𝑐𝑑 [9]:
𝜇 1
𝑛 𝑐𝑑 , 𝜎
1
𝑛 𝑐𝑑 (6)
𝑐𝑑 the lth observation in 𝑐𝑑 and ndx the length of
𝑐𝑑 (i.e. the number of non-singleton clusters nested within Cx).
The GCSS criterion determines that the union between Ci and Cj into a new cluster Ck is a suitable
merging if their cumulative standard score statistics (cssi and cssj) are greater than or equal to the
following dynamic merging threshold [9]:
𝑔𝑐𝑠𝑠 𝐶 , 𝐶,, 𝐶 , 𝑌
𝑔𝑐𝑠𝑠 𝑐𝑠𝑠 , 𝑁 , 𝛾 , 𝜇 , 𝜎 , 𝑁 , 𝛾 , 𝜇 , 𝜎 , 𝑌
𝑐𝑠𝑠 Υ 𝑁 , 𝑁 Ψ 𝑁 , 𝛾 , 𝜇 , 𝜎 , 𝑁 , 𝛾 , 𝜇 , 𝜎 , 𝑌
(7)
where cssk is the cumulative standard score of Ck,
YMIN = 0.01 N, γi = dij − di, γj = dij − dj
and µi, σi, µj and σj. The value of YMIN is defined as
1% of the number of clusters in C (YMIN = 0.01 Y).
Therefore, the merging rule derived from the GCSS criterion is defined as follows [9]:
𝐷𝐶 𝐶 1
2 1 log 12 log 𝜆
1 2log 𝐼 𝜆
5331
If the GCSS criterion is simultaneously met from both Ci (cssi≥ gcssth(Ck, Ci, Cj, YMIN)) and
Cj (cssj ≥ gcssth(Ck, Ci, Cj, YMIN)), Ci and Cj
merge into a new cluster.
Otherwise, the merging between Ci and Cj is
rejected in global terms, so that they remain separated
3. EVALUATION OF CLUSTERING
RESULT
This evaluation is intended to determine the appropriate clustering solution, here used the index validity of silhouete coefficient and cophenetic correlation coefficient.
3.1 Silhouete Coefficient
The silhouette value for each point is a measure of how similar that point is to points in its own cluster, when compared to points in other clusters. The silhouette value for the ith point, s(i), is defined as [20]
𝑠 𝑖 𝑏 𝑖 𝑎 𝑖
max 𝑎 𝑖 , 𝑏 𝑖 (8)
where a(i) is the average distance from the ith point to the other points in the same cluster as i, and b(i) is the minimum average distance from the ith point to points in a different cluster, minimized over clusters. The silhouette value ranges from -1 to +1. A high silhouette value indicates that i is well-matched to its own cluster, and poorly-matched to neighboring clusters. If most points have a high silhouette value, then the clustering solution is appropriate [20].
3.2 Cophenetic Correlation Coefficient
Cophenetic correlation coefficient to measure the degree of similarity between Pc and the proximity
matrix P. The cophenetic matrix Pc is defined in
such a way that the element Pc(i, j) represents the
proximity level at which the two data points xi and
xjare found in the same cluster for the first time.
The CPCC index is defined as [11] 𝐶𝑃𝐶𝐶
1
𝑀 ∑ ∑ 𝑑 𝑐 𝜇 𝜇
1
𝑀 ∑ ∑ 𝑑 𝜇 𝑀 ∑1 ∑ 𝑐 𝜇
(9)
Where 𝑀 and µP , µC:
𝜇 1
𝑀 𝑑 , 𝜇
1
𝑀 𝑐 (10)
where dij and Cij are the (i, j) elements of matrices P
and Pc, respectively. The CPCC ranges from −1 to
+1. the high value indicates great similarity between P and Pc [11].
4. STRATEGY OF MODELING THE
BEHAVIOR OF ONLINE LEARNING STUDENTS
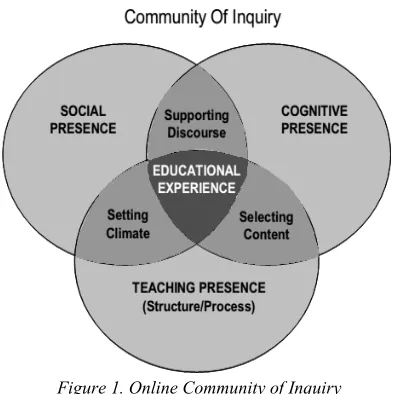
[image:5.612.318.516.423.620.2]Profile of individual learners is built upon further analysis. Initial method for categorizing by examining each individual who posted to a discussion forum for the content on each of the three dimensions of learning identified by Garrison et al. [12]: (Teaching, Social and Cognitive). But it was found that, in every dimension, a posting can potentially contribute in various ways. Since many messages show evidence of some types of behavior, such as social networking or cognitive analysis of course, proved to be very useful for analyzing the behavior exhibited combination of students, because there seems to be a series of key combinations that occur [29]. The combination of these behaviors is rarely combined in the same message that we use the definition of the role to summarize the complexity of community interaction done by the students.
Figure 1. Online Community of Inquiry (Garisson et all)[13].
We identified eight patterns of behavior that is played by the students, for this analysis. In the following example, we give an example of the behavior of students acting in each role
1. Initiator
ISSN: 1992-8645 www.jatit.org E-ISSN: 1817-3195
5332 2. Contributor
A contributor is a pattern of behavior that has a bridge between teachers and students both in terms of material and task
3. Facilitator
The facilitator is a pattern of behavior favored by the other students, they mediate in the debate in the discussion forums and provide constructive feedback.
4. Knowledge-elicitor
Knowledge-Elicitor acts as a good information seeker about the material in a course and seeks answers from other students assignments, the students are very proactive.
5. Vicarious-acknowledger
Vicarious acknowledger has a role in the search for positive and negative side of the students, they grouped themselves, and often busied themselves with discussions not related to the content and work.
6. Complicator
Complicator is the inconsistent student's behavior patterns. They sometimes motivate other students and also frequently argue about things that are beyond the subject matter. 7. Closer
Closer is a pattern of behavior of students look lazy, they are active if they need something. They tend to be disliked by the other students. 8. Passive-Learner
Passive learner acts as a student who is not active, rarely seen in the discussion forum, and has a very minimal contribution.
5. DATA SET
Experiments carried out in this paper to analyze the activities carried out by students in online learning to two different subjects in the Bachelor of Information & Communication Technology (Computer Security, Knowledge Management) in January 2017 until May 2017 at the School and Science Technology, Asia e University, Malaysia. All courses took place in the teaching and learning environment based online, the entire dataset involving a total of 36 students were distributed in five post dataset of total 1523 students.
6. RESULT AND ANALYSIS
6.1 Characterisation
Number of posting activity by online learner : 1. P(1) : Submission (assignment)
2. P(2) : Course module (forum)
3. P(3) : Discussion (forum) 4. P(4) : Course view 5. P(5) : Observe
[image:6.612.321.500.223.380.2]Number of days used by online learner : 1. D(1) : Submission (assignment) 2. D(2) : Course module (forum) 3. D(3) : Discussion (forum) 4. D(4) : Course view 5. D(5) : Observe 6.2 Cluster analysis
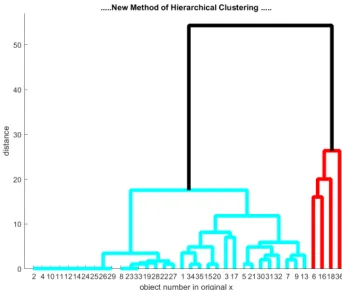
Figure 2. Dataset (P(1), D(1)) “Submission (assignment)”,
where the red line indicates the first cluster (C1), and the
black line indicates the second cluster (C2)
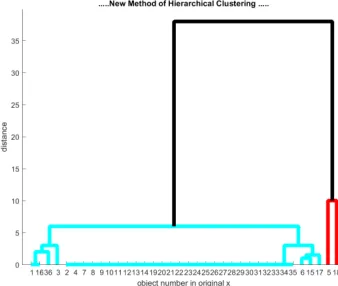
Figure 3. Dataset (P(2), D(2)) “Course modul (forum)”
where the red line indicates the first cluster (C1), and the
[image:6.612.328.499.422.567.2]5333
Figure 4. Dataset (P(3), D(3)) “Discussion (forum)”,
where the red line indicates the first cluster (C1), black
[image:7.612.105.275.284.433.2]line indicates the second cluster (C2)
Figure 5. Dataset (P(4), D(4)) “Course view” where the
red line indicates the first cluster (C1), and the black line
indicates the second cluster (C2)
Figure 6. Dataset (P(5), D(5)) “Observe”, where the red
line indicates the first cluster (C1), blue line indicates the
second cluster (C2)
6.3 Evaluation
From the results of clustering using a clustering algorithm agglomerative hierarchical (single linkage), it was obtained a total of 12 key clusters of a total of five datasets that were tested, 12
clusters were grouped into 8 patterns of behavior online learners, this division used analytics from [15].
For clustering evaluation results, the average coefficient of 5 dataset silhoute is 0.812 with the value of highest "silhoute coefficient" in the dataset "observe" amounted to 0.946. On the other hand, the average value of "cophenetic correlation coefficient" from 5 dataset is 0.952 with the highest value of "cophenetic correlation coefficient" is dataset "observe" of 0.9925. From all the tested dataset by using the coefficient of "silhoute" and "correlation coefficient cophenetic", datasets and clusters are formed optimal and balanced.
Table 1.AHC algorithm calculation results; clust
(clusters), S (value of silhouete coefficient), CPCC (value of cophenetic correlation coefficient)
Clust S CPCC Model P(1),
D(1) CC1 0.7884 0.9589 Initiator 2
P(2),
D(2) CC1 0.7477 0.9239 Contributor
2 Facilitator
P(3),
D(3) C1 0.8872 0.9753 Knowledge – elicitor
C2 Vicarious –
acknowledger P(4),
D(4) C
1 0.6909 0.9073 Complicator
C2 Closer
P(5),
D(5) CC1 0.9464 0.9925 Passive – learner 2
Compared with previous studies [9], an increase in the value of the group on the evaluation of the value of coefficient "silhouette" and "cophenetic correlation coefficient" shows that the clustering algorithm is used more optimally. While compared with previous studies [7] [8] [22] [18], this model offers a different strategy to the concept of analyzing the behavior patterns of students in online.
A high standard deviation indicates considerable variation in the extent to which individuals interact with further discussion forums indicating the need for a more subtle analysis of the behavior of individuals taking part. The characteristics of each of the eight model. Clusters whose level of variables cannot be distinguished from each other in the post-hoc test share one or more the same subsets; clusters with a variable that has a significantly different level does not have the same subset
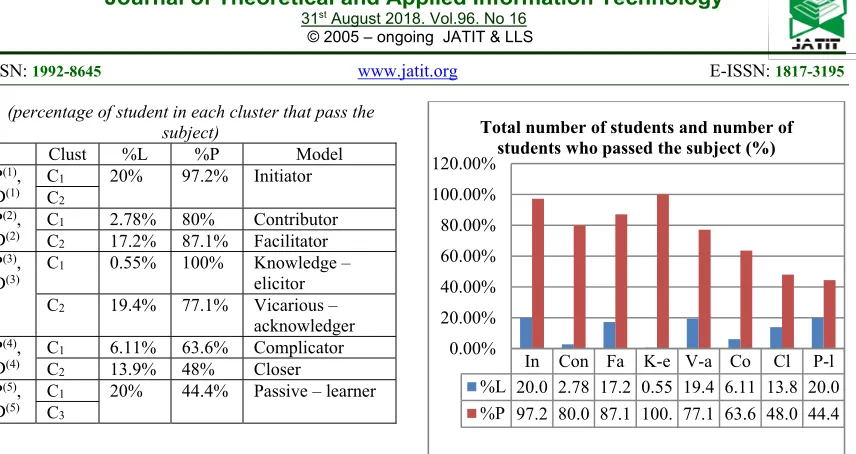
Table 2.Characterisation of clusters in the %L
[image:7.612.106.275.476.619.2]ISSN: 1992-8645 www.jatit.org E-ISSN: 1817-3195
5334 (percentage of student in each cluster that pass the
subject)
Clust %L %P Model P(1),
D(1) C
1 20% 97.2% Initiator C2
P(2),
D(2) CC1 2.78% 80% Contributor 2 17.2% 87.1% Facilitator P(3),
D(3) C
1 0.55% 100% Knowledge – elicitor C2 19.4% 77.1% Vicarious –
acknowledger P(4),
D(4) CC1 6.11% 63.6% Complicator 2 13.9% 48% Closer P(5),
D(5) CC1 20% 44.4% Passive – learner 3
Explanation of Table 2 above is that the division of the cluster into any patterns of behavior, and the number of students in each cluster is formed and the number of students who graduate from each cluster. Furthermore table 2 was analyzed again to divide the number of students in each pattern of behavior that is formed.
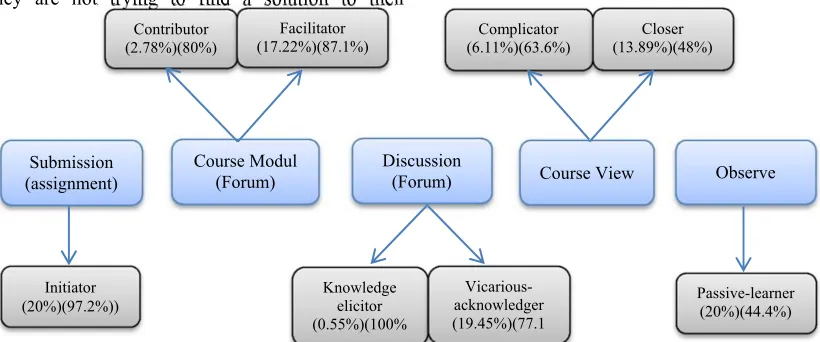
The dataset of "submission (assignment)" has two clusters that represent the pattern of the initiator of the total number of students. This pattern of behavior has a considerable population that is 20%. This pattern of behavior can be best defined as a pattern of behavior. The passing rate of this pattern of behavior is the largest among other behavioral patterns that is 97.2% (see Figure 7).
[image:8.612.99.527.43.270.2]In the second dataset, "course module" that represents a pattern of behavior of "contributor" and "facilitator" here can be analyzed that the two inter-related behavior patterns have a percentage of the population that is not the same, of which 2.78% versus 17.22%. "Facilitator" has a role in which behavior pattern is defined by the student who acted as a mediator in the discussion forum on the subject matter and tasks. While the pattern of behavior of "contributor" is determined by the student who contributed this idea to help other students who have difficulty in understanding the subject matter, where it is one of the disadvantages of online learning, not have a chance face to face with a teacher as a result of material of a course less understandable by some students. There is also an imbalance passing rate behavior pattern of "contributors" amounted to 80%, while 87.1% graduated from a behavior pattern of "facilitator" (see figure 7).
Figure 7. Total number of students (%L) and number of students who passed the subject (%P).(In=Initiator, Con=Contributor, Fa=Facilitator, K-e=Knowledge-elicitor, V-a=Vicarious-acknowledger, Co=Complicator,
Cl=Closer, P-l=Passive-learner)
The "Discussion (forum)" is divided into three clusters, wherein the first cluster to a pattern of behavior "Knowledge-elicitor" is defined by students seeking information about the materials that are difficult to understand and seek answers from a given task in a nutshell, the student population in behavioral patterns this is very little just 0.55% and has a graduation rate of 100%. The second behavior patterns in "Discussion (forum)" is "Vicarious-acknowledger" where these behavior patterns represent two clusters in this dataset. This pattern of behavior is defined by many learners in discussion forums looking for the positives and negatives of many learners, such as praising learners according to their thinking and criticize learners than those, this pattern of behavior raises many problems such as debates excessive defend his opinions both in terms of subject matter or things that are not related to the subject matter. Total student population in this pattern of behavior was 19.45% and had a graduation rate of 77.1% (see Figure 7).
In the fourth dataset "course view" is divided into two clusters for the two patterns of behavior that is "complicator" and "closer". The pattern of behavior "complicator" is defined by the students with characteristics that are not consistent. On the one hand they motivate other students, on the one hand they also often create discussion forums that are not important, and argue too much. In this pattern of behavior has the number of students of 6.11% and 63.6% graduation rate. The behavior pattern of "closer" can be defined by the students laziness and tend to be less liked by other students. The number of students in this behavior pattern was 13.89% and
In Con Fa K-e V-a Co Cl P-l %L 20.0 2.78 17.2 0.55 19.4 6.11 13.8 20.0 %P 97.2 80.0 87.1 100. 77.1 63.6 48.0 44.4 0.00%
20.00% 40.00% 60.00% 80.00% 100.00% 120.00%
5335 the lowest graduation rates among other behavioral patterns only 48% (see Figure 7).
Lastly, the dataset of "observe" which has three clusters are represented by patterns of "passive learner" behavior which is a pattern of behavior that has less interaction with other students, this pattern of behavior tends to disadvantage them, because teachers in online learning cannot interact directly so they do not can understand their difficulties, and they are not trying to find a solution to their
[image:9.612.96.506.204.375.2]difficulties. The number of students in this pattern of behavior is 20% and the graduation rate is 44.4% (see Figure 7).
Figure 8. The final model of behavior patterns online learning students
7. CONCLUSION
The experimental results show that ALG algorithm can provide optimal clustering solutions in the face of various clustering scenarios, this algorithm outperforms the most widely used grouping algorithm in practice and involves computing requirements similar to other AHC algorithms. ALG algorithm also provides interesting information about the behavioral patterns of online learning learners.
From the results of grouping patterns of behavior of students, there are still many students who have not been able to adapt to online learning, many students monotonous and conventional, such as less active in the discussion forum and love to argue with each other. Some students do not focus on the material being discussed.
It should be noted that the end result of the analytical strategy is much better than the final model obtained in the preceding study, as it consists of a complex conceptual map produced and represents the whole process of analysis and This illustrates the relationship and dependence between variations in participation profiles and models identified during different stages of the overall analysis strategy.
Recognizing patterns of behavior of the students in online learning requires learning a huge and complex. There are many benefits of the analysis of the behavior patterns of students, such as to facilitate teachers in classifying students in the subjects taught so that the teacher can adjust teaching styles as needed by the student, and expected to recognize students' behavior patterns and adapt to the appropriate learning style to create a balance and be able to increase the percentage of their graduation, as well as reducing the excessive gap among students.
From the results of the evaluation by using the silhouete and hierarchical clustering agglomerative cophenetic correlation coefficient to group behavior patterns have got a high score. This means that the algorithm used is in accordance with the tested dataset and obtain maximum results.
REFERENCES:
[1] Cudanov M, Jasko O, Savoiu G.
“Interrelationships of organization size and information and communication technology adoption.” Journal of Applied Quantitative Methods. 2010.
Submission (assignment)
Course Modul (Forum)
Discussion
(Forum) Course View Observe
Initiator (20%)(97.2%))
Contributor (2.78%)(80%)
Facilitator (17.22%)(87.1%)
Knowledge elicitor (0.55%)(100%
Vicarious-acknowledger (19.45%)(77.1 Complicator (6.11%)(63.6%)
Closer (13.89%)(48%)
ISSN: 1992-8645 www.jatit.org E-ISSN: 1817-3195
5336 [2] Jain, Anil K., M. Narasimha Murty, and
Patrick J. Flynn. “Data clustering: a
review.” ACM computing surveys
(CSUR) 31(3) : 264-323. 1999.
[3] Xu, Rui, and Donald Wunsch. “Survey of clustering algorithms.” IEEE Transactions on neural networks 16(3) : 645-678. 2005. [4] Sevillano, Xavier. “Hierarchical self-refining
consensus architectures and soft consensus functions for robust multimedia clustering.” Procesamiento del Lenguaje Natural 44. 2010.
[5] Tan, P. N., Steinbach, M., and Kumar, V. “Introduction to Data Mining”. Addison-Wesley, Pearson Education, Boston, Massachusetts (USA). 2006.
[6] Lewis, Nancy J., and Peter Orton. “The Five
Attributes of I Innovative
E-Learning.” Training & Development 54(6) : 47-47. 2000.
[7] Barab, S. A., Bowdish, B. E., and Lawless, K. A. “Hypermedia Navigation : Profiles of
Hypermedia Users”. Educational
Technology Research and Development, 45(3):23–41. 1997.
[8] Bliuc, A. M., Ellis, R., Goodyear, P., and Piggott, L. “Learning through Face-to-Face and Online Discussions: Associations between Students’ Conceptions, Approaches and Academic Performance in Political Science”. British Journal of Educational Technology, 41(3):512–524. 2010.
[9] Cobo, G,. “Parameter-free agglomerative hierarchical clustering to model learners’ activity in online discussion forums”. PhD thesis, Information and Knowledge Society, Obertat de Catalunya University, Spain. 2013.
[10] Diaz, D.P. and Cartnal, R.B. “Students Learning Styles In Two Classes”. College Teaching,. 47(4): p. 130-135. 1999.
[11] Gan, G., Ma, C., and Wu, J.. “Data Clustering: Theory, Algorithms and Applications”. American Statistical Association and the Society for Industrial and Applied Mathematics, Philadelphia, Pennsylvania (USA). 2007.
[12] Garrison, D.R., Anderson, T., and Archer, W. “Critical inquiry in a text -based environment: Computer conferencing in higher education”. The Internet and Higher Education. 2000.
[13] Garrison, D.R., Anderson, T., and Archer, W. “Critical Thinking and Computer Conferencing : A Model and Tool to Assess
Cognitive Presence”. American Journal of Distance Education, in press.
[14] Hani, H., Hooshmand H, Mirafzal, S. “Identifying the Factors Affecting the Success and Failure of Online learning Students Using Cluster Analysis”. 7th International Conference. Iran. IEEE. 2013. [15] Harasim, L. “A Framework for online
learning : The Virtual-U”. Computer,. 32(9): p. 44-49. IEEE. 1999.
[16] Honey, P, Mumford, A. “The manual of learning styles”., Maidenhead, UK: Peter Honey. 1992.
[17] Hrastinski, Stefan. “What is Online Learner Participation? A Literature Review”. Article in Computer & Education. 2008.
[18] Khan, T. M., Clear,1 F., and Sajadi, S. S. “The Relationship between Educational Performance and Online Access Routines: Analysis of Students’ Access to an Online Discussion Forum”. Proceedings of the Second International Conference on Learning Analytics and Knowledge, pages 226–229. University of British Columbia, ACM Press. 2012.
[19] Lewis, N.J. and Orton, P. “The Five Attributes Of Innovative Online learning”. Training & Development,. 54(6). 2000. [20] Rouseeuw, P. J. "Silhouettes: a graphical aid
to the interpretation and validation of cluster analysis." Journal of Computational and Applied Mathematics. Vol. 20, No. 1. 1987. [21] Waters, J., Gasson, S. “Strategies Employed
By Participants in Virtual Learning Communities”. Proceedings of International Conference On System Sciences, 38th. IEEE. Hawai. 2005.
[22] Wise, A. F., Marbouti, F., Hsiao, Y. T., and Hausknecht, S. “A Survey of Factors Contributing to Learners’ "Listening" Behaviors in Asynchronous Online Discussions”. Journal of Educational Computing Research, 47(4) : 461–480. 2012. [23] Wise, Alyssa Friend, Farshid Marbouti, Jennifer Speer, and Ying-Ting Hsiao. “Towards an understanding of ‘listening’in online discussions: A cluster analysis of learners’ interaction patterns.” In Connecting computer supported collaborative learning to policy and practice: CSCL2011 conference proceeding, vol. 1, pp. 88-95. 2011.
5337 Recognition, pp. 280-293. Springer, Berlin, Heidelberg, 2011.
[25] Aidos, Helena, and Ana Fred. “A family of hierarchical clustering algorithms based on high-order dissimilarities”. Signal Processing Conference (EUSIPCO), 2014 Proceedings of the 22nd European. IEEE, 2014.
[26] Keogh, Eamonn, Stefano Lonardi, and Chotirat Ann Ratanamahatana. “Towards parameter-free data mining.” In Proceedings of the tenth ACM SIGKDD international conference on Knowledge discovery and data mining, pp. 206-215. Association for Computer Machinery (ACM), 2004.
[27] Ding, Chris, and Xiaofeng He. “Cluster merging and splitting in hierarchical clustering algorithms.” In Data Mining, 2002. ICDM 2003. Proceedings. 2002 IEEE International Conference on, pp. 139-146. IEEE, 2002.
[28] Ester, Martin, Hans-Peter Kriegel, Jörg Sander, and Xiaowei Xu. “A density-based algorithm for discovering clusters in large spatial databases with noise.” In (Knowledge Discovery and Data Mining (KDD), vol. 96, no. 34, pp. 226-231. 1996.
[29] Lopez, Manuel Ignacio, J. M. Luna, C. Romero, and S. Ventura. “Classification via clustering for predicting final marks based
on student participation in