HYBRID COMPOSITE EDGE DETECTION ALGORITHM FOR
PET SCANNER IMAGES
1SNEHA NAGABHYRU, 2ABHISHEK GUDIPALLI, 3RAMASHRI TIRUMALA,
1,2 School of Electrical Engineering, VIT University, Vellore – 632014, India.
3 Department of Electronics and Communication Engineering,
Sri Venkateswara University College of Engineering, Tirupati – 517501, India
E-mail: [email protected], [email protected], [email protected]
ABSTRACT
Image enhancement is a core concept of Digital Image Processing that ensures that any disturbances in the original image are eliminated thereby enhancing the quality of the image. Furthermore conversion of an image from one color space to another ensures that there is minimal data loss in the processing of the image. There are many existing algorithms and several image enhancement techniques have been developed, such as histogram equalization, contrast stretching, bit plane slicing, averaging, etc. In this paper, we considered edge detection as one of the technique and the evaluation metrics such as SSIM (Structural Similarity Index) and VIF(Visual Information Fidelity) has been applied to the images to measure the image quality. In this paper are Positron Emission Tomography(PET) images, which have extensive application in biomedical field. In the present work evaluation metrics are applied to the original image and edge detected image, thus from experimental results it is observed that the proposed algorithm works well for measuring the quality of spatial resolution enhanced hyper spectral images.
Keywords: Edge detection, PET scanner images, Color models, SSIM, VIF
1. INTRODUCTION
Edge detection is an important image processing tool and is used as a fundamental pre-processing step in many edge detection applications. Edges have a wide diversity of applications in image categorization, image registration, feature extraction and pattern recognition. An edge detector also a mathematical operator that responds to the spatial change and discontinuities in gray levels of pixel set in an image. Each industry will use its suitable color model, For example CMYK for printing, YUV for video systems and so on. PET images have extensive application in biomedical field (like oncology for detection of tumors in the brain etc).Thus in this paper we apply edge detection techniques to a PET image. The RGB image is transformed to various color models such as YUV, YCbCr and XYZ. The metrics such as SSIM and VIF have been applied to the above models for assessment of quality of images and out of these XYZ color model is providing more detailed edge information than the other color models.
2. DIFFERENT COLOR SPACES
2.1 YUV and YCbCr Color Models
The YCbCr color space is used for component digital video is a scaled and offset version of the YUV color space. The YUV color model is the basic color model used in analogue color TV broadcasting. Initially YUV is the re-coding of RGB for transmission efficiency (minimizing bandwidth) and for downward compatibility with black-and white television. The YUV color space is “derived” from the RGB color
space .It comprises of the luminance (Y) and two
color difference (U,V) components .The luminance can be computed as the weighted sum of the Red ,Green and Blue components, the color difference
,or chrominance ,components are formed by
ISSN: 1992-8645 www.jatit.org E-ISSN: 1817-3195
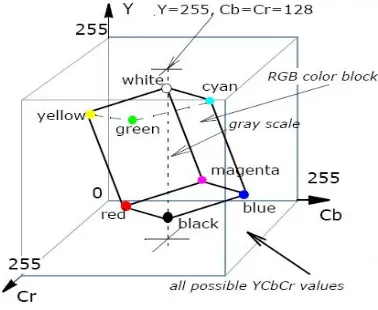
[image:2.612.102.282.169.319.2]RGB values, because the possible RGB colors occupy only part of the YUV space limited by these ranges. Figure 2 shows the valid color block in the YUV space that corresponds to the RGB color cube RGB values are normalized to [0..1][1]
Figure 1: RGB colors cube in the YUV color space
The Y’U’V’ notion means that the components are derived from the gamma corrected R’G’B’. Weighted sum of these non linear components forms a signal representative of the luminance
called luma Y’(luma is often loosely referred to as
luminance so you need to be careful to determine whether a particular author assigns a linear or a
non-linear interpretation to the term luminance).[1]
The YCbCr color model is a scaled and offset version of the YUV color space and is used for component digital video . The position of the block of RGB-representable colors in the YCbCr space is shown in Figure2.1 RGB Colors Cube in the YCbCr Color Model [1].
Figure 2: RGB colors cube in the YCbCr color space
2.1.1 Conversion between RGB and YUV
models
Y’= 0.299*R’ + 0.587*G’ + 0.114*B’
U’= -0.147*R’ - 0.289*G’ + 0.436*B’ = 0.492*(B’- Y’)
V’= 0.615*R’ - 0.515*G’ - 0.100*B’ = 0.877*(R’- Y’)
2.1.2 Conversion between RGB and YCbCr
models
Y’=0.257*R'+0.504*G'+0.098*B'+16
CB'=-0.148*R'-0.291*G'+0.439*B'+128
CR'=0.439*R'-0.368*G'-0.071*B'+128
2.2 CIE XYZ Color Model
[image:2.612.311.509.441.590.2]The XYZ color space is an international standard developed by the CIE (Commission Internationale de l’Eclairage) [1]. This model is based on three hypothetical primaries, XYZ, and all visible colors can be represented by using only positive values of X, Y, and Z. The CIE XYZ primaries are hypothetical because they do not correspond to any real light wavelengths. The Y primary is intentionally defined to match closely to luminance, while X and Z primaries give color information. The main advantage of the CIE XYZ space (and any color space based on it) is that this space is completely device-independent. The position of the block of RGB-representable colors in the XYZ space is shown in Figure3 RGB Colors Cube in the XYZ color space.[1]
Figure 3: RGB colors cube in the XYZ color space
2.2.1 Conversion between RGB and XYZ
models
X = 0.412453*R + 0.35758 *G + 0.180423*B Y = 0.212671*R + 0.71516 *G + 0.072169*B
[image:2.612.92.281.519.674.2]2.3 Positron Emission Tomography
Positron emission tomography, also called PET imaging or a PET scan, is a type of nuclear medicine imaging and a non-invasive technique to measure the distribution of substances labelled with positron-emitting radioisotopes in the human body. Wrenn et al (1951) [2] and Brownell et al (1953) [2] suggested the application of positron emitting radioisotopes for the localization of brain tumors. But it was only in 1975 that several groups started to investigate positron emitters with transaxial tomographic devices [2]. A positron decay is annihilated into two photons, was used to construct PET scanners to quantify the tracer concentration in the human body. Nuclear medicine is a branch of medical imaging that uses small amounts of radioactive material to diagnose and determine the severity or to treat a variety of diseases, including many types of cancers, heart disease, gastrointestinal, endocrine, neurological disorders and other abnormalities within the body[3]. In this, the radiotracer is either injected into the body, either by swallowing or inhaling as a gas and eventually accumulates in the organ or area of the body being examined. Radioactive emissions from the radiotracer are detected by a special camera or imaging device that produces pictures and detailed molecular information. With the help of image fusion, nuclear medicine images can be combined with computed tomography (CT) or magnetic resonance imaging (MRI) to produce fused image, this allow the information from two different exams to be correlated and interpreted on one image, which gives more information for precise and accurate diagnosis[3]. Today, most PET scans are available in combination of PET and CT scanners. The combined PET/CT scans provide images that pinpoint the location of abnormal metabolic activity within the body. A PET scan measures important body functions, such as blood flow, oxygen use, sugar (glucose) metabolism, cancer, tumors, nervous system disorders[3].
2.4 Evaluation Metrics
In image processing applications, the measurement of image quality plays main role. Image quality assessment algorithms are classified into three categories: FullReference (FR), Reduced-Reference (RR), and No-Reference (NR) algorithms [4]. True No Reference algorithms are difficult to design and little progress has been made (Sheikh et al, 2005). Full Reference algorithms are easier to design and The SSIM index is a full reference metric. In this, the measurement of image quality is based on reference image of perfect quality. SSIM is
designed to improve Peak Signal-to-Noise Ratio (PSNR) and Mean Squared Error (MSE), which is proved to be inconsistent with human eye perception [5]. However, in RR or NR quality assessment, partial or no reference information is available.The SSIM index is defined as [5]:
(1)
Let x an y be the
two discrete non-negative signals extracted from the same spatial location from two images being
compared, respectively , and be the mean
of x ,the variance of x and the covariance of x and
y, respectively. and gives the information on
luminance and contrast of x. measures the
structural similarity.
where C1, C2 and C3 are small constants
given by C1 = (K1L)2; C2 = (K2L)2 and C3 = C2/
2; respectively. L is the dynamic range of the pixel
values (L = 255 for 8 bits/pixel gray scale images),
and K1< 1 and K2< 1 are two scalar constants [5].
Sheikh and Bovik (2006) developed a visual information fidelity (VIF) index for Full Reference measurement of quality of image. VIF is calculated between the reference image and its copy
[6]. For ideal image, VIF is exactly unity. For
distorted image types, VIF lies in between interval
[0, 1]. Let e=c+n be the reference image, and n
zero-mean normal distribution N (0, I ) noise.
Also, let f=d+n′= gc+v′+ n′ be the test image,
where g represents the blur, v′ the additive
zero-mean Gaussian white noise with covariance I ,
and n′ the zeromean normal distribution N(0,σ n2I )
noise [4]. Then, VIF can be computed as the ratio
of the mutual information between c and f, and the
mutual information between c and e for all wavelet
subbands except the lowest approximation subband [5].
(2)
3 PROPOSED EDGE DETECTION ALGORITHM
ISSN: 1992-8645 www.jatit.org E-ISSN: 1817-3195
Step 1: The RGB image is sub divided into R, G and B layers of the image.
Step 2: A 3X3 Laplacian mask is convolved with the R component of the image.
Step 3: The edge detected R and the G, B layers of the image are concatenated to obtain edge detected image
Step 4: SSIM and VIF values are calculated between the R edge detected image and RGB image.
Step 5: Repeat steps 2 to 4 to calculate the SSIM and VIF values between G edge detected image and RGB image
Step 6: Repeat steps 2 to 4 to calculate the SSIM and VIF values between B edge detected image and RGB image
Step 7: The SSIM and VIF values of individual components are averaged.
Step 8: R, G and B values of the image are transformed into its YCbCr, YUV and XYZ Intensity values using the conversion formulas. Step 9: Repeat steps 1 to 8 to calculate SSIM and VIF values for YCbCr, YUV and XYZ images.
4 EXPERIMENTAL RESULTS
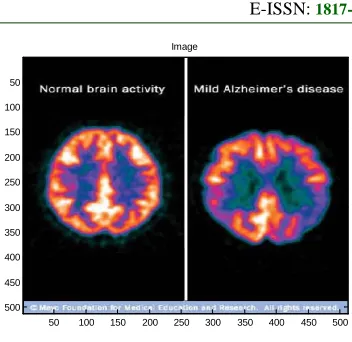
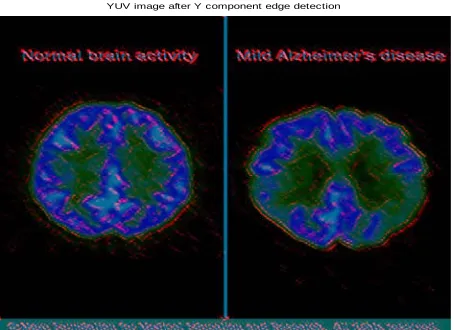
The Proposed algorithm has been applied to PET images of different color models and SSIM &VIF values are computed for a set of edge detected images and dataset is formed and tabulated in Table 1. PET can be used as a screening tool to provide a non-invasive and highly accurate to identify individuals at risk for or in the early stages of disease, such as breast cancer, Alzheimer’s and heart disease. For RGB color model, The SSIM value range is around 0.63 and VIF value range is around 0.32. For XYZ color model, The SSIM value range is around 0.72 and VIF value range is around 0.45. For YCbCr color model, The SSIM value range is around 0.35 and VIF value range is around 0.26. For YUV color model, The SSIM value range is around 0.43 and VIF value range is around 0.30. From the dataset, XYZ model shows better quality of edge detection than the other color models. The original and edge detected RGB, YCbCr, YUV and XYZ images are shown below.
Table 1: SSIM And VIF Values For RGB, XYZ, Ycbcr
And YUV Images.
Image
50 100 150 200 250 300 350 400 450 500 50
100
150
200
250
300
350
400
450
500
Figure 4: RGB image
RGB image after Red component edge detection
Figure 5: RGB edge detected image XYZ image
Figure 6: XYZ image
COLOR MODEL
SSIM VIF
RGB 0.6388 0.3260
XYZ 0.7245 0.4575
YCbCr 0.3578 0.2688
[image:4.612.329.505.77.248.2]XYZ image after X component edge detection
Figure 7: XYZ edge detected image
[image:5.612.350.577.303.468.2]YCbCr image
Figure 8: YCbCr image
YCbCr image after Y component edge detection
Figure 9: YCbCr edge detected image
YUV image
Figure 10: YUV image
YUV image after Y component edge detection
Figure 11: YUV edge detected image
5 CONCLUSION
ISSN: 1992-8645 www.jatit.org E-ISSN: 1817-3195
to another extends hope to new horizons. The algorithm was developed based on RGB colour space and the significant features extracted by converting it into YUV, YCbCr and XYZ models. Among these XYZ model shows better quality of edge detection.
REFERENCES
[1] Image Color Conversion, http://software.intel.com/sites/products/docum-entation/hpc/ipp/ippi/ippi_ch6/ch6_Intro.html”.
[2] Uwe Pietrzyk, “Positron Emission
Tomography- Physical Background and
Applications”, Bergischen
Universit¨at-Gesamthochschule Wuppertal, May 2011. [3] Positron Emission Tomography – Computed
Tomography(PET/CT),
http://www.radiologyinfo.org/en/info.cfm?pg= pet
[4] Sheikh, H. R., Bovik, A. C. and Cormack, L., “Noreference quality assessment using natural scene statistics: JPEG2000”, IEEE Transactions on Image Processing, 14(11), 2005, pp.1918-1927.
[5]S Qian, G Chen “Four reduced-reference metrics for measuring hyperspectral images after spatial resolution enhancement” In: Wagner W., Székely, B. (eds.): ISPRS TC VII Symposium – 100 Years ISPRS, Vienna, Austria, July 5–7,
2010, IAPRS, Vol. XXXVIII, Part 7A [6] Sheikh, H. R. and Bovik, A. C, “Image information and visual quality”, IEEE Transactions on Image Processing, 15(2), 2006, pp. 430-444.
[7]Chen, G. Y. and Qian, S. E, “Evaluation and comparison of dimensionality reduction methods and band selection”, Canadian Journal of Remote Sensing, 34(1), 2008a, pp. 26-32. [8]Li, Q. and Wang, Z., “Reduced-reference image
quality assessment using divisive normalization-based image representation”, IEEE Journal of Selected Topics in Signal Processing, Special issue on Visual Media Quality Assessment, 3(2), 2009,pp. 202-211. [9] Image courtesy,
http://www.mayoclinic.com/health/pet-scan/MY00238
[10]S K Naik , C A Murthy, “Standardization of edge magnitude in color images”, IEEE Transactions on Image Processing , 2006 , 15(9) : 2588 —2595.
[11]C L Novak, S A Shafer “Color edge detection”, Proc of DARPA Image Understanding Workshop. 1987, pp:35 -37
[12]R C Gonzalez,R E Woods, “Digital Image Processing” (Second Edition).New York : Prentice Hall , 2003 pp.300-450.
[13]P E Trahanias , A N Venetsanopoulos, “Color Edge Detection Using Vector Order Statistics”, IEEE Transactions on Image Processing ,1993 , 2 (2) : 259 -264.
[14]J Fan , W GAref , M Hacid , et al. “An improved automatic isotropic color edge detection technique”, Pattern Recognition Letters,2001,22(3):1419-1429
[15]A. Koschan, “A comparative study on color
edge detection,” in Proceedings of the 2nd
Asian Conference on Computer Vision ACCV’95, pp. 574-578, Singapore, 1995. [16]A. N. Evans and X. U. Liu, “A morphological
gradient approach to color edge detection,” IEEE Transactions on Image Processing, vol. 15, no. 6, pp.1454-1463, 2006.
[17] X. W. Li and X. R. Zhang, “A perceptual color edge detection algorithm,” International Conference on Computer Science and Software Engineering, vol. 1, pp.297-300, 2008.
[18] N.S.T Sai ,R.C Patil “SVD Based Features For Image Retrieval “IJCSAI-2012.Tech Mahindra Limited ,Mumbai ,India,SVKM’s ,NMIMS University.
[19]Ning Xu and Yeong-taeg Kim,”Luminance Preserving Color Convrsion for 24-bit RGB Displays”, IEEE international journal-2009, Samsung Information Systems America,Irvine,CA 978-1-4244.