HESAM JAFARIAN
Process Modeling Optimization in Additive Manufacturing Using Artificial Neural Networks
ABSTRACT
Hesam Jafarian: Process Modeling Optimization in Additive Manufacturing Using
Ar-tificial Intelligence
Tampere University of technology Master of Science Thesis, 117 pages November 2018
Master’s Degree Program in Automation Engineering
Major: Factory Automation and Industrial Informatics
Examiner: Professor Eric Coatanea
Keywords: Artificial Intelligence- Artificial Neural Network-Wire Arc Additive
Manu-facturing
The need for production has roots in human life and its history. This date back to primitive days of human life, where he or she had to apply surrounding materials in order to man-ufacture the tools necessary for survival and durability against any insecurity. This was legitimizing the use of any means in order to obtain the tools and reach the goals at any cost. However, with human development primarily within the knowledge and understand-ing domain and also with the desire of humanity for best, expectations have risen. This was the time not only the cost mattered but also the simplicity of design, massive produc-tion, and diversity, less waste, autonomy, and implementation within a shorter time gained a higher momentum.
On the other hand, the conventional manufacturing method was based on subtractive manufacturing with cutting and eliminating the unwanted sections or parts of an object. The disadvantage of such a method is that it requires a complicated production process design and is accompanied by waste. However, with the rise of additive manufacturing and three-dimensional printing equipment back in the 1980s, it became possible to build parts which could have almost any shape or geometry. Moreover, this also empowered the possibility of using digital and 3D models built by computer-aided design software. Simultaneously, on the other side, the foundation and application of artificial intelligence were maturing. This was due to the demand for machines to assist human beings in the domain of knowledge reasoning, learning, and planning. These were the pillars for mak-ing machines autonomous and to benefit from such features.
Accordingly, this research work studies and overviews the applications and techniques of machine learning and artificial intelligence in the domain of additive manufacturing. It aims to determine the interaction of influential parameters on the process and to find the best solutions for improving the quality and mechanical features of manufactured parts. Moreover, this research tends to enable the experts to grasp a better understanding of AM process during manufacturing and additionally intends to infuse the experts' knowledge in additive manufacturing field utilizing the artificial neural network and finally generate a model with the ability of prediction and selection for promising results.
PREFACE
هدنیوج درم ودب ددرگ هک هم تسا هم ،رب نارتهم رب هدنناد هک تسيکی نادان ناج و هدرم نت ! ا هب هاش تفگ و ا ، هب هچ اهرنه ز تسا هب شناد هک داد خساپ نينچ تسين چيه ناهج ردنا هب شناد ز ! یسودرف ريبک -“Once questioned a king about the best artifice one can achieve, which with it the seeker can be-come extreme. A sagacious man responded to the king the Knowledge indeed it is. The owner of the knowledge to see or if to deem will become above all without to dream. Nothing would be better than knowledge in the world, where a corpse or alive without knowledge will be equal in accord.” –The great Ferdowsi
This thesis is conducted within the consent of Mechanical Engineering and Industrial Systems Fac-ulty at the Tampere University of Technology in the years 2017-2018 and under the supervision of Professor Eric Coatanea.
I at this moment would like to express my utmost gratitude to all who supported me spiritually
during the hard time I experienced with the loss of everything, merely the word ‘Father’ who was,
is and will be an inspiration forever with his smiles and hopes for future.
I also like to express my highest appreciation again for Professor Coatanea who with all of his supports indeed played a turning point in my life. I want to appreciate the efforts of my family and dearest friends especially Romaric Prodhon, Marzieh Zare, Alireza Zare ,Saboktakin Hayati, Amir-homayoun Aliyazdi for their non-stopping supports.
Additionally, a significant amount of appreciation goes for our research group in the MEI-LAB. Finally, I hope this thesis provides some but not all the means to pave the path for future develop-ment in the additive manufacturing field and envision the possible future works.
Tampere, 20.11. 2018 Hesam Jafarian
TABLE OF CONTENTS
ABSTRACT ... I PREFACE ... II TABLE OF CONTENTS ... 2 LIST OF FIGURES ... 5 NOMENCLATURE ... 8 INTRODUCTION ... 9Objective and goal ... 9
Problem re-statement ... 9
Goals and Objectives ... 10
Study Limitations ... 10
THESIS STRUCTURE ... 11
DESGIN AND ANALYSIS ARCHITECTURE ... 12
ADDITIVE MANUFACTURING ... 13
History ... 13
Digital workflow ... 14
Design Manufacturing and Assembly ... 14
Design Requirements... 15
Design and Opportunities ... 15
Constraints ... 15
Costs 15 FUSED DEPOSITION ADDITIVE MANUFACTURING ... 16
WIRE-ARC ADDITIVE MANUFACTURING (WAAM) ... 19
Welding Techniques ... 19
GMAW welding ... 19
MIG / MAG Welding ... 19
TIG welding ... 19
CMT Welding ... 19
CMT Pulse ... 20
CMT Advanced ... 20
CMT Advanced and Pulse ... 20
Shielding Gas Types ... 21
ACETYLENE (C₂H₂) ... 21
ARGON (Ar)... 21
ARGON / CARBON DIOXIDE (Ar / CO₂) ... 21
CARBON DIOXIDE (CO₂) ... 21
NITROGEN (N₂) ... 21
OXYGEN (O₂) ... 21
TRI-MIX (Ar / O₂ / CO₂) ... 21
WELDING DEFECTS... 23 Cracks ... 24 Undercuts ... 24 Spatters ... 25 Porosity ... 25 Overlap defect ... 26
Crater & Slag ... 26
Fusion incompletion ... 27
Necklace Crack ... 27
Grooves and Penetration... 27
ENVIRONMENT ... 28
ABB robot manipulator ... 29
IRBP A-750 Positioner ... 30
ABB teach-pendant ... 30
Cold Metal Transfer System ... 32
Torch... 33
METHODOLGIES AND STATE OF THE ART ... 36
Dimensional Analysis Methodology ... 37
Computational Methodologies ... 38
Analysis of Variance (ANOVA) Methodology ... 38
Machine Learning Methodology ... 39
Supervised learning (learning by a teacher) ... 42
Non-supervised learning (learning without teacher) ... 42
Reinforcement learning ... 43
Learning rules ... 43
Backpropagation (BP) network ... 44
General issues in ANN development ... 44
Classical approximation using Surface Response Models ... 47
Knowledge-Based Artificial Intelligence System Design ... 48
Fuzzy Thinking, Neuro Fuzzy Rules and Inference ... 49
Fuzzification and Rules Generation ... 50
Hedge Categorization and Linguistic Variables ... 52
Ruled-Based Systems ... 54
Mamdani Inference Systems ... 55
Constraints ... 55
Adaptive Neural Network... 56
RESULTS AND DISCUSSIONS ... 57
Case study 1: Training of a data-set using artificial neural networks ... 57
Case study 2: Sphere and Fluid a Knowledge Based Application ... 67
Case study 3: Fused Deposition Modeling ... 74
Case study 5: Radial-Based Neural Networks ... 90
Case study 6: NeuroFuzzy ... 94
CONCLUSIONS AND PROSPECTIVE WORKS ... 109
Conclusion ... 109
Prospective works ... 110
LIST OF FIGURES
FIGURE 1:ILLUSTRATION OF THE THESIS STRUCTURE. ... 11
FIGURE 2:ILLUSTRATION OF THE MAIN ARCHITECTURE DESIGN. ... 12
FIGURE 3:ILLUSTRATION OF TISSUE PRODUCTION BY MEANS OF AM PROCESS [7]. ... 13
FIGURE 4:ILLUSTRATION OF AN ARTIFICIAL HIP GENERATED USING AN AM PROCESS [9]. ... 13
FIGURE 5:ILLUSTRATION OF A GAS TURBINE BLADE PRODUCED BY ADDITIVE MANUFACTURING. ... 14
FIGURE 6:ILLUSTRATION OF A FUSED DEPOSITION MODELING PROCESS... 17
FIGURE 7:ILLUSTRATION OF THE PRINTING STEPS. ... 17
FIGURE 8:ILLUSTRATION OF A G-CODE BLOCK WITH CORRESPONDING FUNCTIONS. ... 18
FIGURE 9:ILLUSTRATION OF PRE-PROCESSING WORKFLOW. ... 18
FIGURE 10:ILLUSTRATION OF CMT IN PULSE MODE [7]. ... 20
FIGURE 11:ILLUSTRATION OF CURRENT AND VOLTAGE DIAGRAM OF CMT IN DIFFERENT MODES [30]. ... 20
FIGURE 12:ILLUSTRATION OF LIST OF SHIELDING GASES. ... 21
FIGURE 13:ILLUSTRATION OF CATEGORIZATION OF THE WELDING DEFECTS. ... 23
FIGURE 14:ILLUSTRATION OF A PROPER WELDING. ... 23
FIGURE 15:ILLUSTRATION OF THE CRACK DEFECT. ... 24
FIGURE 16:ILLUSTRATION OF THE UNDERCUT DEFECT. ... 24
FIGURE 17:ILLUSTRATION OF WELDING SPATTERS AROUND A WELDING BEAD. ... 25
FIGURE 18:ILLUSTRATION OF POROSITY DEFECT IN WELDING... 25
FIGURE 19:ILLUSTRATION OF THE OVERLAPPING DEFECT IN WELDING PROCESS. ... 26
FIGURE 20:ILLUSTRATION OF THE SLAG DEFECT IN WELDING. ... 26
FIGURE 21:ILLUSTRATION OF AN INCOMPLETE FUSION DEFECT. ... 27
FIGURE 22ILLUSTRATION OF THE GROOVED PENETRATION. ... 27
FIGURE 23:ILLUSTRATION OF THE EQUIPMENT OF ADDITIVE MANUFACTURING USING WAAM TECHNIQUE. ... 28
FIGURE 24:ILLUSTRATION OF THE WORKING RANGE OF THE ROBOT. ... 29
FIGURE 25:ILLUSTRATION OF DIMENSION OF ABBIRB4600-40-2.55 MANIPULATOR. ... 30
FIGURE 26:ILLUSTRATION OF THE IRBPA-750POSITIONER. ... 30
FIGURE 27:ILLUSTRATION OF OPERATION MODES OF THE ROBOT. ... 31
FIGURE 28:ILLUSTRATION OF AN ABBFLEX PENDANT AND ITS VIRTUAL FORMAT IN ROBOT STUDIO. ... 31
FIGURE 29:ILLUSTRATION OF THE WELDING SYSTEMS ARCHITECTURE. ... 32
FIGURE 30:ILLUSTRATION OF THE FRONIUS WELDING TORCH. ... 33
FIGURE 31:ILLUSTRATION OF DIFFERENT TORCH NECKS WITH CORRESPONDING ANGLES. ... 33
FIGURE 32:ILLUSTRATION OF THE TORCH NECK WEAR PARTS. ... 34
FIGURE 33:ILLUSTRATION OF ATTACHMENT OF ROBACTA DRIVE AND 5000 TORCH BOD. ... 34
FIGURE 34:ROBACTA DRIVE CMT. ... 34
FIGURE 35:ROBACTA 5000 WITH A TOUCH SENSOR. ... 34
FIGURE 36:ILLUSTRATION OF THE WELDING UNIT. ... 35
FIGURE 37:ELEMENTS OF REINFORCEMENT LEARNING. ... 43
FIGURE 38:ILLUSTRATION OF THE FUZZY AND BOOLEAN LOGIC. ... 49
FIGURE 39:ILLUSTRATION OF A UNIVERSAL SET X AND ITS SUBSETS AS CRISP AND FUZZY SUBSETS ... 51
FIGURE 40:ILLUSTRATION OF THE HEDGES, CORRESPONDING MATHEMATICAL RELATIONS AND GRAPHICAL REPRESENTATION [100]... 53
FIGURE 41:ILLUSTRATION OF MONOTONIC RELATION OF THE HEIGHT AND WEIGHT. ... 54
FIGURE 42:ILLUSTRATION OF THE ARCHITECTURE OF A NEURAL NETWORK WITH TWO HIDDEN LAYERS. ... 58
FIGURE 43:ILLUSTRATION OF NETWORK ARCHITECTURE. ... 60
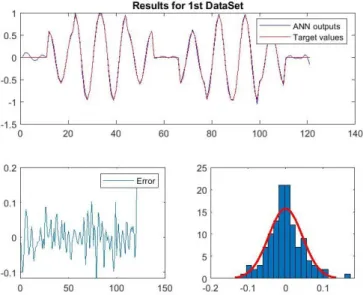
FIGURE 45:ILLUSTRATION OF THE ANN PREDICTION OUTPUT AND THE EXPECTED TARGET VALUES FOR 120 DATA POINTS. ... 61
FIGURE 46:ILLUSTRATION OF THE PERFORMANCE CURVE FOR THE 120 DATA SAMPLES. ... 61
FIGURE 47:ILLUSTRATION OF THE PROGRESS PARAMETERS FOR THE 120 DATA SAMPLES. ... 62
FIGURE 48.ILLUSTRATION OF TRAINING OF 2601DATA SAMPLES. ... 62
FIGURE 49:ILLUSTRATION OF PROGRESS DIAGRAM FOR 2601 SAMPLES. ... 63
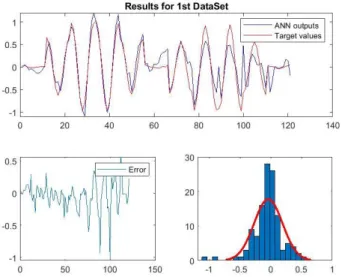
FIGURE 50:ILLUSTRATION OF RESULTS FOR THE SECOND DATA SET ... 63
FIGURE 51:ILLUSTRATION OF THE RESULTS FOR THE TWO DATA-SETS WITH PRESENCE OF A NOISE. ... 64
FIGURE 52:ILLUSTRATION OF A TRAINING WITH HIGH AMOUNT OF HIDDEN NODES AND LAYERS. ... 64
FIGURE 53:ILLUSTRATION OF THE NETWORK RESULTS WITH HIGH AMOUNT OF NEURONS AND HIDDEN LAYERS. ... 65
FIGURE 54:ILLUSTRATION OF THE SURFACE RESPONSE MODEL USING A LINEAR LOWESS WITH 1% SPAN AND NO ROBUST. ... 65
FIGURE 55:ILLUSTRATION OF SURFACE RESPONSE MODELING ON THE DATA SETS. ... 66
FIGURE 56:ILLUSTRATION OF THE SPHERE IN THE FLOW FLUID WITH DEMONSTRATION OF THE DRAG FORCE. ... 67
FIGURE 57:ILLUSTRATION OF A KBANN NETWORK CONSTRUCTED USING DIMENSIONAL ANALYSIS ... 68
FIGURE 58:ILLUSTRATION OF PRECIOUS ATTEMPT TO PREDICT THE MODEL WITH MODELS SENSITIVITY TO PRIMARY CONDITIONS. ... 68
FIGURE 59:ILLUSTRATION OF THE RESULTS OF PREDICTION BY KB-ANN. ... 69
FIGURE 60:DIFFERENCE OF THE REAL DATA POINTS (TARGET VALUES) AND THE PREDICTED DATA BY THE NETWORK (OUTPUT) VALUES FOR THE KB-ANN. ... 69
FIGURE 61:ILLUSTRATION OF PERFORMANCE OF TRAINING PROCESS FOR TRAINING, VALIDATION AND TEST DATA POINTS. ... 69
FIGURE 62:ILLUSTRATION OF PERFORMANCE CURVES FOR THE KB-ANN NETWORK. ... 70
FIGURE 63:ILLUSTRATION OF CONVENTIONAL ANN STRUCTURE MODEL FOR THIS PROBLEM. ... 71
FIGURE 64:ILLUSTRATION OF THE RESIDUALS AND THE PREDICTION RESULTS OF THE CONVENTIONAL ANN. ... 71
FIGURE 65:ILLUSTRATION OF REGRESSION PLOT FOR THE CONVENTIONAL NETWORK. ... 72
FIGURE 66:ILLUSTRATION OF THE PERFORMANCE CURVES FOR THE CONVENTIONAL NEURAL NETWORKS. ... 72
FIGURE 67:ILLUSTRATION OF THE RESULTS FOR BOTH NETWORKS AND THE COMPARISON OF THE CONVENTIONAL (UP) AND KB-ANN (DOWN) DATA PLOTS. ... 73
FIGURE 68:ILLUSTRATION OF THE FDM CASE USED FOR THE STUDY. ... 74
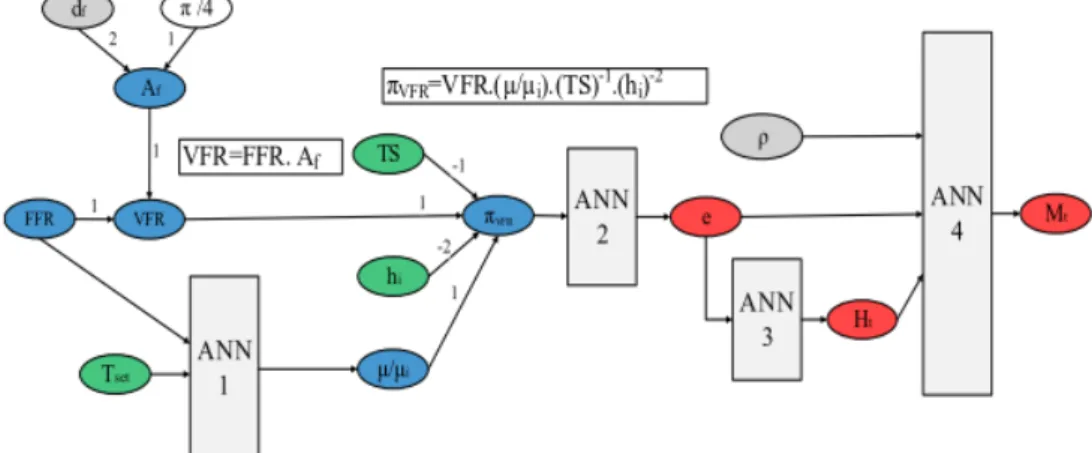
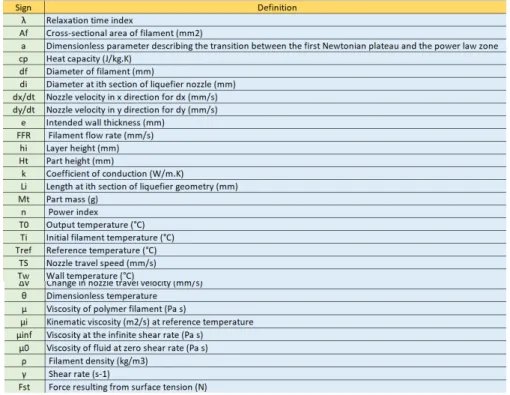
FIGURE 69:ILLUSTRATION OF THE CAUSAL RELATIONS IN THE FDM PROCESS FOR THE SELECTED CASE STUDY OBTAINED BY THE DACM. ... 75
FIGURE 70:ILLUSTRATION OF THE LIST OF IMPACTING PARAMETERS AFFECTING THE FDM PROCESS IN THIS CASE STUDY. ... 76
FIGURE 71:ILLUSTRATION OF CLASSICAL ANN MODEL USED FOR FDM PROCESS. ... 76
FIGURE 72:ILLUSTRATIONS OF THE PERFORMANCE CURVES FOR THE CLASSICAL TRAINING OF THICKNESS. ... 77
FIGURE 73:ILLUSTRATION OF THE PERFORMANCE RESULT FOR THE CLASSICAL ANN FOR THE HEIGHT. ... 78
FIGURE 74:ILLUSTRATION OF THE BEST PERFORMANCE FOR MASS. ... 78
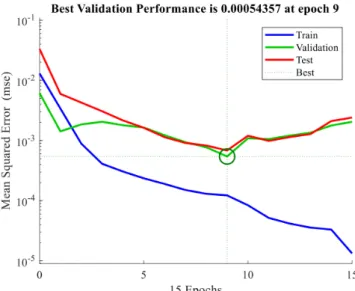
FIGURE 75:ILLUSTRATION OF THE PERFORMANCE CURVES WITH THE BEST VALIDATION FOR THE ANN1 IN KB-ANN NETWORK. ... 79
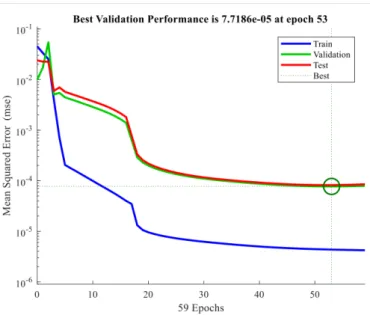
FIGURE 76:ILLUSTRATION OF THE ANN2 PERFORMANCE DIAGRAM RESULTS IN THE KB-ANN NETWORK. ... 80
FIGURE 77:ILLUSTRATION OF THE ANN3 PERFORMANCE DIAGRAM RESULTS IN THE KB-ANN NETWORK. ... 80
FIGURE 78:ILLUSTRATION OF THE ANN4 PERFORMANCE CURVES IN KB-ANN NETWORK. ... 81
FIGURE 79:ILLUSTRATION OF GENERALIZATION TEST AND THE AMOUNT OF STANDARD ERROR FOR CLASSICAL AND KB-ANN NETWORKS. . 81
FIGURE 80:ILLUSTRATION OF A TURBINE BLADE OF A GAS COMPRESSOR. ... 83
FIGURE 81:ILLUSTRATION OF A CROSS SECTION OR SLICE SURFACE OF THE CAD MODEL. ... 83
FIGURE 82:ILLUSTRATION OF BEAD WITH DIFFERENT QUALITIES. ... 84
FIGURE 83:ILLUSTRATION OF THE PARAMETERS USED IN THE WELDING PROCESS. ... 84
FIGURE 84:ILLUSTRATION OF THE BEADS IN POLYWORKS AFTER BEING SCANNED USING THE LASER SCANNER. ... 86
FIGURE 85:ILLUSTRATION OF A CROSS SECTION CONDUCTED TO PROVIDE THE ANALYTICAL DATA. ... 87
FIGURE 86:ILLUSTRATION OF A SCANNED BEAD WITH THREE CORRESPONDING ZONES. ... 87
FIGURE 87:ILLUSTRATION OF BEAD 1 AND 2 HEIGHT AND WIDTH DATA. ... 88
FIGURE 89:ILLUSTRATION OF K-MEDOID CLUSTERING APPROACH FOR BEAD SEGMENTATION IN A WAAM PROCESS. ... 89
FIGURE 90:ILLUSTRATION OF THE TYPICAL RBF NETWORK TOPOLOGY WITH RADIAL FUNCTION IN THE HIDDEN LAYERS. ... 90
FIGURE 91:ILLUSTRATION OF THE RESULT OF RBF TRAINING WITH LEARNING RATE OF 0.0003 AND 5 CLUSTER CENTERS. ... 91
FIGURE 92:ILLUSTRATION OF THE RBF NETWORK RESULTS WITH LEARNING RATE OF THE 0.00003 AND 4 CLUSTERS. ... 92
FIGURE 93:ILLUSTRATION OF RESULTS OF THE RBF NETWORK FOR THE LEARNING RATE OF 0.00008 AND 4 NUMBER OF CENTERS. ... 92
FIGURE 94:ILLUSTRATION OF AN APPROXIMATE USING THE RBF NETWORKS FOR A KNOWN SIN(X) FUNCTION PLUS A RANDOM WHITE NOISE. THE BEST FIT IS OBTAINED FOR A SIX CLUSTER CENTERS AND WITH A LEARNING RATE OF 0.03 ... 93
FIGURE 95:ILLUSTRATION OF A POTENTIAL CAUSAL RELATION IN THE WAAM PROCESS... 94
FIGURE 96:DEFINITION OF THE CAUSAL GRAPH. ... 95
FIGURE 97:ILLUSTRATION OF THE INTERACTION AMONG THE PARAMETERS ON THE MEAN OF AVERAGE HEIGHT. ... 96
FIGURE 98:ILLUSTRATION OF THE VARIABLES AND THEIR CORRESPONDING HEIGHT VALUES. ... 98
FIGURE 99:ILLUSTRATION OF THE MAIN EFFECT PLOT FOR THE OUTPUT HEIGHT AND THE OTHER MAIN INPUT VARIABLES. ... 98
FIGURE 100:INTERACTION OF THE INPUT VARIABLES IN THE WAAM PROCESS AND THE HEIGHT VARIABLE AS THE OUTPUT. ... 99
FIGURE 101:ILLUSTRATION OF THE LIST OF FACTORS INFORMATION AFTER NORMALIZATION FOR THE HEIGHT OUTPUT VALUE. ... 100
FIGURE 102:ILLUSTRATION OF THE RESULTS OF A TWOWAYANOVA ON THE WAAM FOR ESTIMATION OF THE HEIGHT. ... 100
FIGURE 103:ILLUSTRATION OF THE CORRELATION BETWEEN INPUT VARIABLES AND THE OUTPUT HEIGHT. ... 101
FIGURE 104:BEAD SEGMENTATION TO SEPARATE THE BEAD ZONES. ... 101
FIGURE 105:ILLUSTRATION OF THE FUZZY INFERENCE ENGINE WITH 3 INPUTS AND 1 OUTPUT VARIABLE. ... 101
FIGURE 106:TS VS HEIGHT VALUES (TOP) AND MEMBERSHIP FUNCTION FOR THE TS(DOWN). ... 102
FIGURE 107:WFR(M/MIN) VS HEIGHT AND CORRESPONDING WFR’S RANGE (TOP) AND ILLUSTRATION OF THE MEMBERSHIP FUNCTIONS FOR THE WFR. ... 103
FIGURE 108:Α (°) VS HEIGHT EFFECT PLOT AND THE RANGE OF VALUES. ... 104
FIGURE 109:ILLUSTRATION OF THE MEMBERSHIP FUNCTIONS FOR THE TORCH ANGLE. ... 104
FIGURE 110:ILLUSTRATION OF THE RANGE OF HEIGHT’S VALUES FOR 55 SAMPLES. ... 105
FIGURE 111:ILLUSTRATION OF THE MEMBERSHIP FUNCTIONS FOR THE HEIGHT PARAMETER. ... 105
FIGURE 112: ILLUSTRATION OF THE RULES DEFINITION IN FUZZY TOOLBOX IN MATLAB. ... 106
FIGURE 113:ILLUSTRATION OF THE FUZZY INFERENCE WITH THE CORRESPONDING RULES DEFINE FOR ESTIMATION OF THE HEIGHT. ... 107
FIGURE 114:ILLUSTRATION OF COMPARISON OF THE PREDICTED VALUES AND ACTUAL VALUES FOR THE TEST DATA ON FOR THE WAAM. 107
LIST OF TABLES
TABLE 1:AXIS INFORMATION OF THE ROBOT AND CORRESPONDING SPEEDS. ... 29TABLE 2:TALLNESS MEMBERSHIP COMPARISON OF THE BOOLEAN AND FUZZY REASONING BASED ON THE 1.85 CM CRITERIA. ... 50
TABLE 3:THE COMPARISON OF THE TWO NETWORKS IN PRESENCE AND ABSENCE OF THE NOISE. ... 64
TABLE 4:LIST OF PARAMETERS INVOLVED IN WAAM PROCESS. ... 95
NOMENCLATURE
AM Additive Manufacturing ANN Artificial Neural Network ANOVA Analysis of Variance
ASTM American Society for Test and Material BL Backpropagation Learning
BL Boltzmann Learning BNN Bayesian Neural Network BP Back Propagation
CAD Computer Aiding Designs CL Competitive Learning CMT Cold Metal Transfer DA Dimensional Analysis ECL Error Correction Learning ECL Error-correction learning FDM Fused Deposition Modeling FNN Fuzzy-Neural-Networks GA Genetic Algorithm G-Code Geometric code HL Hebbian Learning
KB-ANN Knowledge Based Artificial Intelligence LBM Laser Beam Melting
LM Levenberg-Marquardt LSTM Long Short-Term Memory ML Machine Learning
MLP Multi-Layer Perceptron MSE Mean Squared Error NHN Number of Hidden Nodes RBF Radial Basis Function RMSE Root Mean Squared Error RNN Recurrent Neural Network RSM Response Surface Methodology SSE Sum-of-Squared Error
INTRODUCTION
Although additive manufacturing (shortly as AM) dates back to 1980s, it has received much attention recently. One reason is that it is considered as a quick prototyping solution for many sci-entist and researcher. Besides, many companies find it as a mean for a better rapid prototyping and production planning in their research and development procedures. Consequently, prominence of the most influential parameters in an AM processes have become more evident and turned to a trend of demand. Therefore, depending on the type of AM process and based on the method applied, concepts such as diffusion, melting, porosity, orientation of fillers, types of materials, mechanical features, heat transfer and fluids behavior are among the most discussed topics and a lot of research and studies are conducted accordingly at the moment to address these topics [1].
Objective and goal
With correspondence to the first illustration portrayed in the introduction section and based on the demand mentioned at the moment by the companies, this research intends to provide a study of AM processes with the objectives demanded in this field. Therefore, following this section, the problem in the field of AM is re-stated based on recent studies and then an illustration of the objectives and dealing with limitations are shown consequently.
Problem re-statement
Based on the Testing and Materials American Society (Shortly ASTM) and within the des-ignation of the F42, the AM process is categorized into the following categories and standards.
• Material Extrusion
• Power Bed Fusion
• Material Jetting
• Binder Jetting
• Direct Energy Deposition
• Vat Photo Polymerization
• Sheet Lamination
Nevertheless, among these AM processes, Fused Deposition Modelling hereafter called FDM and Wire Arc Additive Manufacturing shortly as (WAAM) would be the focus of this study [2] [3]. Meanwhile, in order to conduct a novel study and to obtain a physical model, it is required to reach an understanding of the controlling parameters and properties, which play a chief role for instance in the amount of surface roughness, fatigue properties, porosity and so forth.
Also, based on the type of the technology which is applied in the AM process, it is required to know the limitations and challenges within that concept. The main areas where special attention is required are [4]:
• AM filament and materials
• Type of AM technology and process
• AM equipment items
• Qualification of the productions
• Process controls possibilities such as real-time and closed-loop process controls
• Simulation and modeling
• Sensors such as their application in melt-pool measurements and temperatures
• Consistency
• Quality
• Reproduction
Goals and Objectives
In order to reach a novel design concerning quality and strength it is required as an objective to illustrate and simplify involving parameters into the most useful parameters. This is realized by applying the concept presented as the dimensional analysis hereafter called as DA [9]. This method is used to identify the involving parameter and reduce the redundant relations. Additionally, it pro-vides a graphical representation of existing relations in the AM process which can be applied for further and better analysis. The objective of this thesis is to study the appropriate machine learning approaches by utilizing DA in order to achieve a novel design regarding quality and structure. This is due to the reason that the additive manufacturing is subject to non-linearity and requires param-eter adjustment. One another issue is that it is subject to uncertainty and this makes obtaining a process model quite tricky through the application of traditional approaches.
Study Limitations
Although the study aims to present a novel model, however, it is important to notice that there are complexity and roughness which exists within additive manufacturing processes. This is per-haps due to the constraints imposed by the manufacturer devices and within the context of their design. Accordingly and based on a much dimension of parameters; resources must be adopted and allocated intelligently. One another essential issue mentioned is the amount of uncertainty which exists in the additive manufacturing processes. For instance, the uncertainty of the heating transfer patterns and precise interaction of the parameters. Also, the data collection within this context where there are limited sensors as the sources of data and also measurement techniques set a vast amount of constraints on the studies.
THESIS STRUCTURE
As illustrated in the following figure and based on the structure a brief review of the back-ground, history, constraints, and definition of the additive manufacturing alongside state of the art is represented. Moreover, appropriate machine learning techniques are reviewed in order to illustrate the possibilities, advantageous and disadvantageous of this practice in the context of the AM processes. Afterward, some of the application and the cases would be demonstrated accordingly and a final conclusion is presented at the end.
DESGIN AND ANALYSIS ARCHITECTURE
The design architecture is constructed based on the main elements of design. This includes the type of the process, the practice to obtain the most influential parameters and defining the dimen-sionality of the process (dimension analysis and reduction), design of the experiments in order to collect data, implementation of the experiments, measurements and data processing and finally ap-plying the machine learning algorithm with the goal of estimation and predictions of parameters. All of these form the essential means to implement a novel design.
FDM and the WAAM processes are selected in this case for the design process. Next, it is required to use analytical methods to detect the most influential parameters for analysis. With the parameters at hand, a design of the experiment is nominated to find the interactions among param-eters and especially on the desired outputs. Subsequently, with the experiments implementation, outputs are measured using for instance scanners and other measurements devices. Finally, the gen-erated output data will be used for training artificial neural networks to analyze the data and the impact of the parameters.
ADDITIVE MANUFACTURING
Additive manufacturing is a process where the desired part is built by deposition or an incre-mental layer-by-layer production procedure. Most of AM technologies use either wire or powder as the source. Then the source is deposited or melted by a focused heating process, and then it will form a part with solidification [5]. This part or object can be made of plastic, a metal material such as steel, aluminum, and titanium or any other material (body tissue)[6][7][8][9].The advantage that the AM holds is the unique design and short lead-time in comparison to subtractive manufacturing methods [10]. As it is stated, the AM inclines to maneuver from rapid proto-typing to applications with rapid manufacturing. However, there is a necessity for knowledge acquisition in such pro-cesses. Especially in micro-structures that are made as a consequence of optimized process param-eters and manufactured parts [11].
1 2
History
The AM history dates back to 150 years ago. This was done by building topographical maps and sculptures from 2D layers. Later that in 1960 and 1970 some proof of concept has been pre-sented as a use of photopolymerization, powder fusion or sheet lamination in 1979 [12].
In 1989, MIT presented a patent of a 3D printing and later that in 1990 the laser beam melting (LBM) was introduced successfully [13][14]. On the other hand, the FDM along-side of the stereolithography, solid ground curing and laminated object manufacturing were introduced in 1991[15]. Meanwhile, it is worth to refer to this fact that the AM advancement was very dependent upon the development of the programmable logic controllers which later on with availability of the computers (such as CAD and CAM) systems, substantial means paved the way to help the improve-ment of this process.
1 Courtesy of Instrumentaria [9] 2 Courtesy EOS GmbH [7]
Figure 3: Illustration of tissue production by means of AM process [7].
In the 2000s, newly commercialized technologies fueled the growth of the AM as with the introduction of the electron beam melting (EBM) [16]. This development was affected by file for-mats AM processes, such as STL, LEAF, and LMI where they stand for Stereo Lithography, Layer Manufacturing Interface and Layer Exchange ASCII Format [17]. All of these tools have assisted in quality improvement, and with the emergence of the internet and with the support of open-source hardware and software developments, AM processes regarding development has grown immensely.
3
Digital workflow
AM process holds a data flow, which is made for the machines in order to generate the re-quired instructions and to generate the final parts. This is also accompanied by a physical workflow, which matches the data preparation and digital workflow. On the other side, the solid work-flow is initiated using the AM technologies; these include the binder jetting, deposition, extrusion, material jetting, powder fusion, lamination, and polymerization. With this direct production; models and prototyping would be possible for the AM processes. Meanwhile, Meanwhile, in [18] the need for data structure, data generation and formation with a novel approach of data decomposition is illus-trated.
Design Manufacturing and Assembly
AM design is considered an optimization and as a goal to reduce the development time and the cost. Hence, this helps in quality and performance boosting. It also can lead to profitability concerning consideration of constraints. Meanwhile, it can be stated that the design process would have three levels where for the first level concrete tools and the required techniques are addressed. On the other hand for the second level, it will tend to provide a better understanding of the quality of process design. Moreover, at the highest level is that it investigates the impacts of relations be-tween the design and the manufacturing on the designer, process and the practice[19][20].
3 Courtesy of Siemens www.siemens.com/
Design Requirements
In practice, the design is different from the conventional designs perhaps all regarding knowledge, rules or even tools. Therefore, it is required to obtain the design rules and tools which are compatible with different types of constraints and features imposed by manufacturing processes. That is where the need for the process tools and similar rules emerge while it is considered as among the most disputed challenges an AM process can face [21].
Design and Opportunities
The designs will be accompanied by opportunities and benefits. These benefits are mainly associated with the additive manufacturing process with freedoms. Mostly, the design is evaluated regarding part level or micro-macro complexity or multi-scale complexities. In process material choice, color and topologies would be considered as other production design factors[22][23].
Constraints
The AM process with all the capabilities and potentials is also facing limitations, which must be considered by the designers. These limitations are manifested in forms of constraints, which are categorized in groups. This includes the discretization and directionality and the requirements for a novel design. Another critical constraint is the machine with their features and capabilities. Manu-facturing parts are specifically impacted by this. On the other hand, materials that are being used in the process are influencing an AM process. In this term, raw materials can be used though they must be adapted accordingly. Metrology and control quality techniques are also imposing signifi-cant difficulties in an AM process. They are mainly related to material verification and geome-try.Embedded design and materials from a different point of view will apply maintenance, repair and recycling constraints. This is while the design concerning regulations is also subject to con-straints this is applied in such as aerospace and medical application where an approval grant is necessary before final use. In conjunction with this, some of the limitations are connected to Com-puter Aided Design Models shortly as CADs. Therefore, the design of complex and final products would be challenging due to the parametric nature of natures. That would because of the appropri-ateness of such models for old-style processes and not gradual shapes[23] [24].
Costs
For the industrial applications, the AM is adopted as a production method where it is subject to cost. This is where the cost emerges as a barrier for AM process in industry. However, it is helpful in terms of economic to understand it and benefit where it is a motivation for manufacturing com-panies. One of the significant cost which is studied, is the production and parts cost. This can in-clude the labor cost machine and material. Others can inin-clude the failures; transportation etc. dif-ferent cost models are represented in order to optimized this concept and increase the feasibility. Build time and energy consumptions are the other factor. The goal would be to discover the strate-gies in all life-cycle which can result in process and product cost optimization [23][25].
FUSED DEPOSITION ADDITIVE MANUFACTURING
Fused Deposing Modeling shortly referred as FDM is developed by Stratasys and is consid-ered to be as one of the essential extrusion-based AM processes. This method uses a heating section denoted as a heat chamber to melt a polymer-based material by applying a filament feeder system. The chief merits of the FDM process are categorized and presented as follows:
• Material type and ranges
• Mechanical property
• The strength of the material
Meanwhile, this technique cannot be efficiently welcomed due to the following shortcom-ings:
• Build time is usually high
• Speed and acceleration is slow
• It requires a point-wise plot and deposition [26]
However, the polymer extrusion technologies and especially the FDMs are the AM processes where they are applied habitually and are the subject of research even in other fields such biology.
FDM usually encompass melting, extrusion, deposition, and solidification whereby applica-tion of thermal energy conducapplica-tion the material will become molten and distributed for the cooling while it is infusing the layers by thermal bonding. One important thing to note is that in the process different methods can be used to deliver the filament concerning deposition. These includes
1. Self-extrusion
2. High-pressure plungers 3. Rotary pumps
4. Thermoplastic liquefier delivery [25].
In this thesis, a liquefier delivery technique with an extruding filament is studied. In FDM the layers are deposited in the same direction of the flow of polymer melted by a nozzle and result-ing in shapes that would have a form of a flat ellipse. In FDM, observation of the complicated phenomenon in order to control the process has been the subject of studies for a long time. These consists of tackling with the problems such as thermal transfer and tension, layers deposition, bond-ing process and coolbond-ing time.
Meanwhile, nozzle behavior understanding and similar design of it besides the control of thermal behavior must become the main focus of the studies since they have shown a quality in-crease in cases [27] [28].
Moreover, two questions seem to be addressed as part requirements are achievable or not and what are the optimal manufacturing parameters to reach the desired part specification. In this case, the prerequisite for an approach to use as a closed loop control method would be required such as metamodeling techniques in order to realize a novel controlling unit [29].
Furthermore, a significant factor in the design of 3D products especially the FDM is the con-sideration of the processes in three necessary forms. This is very vital for designers to keep track of the product and its status in these steps.
For instance, in the pre-processing section, a model of a product is created using the 3D CAD models. After that, this model fundamentally is sliced into 2D layers of equal heights where the 2D layers are made of contours. These contours are in next step translated into trajectories using path planning algorithms where they will be translated into actuators commands. In some cases, these trajectories will become present as geometric codes or simply as g-codes.
Figure 7: Illustration of the printing steps.
G-codes are prepared codes where they determine the type of motions in contours. The g-codes are following a program based files where they include a sequence of words in a block. Each block and each word has a corresponding meaning where it establishes a command.
In general, the flow of the work in the pre-processing section of printing can follow the subse-quent model:
Figure 8 : Illustration of a G-Code block with corresponding functions.
WIRE-ARC ADDITIVE MANUFACTURING (WAAM)
One of the section which is the part of WAAM is the welding unit. This unit is constructed from the following compartments and establishes the welding unit[30].
Welding Techniques
There are numerous welding techniques with different characteristics can applications. Among these welding techniques, some hold greater importance concerning application in additive manu-facturing which is studied subsequently.
GMAW welding
It is one of welding used in the additive manufacturing and is mostly reached by its subcategories namely MIG and MAG welding which are introduced as follows.
MIG / MAG Welding
It stands for the metal inert gas welding or the metal active gas welding. Within these processes, an arc is made and with heat generated by the arc work piece and metal are in-fused for joining. Additionally shielding gas is provided to prohibit the working space from the contaminations. There are two methods one is a constant voltage, and the current one possibility is the alternating current. Historically they are used for aluminum welding and non-ferrous materials[31].
TIG welding
It is a gas tungsten arc welding or shortly GTAW and is referred to as tungsten inert gas weld-ing. It is applied for arc welding using tungsten electrodes to produce the weld[32].
CMT Welding
The CMT stands for the cold metal transfer and is a technique which provides a stable arc and precise process control. What advantage this process has over the conventional method (MIG and MAG welding) is that it provides accurate welding by an alternation of the hot and cold process. This leads to spatter-free welding and seams with brazing. Lower heat input, less distortion, ex-tremely stable arc control precise droplet detachment infusion of thin-even coated which this would also lead to welds with joins of steel and aluminum. During this process, an integrated wire motion is provided which by retracting the wires by 130 times a second. As illustrated in the below the metal filler is moved toward the welding surface, and when the filler touches the surface or get close enough to the surface an arc is initiated, and the current correspondingly melts the material. Then the filler is retracted and helps the droplet detach with short circuits this would reduce the excessive heat. In the end, the wire is reversed, and the process begins again[33]. Due to difficulty and special requirements, three process is introduced for the CMT as follows:
CMT Pulse
It is a combination of the two processor cycles where a pulsed cycle and CMT cycle is in-fused and produces inputs with more heat. As a consequence, there would be an increase in performance and flexibility.
As illustrated in the above diagram the CMT modes and other welding processes are drawn based on the current and voltage which in general indicates the amount of power and heat. The CMT modes as illustrated are producing less heat and lower distortion. Arc also is controlled precisely.
CMT Advanced
This mode benefits from welding current polarity. The main feature of this process method is the reversal polarity. It short circuits the polarity of the reversal and provides a stable CMT. It also provides better deposition at a higher rate.
CMT Advanced and Pulse
This mode is a infusing the negative pole CMTs and poles pulsing cycles and provides a high precision arc[34].
Figure 11: Illustration of current and voltage diagram of CMT in different modes [30]. Figure 10: Illustration of CMT in Pulse mode [7].
Shielding Gas Types
Numerous types of shielding gases exists in this process where they would be as follows:
ACETYLENE (C₂H₂)
Acetylene, when used with oxygen, is suitable for welding and cutting steel and other metals. ARGON (Ar)
Argon is often used for MIG welding aluminum. It’s also used for TIG welding. ARGON / CARBON DIOXIDE (Ar / CO₂)
Argon/carbon dioxide blends are frequently used as shielding gas when MIG welding mild steel.
CARBON DIOXIDE (CO₂)
Carbon dioxide can be used as shielding gas when MIG welding carbon steel. KMS in Co-quitlam fills 5 and 10 lb. cylinders, ideal sizes for beer carbonation and freshwater aquarium systems.
NITROGEN (N₂)
Nitrogen is commonly used to clean refrigeration systems. It’s also an option for tire
inflation. Nitrogen is less susceptible to temperature variations than compressed air. Plus it reduces heat and therefore reduces rolling resistance, which can translate into fuel economy. For plasma cutters, nitrogen can replace compressed air.
OXYGEN (O₂)
Oxygen, when used with acetylene and other fuel gases, is ideal for welding and cut-ting stand other metals.
TRI-MIX (Ar / O₂ / CO₂)
Tri-mix applications include short arc, spray and pulsed spray arc welding of stainless steel and MIG welding mild steel.
Wire Feeds or Filler
Different types of filler are allowed to be given as the input to the wire feeder section. These include the 26 types of materials. Each of these fillers is offered in different kinds of diameters, and depending on the type of the diameter there is a corresponding shielding gas for each. The main fillers include:
• Nickel
• Stainless steel
WELDING DEFECTS
A defect in the welding process is referring to the realization of any non-desired formation in welding which is considered as improper and based on the criteria categorization an incorrect weld-ing pattern. These defects usually manifest in the form of:
• Size
• Quality
• Or Shape
Moreover, based on the location of that they occur, they can be categorized as:
• Internal
• Or external
Namely, the welding defects would be as the list of following: 1. Cracks 2. Porosity 3. Undercut 4. Slag 5. Spatter 6. Fusion 7. Penetration 8. Overlap 9. Crater
In Figure 14 a proper welding is portrayed. Subsequently, some of the defects are considered more in-depth as in following sections [35][36][37][38][39].
Figure 13: Illustration of categorization of the welding defects.
Cracks
This type of defect is more present on the surface and also in depth of the welds around the heat-zones Figure 15. Temperature is one of the affecting factors where it divides the crack into two sub-categories.
Hot
This sort of the crack is happening while crystallization is occurring.
Cold
This sort also happens usually at the end of the welding process and where the temperature is low. Visibility of this crack regularly must be checked after sometimes and even days later after welding.
Cracks usually happen due to the ductility of the base material. Carbon and Sulphur existence on the material can also cause such issues. Application of the hydrogen as a shielding gas through the process besides the rigidness of the materials for expansion or contracts. Cracks can usually be the cause of stress in the process too.
To reduce the risk of having cracks in the welding process; adopting a novel material is re-quired. Meanwhile, another method is to pre-heat the process and reduction of the cooling time. The gap of materials for the base and the filler of the welding and during the welding process must be addressed to avoid the cracks.
Undercuts
This phenomenon happens when the weld and base melt away from each other. At this stage, a groove of notch shaped is formed which is referred to as the undercut Figure 16. The general impact of this process will manifest in a reduction of fatigue strength of the weld and joints.
This usually happens when the arc voltage is very high and also if a wrong filler is used. One another important reason for such defect is the welding speed where with a higher value it would become more susceptible for undercut defect. To reduce the risk of an undercut defect, it is required to decrease the arc length or arc voltage. Proper setting of the filler diameter as becoming smaller can help in reducing the undercuts. Also, adequate adjustment of the angle of the welding with consideration of travel speed can help reduce the undercuts.
Figure 15: Illustration of the crack defect.
Spatters
Spatters or spattering of metal drops which is observable and well-known in welding pro-cesses refers to a phenomenon where droplets of metal during the welding will become expelled and will be left on the surfaces Figure 17. One of the main reasons for this effect is the amount of high welding current. The long arc with an incorrect polarity will also lead to a higher amount of spatters. As a consequence for reducing the amount of spatters it is required to Arc Length reduc-tion, and current of the weld besides checking the right polarity of welding can help in spatters reduction. Adjustment of welding angle and use of a proper shielding gas will assist in reducing the spatters in a welding process.
Porosity
The porosity defect happens when gases in the form of bubbles will become trapped in the welding Figure 18. Filler property and larger arcs with a high current can lead into porosity problem. Increased welding currents. The hazardous material on the welding base such as oil or rust can lead in spatters. Therefore, to reduce the main effecting causes the reduction of the current, adopting smaller arcs and removal of hazardous material on the surface of the welding properly would assist in the removal of porosity.
Figure 18: Illustration of porosity defect in welding. Figure 17: Illustration of welding spatters around a welding bead.
Overlap defect
This defect happens when the weld is going to be extended beyond the weld toe and occurs where the weld forms an angle usually smaller than 90 degrees Figure 19. This often occurs with the improper welding and large wires or electrodes and also with using high current. Consequently, for reducing the risk of having overlap defect, it is suggested to have proper techniques for welding and using smaller wire or electrodes and reduce the welding current.
Crater & Slag
This type of defect emerges in the welding and when the craters have the trouble of being poured before an Arc is initiated. This would lead to outside edges to become cool earlier and will lead to stress and cracks. The main reason is the torch angle and large electrodes or fillers. For not confronted with such an issue it is suggested to adjust the angle and use a proper welding material.
While, Slag defect usually affects toughness or structure quality Figure 20. Usually, it either emerges on the surface, or the welding turns. The primary cause of the slag is the current and cor-responding density when it is small. This causes the reduction of heat on the surface of the melting metal. In addition, if the speed of welding is high, this can lead to slag occurrence. Welding
sur-face’s cleanness is another crucial factor for the slag to happen. The angle of the welding and the
travel rate would have an impact on the slag. To assist the process with slag, increase of current, adjustment of the speed (feed rate), modification of Travel speed and clean surface with a proper welding angle can help the reduction of the welding slag risk.
Figure 19: Illustration of the overlapping defect in welding process.
Fusion incompletion
The fusion incompletion is usually due to the improper welding. This will lead in solidifica-tion of the metal and constructing gap in melted metal Figure 21. Low heat input, large welding pool, wrong torch angle, and bead position are considered as the leading causes of an incomplete fusion. The increase of welding current, reduction of the travel speed and deposition rate, adjustment of the torch angle properly and adjustment of the bead position can help immensely in reducing the risk of the fusion incompletion.
Necklace Crack
This usually happens in the electron beam welding. When welding has not enough penetra-tion molten metal will not have proper flow and especially an in cavities and lead to such defect. The primary cause is related to the welding technique and when working with the material such as stainless steel, nickel base alloys, carbon steels, and tin alloys. Besides, another leading cause of this would be due to a high-speed beam welding. Hence, to diminish the risk of this defect, it is necessary to adjust the welding speed at a constant value properly and similarly to use a proper material and welding techniques.
Grooves and Penetration
This welding defect is happening when the groove of the metal is not filled Figure 22. This defect is also denoted as an imperfect diffusion or penetration. Typically, the grooves effect occurs when there is not enough deposition of welding and electrodes or welding filler is not as a right size. This is while welding technique is also playing a significant role. To tackle with this defect, it is essential to use adequate welding deposition and use an appropriate electrode or filler.
Figure 21: Illustration of an incomplete fusion defect.
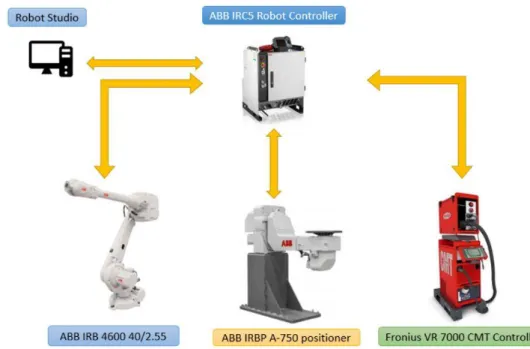
ENVIRONMENT
The environment which is applied for the manufacturing using the WAAM consists of the fol-lowing groups of equipment. Each section would be considered as an influential section on the AM process and correspondingly will affect the process and quality of the part which is printed. There-fore, analysis and addressing the impact which each section would have on the process would be required to lead an enhanced additive manufacturing process.
4
4 Courtesy of ABB adopted by https://new.abb.com/products/robotics/industrial-robots/irb-4600/
ABB robot manipulator
As it is illustrated in Figure 23, an IRB 4600 40/2.55 robot is used for the manipulation of the environment. This robot has 6 degrees of freedom referred to as the axis. Each axis is equipped with the following features where the working range and maximum speed of the axis are illustrated in the following table. This information must be taken into account as it will have a corresponding impact on the path and trajectory or the manipulator on any process.
The main application of this robot is manifested in the form of the: 1. Arc Welding
2. Packing 3. Laser Cutting 4. Assembly 5. Laser Welding
6. Machine tending and removal
The robot has the weight of the 435 Kg, and its respective dimension can be found in Figure 24. The dimension of the robot also is applicable in modeling and trajectory planning which have
significant impacts on the qualitative features of the AM process’s products especially for
applica-tions related to wire arc additive manufacturing [40] [41].
5
5 https://search-ext.abb.com/library/Download.aspx?DocumentID=ROB0109EN_G&LanguageCode=en&Document-PartId=&Action=Launch
Figure 24: Illustration of the working range of the robot.
IRBP A-750 Positioner
This positioner is an ABB product among other two similar variants (IRBP A-250, A-500) and is applied in order to rotate the work pieces on two axes. This ensures the reachability of the positioner in the process as they can handle the work pieces up to 740 kg load. Because this product is design as modular, it is considered as friendly service device [42].
Figure 25: Illustration of dimension of ABB IRB 4600-40-2.55 manipulator.
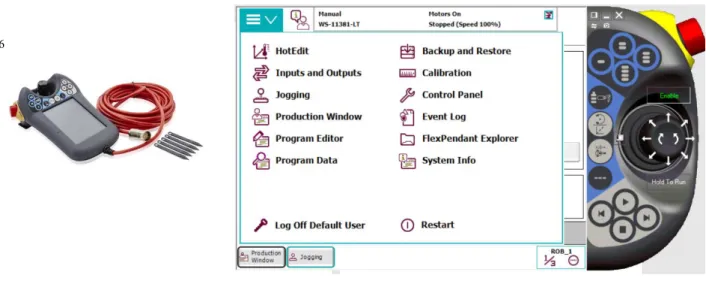
ABB teach-pendant
The Teach Pendant is joystick similar to a PlayStation or Xbox controller where it provides the tool for control, monitor and works with any manipulator designed by the ABB company. This controller is connected using a cable to the IRC5 controlling box. On IRC5 control box it is possible to adjust the robot operating mode whether to be in:
1. Automatic Mode 2. Manual Mode
3. Full speed 100% Manual Mode
With a nominated mode for operation, it is promising to launch, edit (program, positions), monitor and jog the robot in different procedures using the Flex Pendant. This, also, delivers a mean to connect different other external devices and to monitor or edit a networking interface with online services such as cloud systems in order to collect data, model or modify the robotic arms beside the external devices such as in this case the Fronius welding devices. For instance, the information about the welding process and the position of the robots could be available using cloud services and IoT technologies. Further information regarding the Flex Pendant cloud is found on the ABB robot website and through the catalogs.
6
6new.abb.com/products/3HAC028357-001/teach-pendant
Figure 27: Illustration of operation modes of the robot.
Cold Metal Transfer System
The Cold Metal Transfer System is constructed from multiple subunits with a corresponding role in the welding process. These as illustrated in the following Figure 29 consists of a wire feeder unit where a roll of material, for instance, steel, aluminum, etc. is inserted in where 4-roller drive feed the material to the wire-spool until it reaches the working area.
The next section is known as the power source where the electrical unit is located and defines the amount of power delivered to the working pieces. It is benefiting from a microprocessor where it inverts the power necessary for the welding process and ensures the welding process em-brace all the defined properties.
The other section is the cooling unit which provides a cooling medium for the welding system and guarantees the water cooling process for the welding torch. The RCU 5000i is the remote con-troller unit where the parameter, modes of welding (TIG-MIG, CTM modes, 2-step, 4-Step modes), external or internal control commands are defined as jobs in this controller and allowed authorities (with the login option) can modify the jobs to perform the welding process.
The next unit is the Wire Buffer. This Unit is a coupler which connects the front and the rear drives. This paves the path for the wire to travel smoothly. The Robacta Drive CMT unit is a gear-less unit where forward the wire material and almost 90 times back up in second to ensure the reliability of the constant wire contact pressure. This would bring about a better quality of the weld-ing process. The contec contactweld-ing system has the role of ensurweld-ing the contact surfaces and the force of the contacting system and welding wire is kept at a specific range. This unit is useful to maintain and keep the contact tip uniformed where to control the uneven wear and behavior of the process.
7
7 www.fronius.com – TransPuls Synergic 5000 CMT Product information
Torch
The ABB IRB4600 40-2.55 robot is equipped with a tooltip of a Fronius welding torch as illustrated in the following Figure 30. This welding torch consists of two main parts where they are as follow:
Robacta Drive CMT
Robacta 5000 torch neck
The Robacta Drive CMT is constructed by 1. A Torch
2. Wire Buffer 3. Drive Unit 4. Hose pack
Depending on the type of the application the torch is chosen as either of Robacta 280, 300, 400, 500, 700 or 5000. These torch necks would have a corresponding angle as 22̊ or 36̊. However, these are also presented in 0̊ and 45̊ format too Figure 31. The torch angle and specifically the angle made to the working object is playing a key role in the quality of the welding and must be considered respectively.
8
8 www.fornius.com-Robacta 5000 manual
Figure 30: Illustration of the Fronius Welding Torch.
The torch necks are also constructed from sub-components Figure 32 referred to as wearing parts which they shape the characteristics of the welding torch. One of the weightiest components is the contact tip which defines the size of the wire feed. Moreover, as it will be illustrated they would be considered as significant influential parameters in welding. Meanwhile, another sub-com-ponent is the gas nozzle. The gas nozzle defines the behavior of the flow of shielding gases. This affects the quality of the welding.
9
When the attachment of the wear parts and other related components is finalized; the torch neck is attached to the drive section forming the welding torch Figure 33 and Figure 34.
10 11
9 www.fronius.com/downloads- Robacta 5000 torch body manual page 12 10 www.fronius.com/downloads- Robacta CMT Drive manual
11 www.fronius.com/downloads-Robacta 5000 torch body manual page 38
Figure 34: Robacta Drive CMT. Figure 35: Robacta 5000 with a touch sensor. Figure 33: Illustration of attachment of Robacta Drive and 5000 torch bod. Figure 32: Illustration of the torch neck wear parts.
The welding torch also as mentioned before will be connected to the shielding gas capsule and wire feed system where they form all together the architecture of the welding compartment illus-trated in the following Figure 36:
12
The red signs indicate the existence of the welding material inside the wire feed unit. This passes through a hose beside other signals and power cables, reaching the welding gun which makes the wire feed material available in the torch for the welding process. This hose also supplies the shield-ing gas to the weldshield-ing gun. For instance, MISON 8 gas which is a combination of the CO2, Ar and
NO is supplied for the construction steel welding and manufacturing applications13.
12 Robacta, Robacta Drive MIG/Mag Robot welding torches manual by Fronius
13 http://www.aga.se/en/products_ren/cutting_welding_gases/shielding_gases/mison_shielding_gases/index.html
METHODOLGIES AND STATE OF THE ART
Experiments implementation and especially experiments that one parameter value is changing over the time is considered to have the price of time and cost in order to evaluate. Therefore, it is required to optimize the collection of the data by applying methods which are time and cost opti-mized. The design of experiments shortly referred as DoEs are the methods that will maximize evaluation optimization by utilizing sufficient experiments. The following list is referring to some of DoEs which are used for design analysis and finally for inferences.
Factorial design
Combinational designs with different levels
Surface response design
Screening design
Mixture design
Tagouchi design
These methods are among the designs which hold different selecting criteria for analysis of the most influential parameters with their corresponding values [43]. Within the context of the AM processes, the extent of parameters that are involved in the quality of the manufactured parts is
great. This also demands to discover the experiments’ design space and parameters combinations
simultaneously. In such cases usually, sampling methods are more convenient to explore the design space in an efficient manner [44][45]. Additionally, one important concept that must be considered is the parts quality with ensuring repeatability. One reason for this maybe is the presence of un-wanted phenomenon and it is necessary to investigate it during the experiments implementation. Besides, in order to analyze the designing methods which are mentioned earlier, it is shown that fractional space consideration in DoEs can lead to promising results [43][46][47].
Alternatively, the poor repeatability in AM processes itself is controllable with consideration of the main parameters and by applying a closed loop control system on it. The novelty of this approach and the subsequent differences are more observable for variant parameters and especially in processes such as FDM. However, it is worth to mention too that usually, the repeatability prob-lem is originating from the latency of control processes. This is resolvable by ensuring the control-ling factors at a promising level [48].Therefore, such issues especially the latency of controlling factors must be well-addressed during the process and this requires great computation need. Meta-modeling techniques with the help of artificial neural networks in such cases can help to address the controlling of parameters efficiently. This illustrates better the importance of the modeling and can assist to reduce costs and to increase the quality. Likewise, experimental data and knowledge will be necessary to model the AM processes appropriately. In order to construct models for a given data, statistical regression model and other techniques could be applied.
In [49] mathematical formulation of the bead width models using genetic programming ap-proach is studied. Similarly, in [50] by using Tangent Overlapping Model, a bead analysis is con-ducted for WAAM processes. Moreover, in order to increase the forecasting capabilities, the genetic programming modeling and hybridization with computational methods such as artificial neural net-works, fuzzy logics, regression trees, and support vector machines are conducted [51][52].
Furthermore, in [53] a 3D printed FDM part is processed by evolutionary calculation algo-rithms while the study of the AM processes using computational techniques are found to perform better and even artificial neural networks has shown better performance in comparison to genetic programming and regression algorithms[49].
Nevertheless, these computational models are used correctly; however, they are time-consum-ing and there is a necessity for ustime-consum-ing strategies that can be applied to avoid intensive computations. Metamodeling approaches can provide such strategy by using artificial neural networks and in order to control the involving parameters. This type of modeling can be beneficial concerning prediction and it also can support closed-loop control systems. In these conditions, the cost of the learning approaches in artificial neural networks would be high. Then it is required to apply a technique which reduces the amount of experimental learning data but with better or close to approximations that are used with a high amount of training data.
One approach is the minimization of the data by using an expert or a physical knowledge and applying management procedures and integrating this knowledge into artificial neural networks. The process of knowledge extraction will provide the possibility of using the knowledge that is exciting especially in, and it can be used for design and planning [54][55].
Dimensional Analysis Methodology
One of the frameworks which are used to translate the existing knowledge is the Dimensional Analysis Conceptual modeling [49] and its practices and encodes the existing knowledge linked to a system. This representation provides a causal graph which is capable of constructing a ground for an adaptive artificial neural networks training. This modeling technique benefits from system boundary and objective definition which provides a better understanding of a system. This method similarly provides a function representation that contributes to the functions and their order in a system and demonstrates its various performances. The DACM approach has the role of transform-ing these functions into generic functions and applies causal rules inherited form Bond graph theory for the description of a system.
Subsequently, behavioral equations are constructed by using this method for the bond graph, and with the similar nature, a color is allocated to each node for representation of parameters. The model of the system can in future be used for simulations purposes such as quantitative or qualita-tive. Finally, the modeling process in this method ends at the point whether details of a system of interest is provided or not [56][57][58].
Computational Methodologies
DACM besides another type of component analysis modeling approaches will provide the mathematical relationships that manifest the linked between variables. This is where in [59] prin-cipal component analysis is used as a feature extraction tool for obtaining sensory data and similar associations. These sensory data are applied for analysis by statistical approaches or artificial neural networks such as Bayesian Neural networks to predict the desired output. Knowledge and features are also extracted by employing another type of machine learning and information processing such as Mutual information method. With such tools, there is a possibility to define the amount of infor-mation mutuality among the parameters [60]. One another advantage is the ability to check a linear or a non-linear reliance with these computing tools.
This is while, application of other machine learning techniques such as Bayesian neural net-works in manufacturing processes are still the subject of research such as the application of the quality analysis in manufacturing processes [61].
Artificial neural networks as computational tools are also used in variant processes and have the strength of prediction of output parameters of an interesting process. These tools can model different developments by using computational power and optimization techniques and to provide precise solutions for the estimation of desired variables. The chief merit of using artificial neural networks is the capability of computing unclear data and describing the behavior of complex sys-tems. In the meantime, it is worth to mention that the artificial neural networks are the models which not only require a large number of data samples but also they would require a high amount of computational power too [62][63].
Analysis of Variance (ANOVA) Methodology
This statistical method is an analytical technique that interprets the difference between sets of parameters or values. This method assists the researchers in the recognition and assessment of the parameters and discovers the possible interactions between variables. ANOVA usually address the questions that indexed variables are affected by each other or not? Moreover, this method is used to compare the different values of the variables. It is usually conducted for different type of independent and defendant variables and also for different number of groups this is conducted as One-way ANOVA, Two-way ANOVA or Multivariate ANOVA. In Addition, this technique is ac-companied with follow up tests to evaluate variant groups of variables and [64][65].
Machine Learning Methodology
At this stage, it is worth to refer to the artificial neural networks and overview different types of these computational tools. Therefore, in this case, the computational intelligence or machine intelligence would be a branch of computational science that intelligent agents are designed for analysis and estimation purposes. Also, this would assist in perceiving an environment and to reach an optimized evaluation and perception of the desired environment. Artificial neural networks are bio-inspired networking systems that can communicate, learn, reason and adapt to different condi-tions. Meanwhile, they can perform statistical modeling and being an alternative solution for lo-gistic statistical regression methods with the power of being easily transferred to different platforms [66].
Recently, Artificial Neural Networks (ANNs) are used as computational modeling tools to model and develop complex real-world problems. The main characteristics of ANNs are known as nonlinearity, high parallelism, robustness, fault and failure tolerance, learning ability to handle imprecise and fuzzy information, and their capability to generalize [67]. Nonlinearity makes better fit to the data and high parallelism indicates fast processing and hardware failure-tolerance. The main goal of ANN-based approaches (neuro-computing) is providing and developing mathematical algorithms that facilitate ANNS to learn by mimicking information processing and knowledge ac-quisition in the human brain.
In 1958, the procedure of the single artificial neuron and the perceptron have been introduced to find a solution for problems of character recognition [68]. The inputs of an artificial processing neuron are received from the environment, they act as stimuli. Then, the neuron combines them in a special method to form a net input, applies a linear threshold gate, and transfers the output to another neuron or the environment. A system with such structure is called the Perceptron. The Per-ceptron generates a mapping between the inputs, stimuli, and the output.
ANNs can provide a lot of advantageous and require less need for training and can detecting complex relations among parameters with non-linearity. Correspondingly, ANNs can discover the interaction between variables independently and intrinsically.
Some of the application is that in general, AANs are more robust and often perform better than other computational tools in dealing with a variety of problems from different categories such as follows:
I. Pattern classification: In pattern classification tasks, supervised learning is used to assign
an unknown input pattern to one of predefined classes based on one or more features that describe a given class.
II. Clustering: is based on unsupervised learning. In clustering problems, clusters (classes)
are designed based on similarities and dissimilarities between the input patterns according their inter-correlations. In the clustering network, samples in similar patterns are clustered in a class.
III. Function approximation and modeling: the goal is to approximate the principal rules
associate with the inputs to the outputs. Function approximation is used to solve tasks where theoretical-based models are not available, data is gained from observations or ex-periments or to replace theoretical models with complex computation by using acquired data from such models.
IV. Forecasting: given a time series samples from an observation with a certain phenomenon,
an ANN is trained and then is applied on another observation to forecast (predict) its be-havior in future.
V. Optimization: the target is to maximize or minimize a function subject to a set of
con-straints.
VI. Association: an ANN is trained by using an ideal data without noises and then is applied
on a noisy data to classify the data.
To refer to some of the disadvantages, it is worth to refer to the fact that there is less amount of understanding about the hidden layers of neural networks and they are susceptible to overfitting and consequently generalization problem. Also, they put a lot of burden by immense computational power on users [63][66][69].
By the same token, it is common to face several forms of complications and the interest is to find the paramount and optimal solution with finding algorithms or set of instructions that transform the input of a system to the target outputs efficiently (especially concerning computational speed and memory requirement). For another kind of applications the knowledge of transformation (in-puts to out(in-puts) is at hand, but in most of the cases it is required to obtain the knowledge.